
Statistical analysis for genome-wide association study
2015-12-22 09:15PingZengYangZhaoChengQianLiweiZhangRuyangZhangJianweiGouJinLiuLiyaLiuFengChen
Ping Zeng,Yang Zhao,Cheng Qian,Liwei Zhang,Ruyang Zhang,Jianwei Gou,Jin Liu, Liya Liu,Feng Chen,✉
1Department of Epidemiology and Biostatistics,School of Public Health,Nanjing Medical University,Nanjing,Jiangsu 211166,China;
2Department of Epidemiology and Biostatistics,School of Public Health,Xuzhou Medical College,Xuzhou,Jiangsu 221004, China.
Statistical analysis for genome-wide association study
Ping Zeng1,2,Yang Zhao1,Cheng Qian1,Liwei Zhang1,Ruyang Zhang1,Jianwei Gou1,Jin Liu1, Liya Liu1,Feng Chen1,✉
1Department of Epidemiology and Biostatistics,School of Public Health,Nanjing Medical University,Nanjing,Jiangsu 211166,China;
2Department of Epidemiology and Biostatistics,School of Public Health,Xuzhou Medical College,Xuzhou,Jiangsu 221004, China.
In the past few years,genome-wide association study(GWAS)has made great successes in identifying genetic susceptibility loci underlying many complex diseases and traits.The findings provide important genetic insights into understanding pathogenesis of diseases.In this paper,we present an overview of widely used approaches and strategies for analysis of GWAS,offered a general consideration to deal with GWAS data.The issues regarding data quality control,population structure,association analysis,multiple comparison and visual presentation of GWAS results are discussed;other advanced topics including the issue of missing heritability,meta-analysis,setbased association analysis,copy number variation analysis and GWAS cohort analysis are also briefly introduced.
genome-wide association study,quality control,multiple comparison,population structure,genetic model,statistical model,missing heritability,meta-analysis,copy number variation
Introduction
Genome-wide association study(GWAS)refers to study in which hundreds of thousands of single nucleotide polymorphisms(SNPs)are genotyped across the genome and tested for association with the phenotype of interest.In the past few years, numerous genetic susceptibility loci have been identified to be associated with many complex diseases via GWAS,including a variety of cancers[1-7],bipolar disorder,coronary artery disease,Crohn’s disease, hypertension,rheumatoid arthritis,type I and II diabetes[8-13],inflammatory bowel disease[14],non-obstructive azoospermia[15],obesity[16],and etc.GWAS discoveries can be found at the National Human Genome Research Institute(NHGRI)catalogue[17]. There are 1,724 publications and 11,680 SNPs until 01 October,2013(Fig.1)[17].These findings offer new genetic insights into understanding the pathogenesis of diseases and disorders,and are expected to promote preventive strategies,diagnostic tools and treatments.However,the massive amount of GWAS data poses many statistical and computational problems as well as data storage and management issues[18-22].GWAS can be conducted in both population-based and family-based manners,but here we focus primarily on case-control studies,which are currently the most common design.This article aimed togive an overview of the widely used approaches and strategies for GWAS,including quality control,treatment of population structure,association analysis,multiple comparisons,visual presentation of the results, and other advanced topics.
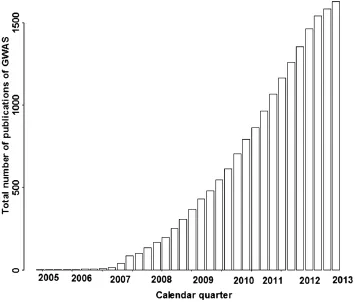
Fig.1The total number of published Genome-wide association study(GWAS)worldwide since the first GWAS work was reportedin2005.Onlythoseattemptingtoassayatleast100,000SNPs
Data quality control
Data quality control becomes extremely important for GWAS,it is now an imperative step to check and clean the raw GWAS data stringently prior to any analysis[20,23].Here,we only discuss the statistical procedures to ensure the validity of data,i.e.,the data filtering procedures that are applied once one already has genotype calls.The checks are performed throughout individuals and SNPs,those not meeting the criteria are deleted.All of the quality control procedures mentioned below can be conducted through PLINK[24],a freely available tool that implements large scale GWAS data managements and analyses in a computationally efficient manner.
Missing rate
Individuals with high missing call rate are implications of poor DNA quality.The missing call rate of individual is the proportion of SNPs whose genotypes are not called for a given individual.We generally remove the subjects with missing call rate>1%-5%. SNPs with high missing genotype rate(e.g.,>5%) imply some problems with the genotyping process, so these SNPs are eliminated.The missing call rate of SNP is the proportion of individuals whose genotypes are not called for a given SNP.
An alternative way to handle missing SNPs is to perform data imputation,i.e.,replacing the missing markers by their expectations conditional on information of the observed markers based on reference datasets, such as the panels of HapMap and 1,000 genomes. Imputing genotype data not only provides complete data for multiple markers analysis but also allows testing of untyped SNPs and combination of different data across genotyping platforms to conduct metaanalysis[11,16].Further information regarding genotype imputation can be found in the literature[25-29].
Minor allele frequency
In practice,SNPs with minor allele frequency (MAF)<1%are excluded from subsequent analysis as current SNP-chips genotyping rare variants(i.e., locus with MAF<1%)is difficult and error-prone. Thus,very low frequency alleles are likely to represent genotyping error and may result in spurious associations[68].Furthermore,the statistical power is extremely low for such rare SNPs[8,20,30].For example,provided that the odds ratio(OR)is 1.30,a study of 6,000 cases and 6,000 controls provides only approximately 0% and 3%powers to detect disease susceptibility loci with MAF of 0.01 and 0.02,respectively[30].
Independence of individuals
Sometimes the apparently independent subjects in GWAS have hidden relationship which may lead to spurious associations[31].Independence among samples is also the fundamental assumption of case-control study.Thus,the related individuals are excluded or the relations should be taken into account during association analysis.The probable relatives and duplicates are detected based on pairwise identify-by-state(IBS) from which a variable called PIHAT is calculated via PLINK[24].Individuals with high PIHAT(e.g., PIHAT>0.25)are removed.
Hardy-Weinberg equilibrium
Since some association analysis approaches are developed under the assumption of linkage equilibrium.It is beneficial to check whether the SNPs deviate from Hardy-Weinberg equilibrium(HWE)for quality control.For this aim,each SNP is examined by using the asymptomatic chi-squared test or the exact one[32],and then the SNPs with P-values less than 10-5-10-6are safely removed from further analysis. However,it is noted that departure from HWE can occur due to selection,population admixture,cryptic relatedness,genotyping error and genuine genetic association.Thus,checking HWE only in control is usually
recommended[8,20].In fact,deviation from HWE in case is typically regarded as a signal of true association.
Sex check
Sex is an important covariate in some GWAS such as lung cancer study[6],where sex check becomes necessary.We use X chromosome data to estimate sex and compare it to self-reported sex.Discrepancy of reported and estimated SEX is further examined. Sometimes,the original documents should be retrieved to resolve this issue.Those records with discrepancies on sex are suggested to be removed if the discrepancy cannot be resolved.
Population outliers
The check of population outliers can be finished by performing an IBS-based nearest neighbor analysis in PLINK[24].For each individual,the distance to its nearest neighbor is calculated,and then from the distribution of distance,we calculate a sample mean and variance and transform this measure into a z score.If an individual has an extremely low z score(e.g.,<4 standard deviations),this individual has significantly different genetic background from the rest of the study sample and should be excluded as outlier.
Other quality controls include the checks of Mendel error rate and heterozygosity rate.If the GWAS is family-based,the Mendel error rate can provide evidence of non-Mendelian transmission.The increased heterozygosity rate implies poor DNA quality[21].
It should be mentioned that there are no universally accepted thresholds for the exclusion criteria in quality control,but the values presented above are widely utilized in practical GWAS literature[6,8].It is also noteworthy that the values of exclusion criteria used in quality control are case-specific and dependent on other factors,such as effect sizes of SNP,sample sizes and genotyping platform.
Population structure
In association analysis,population structure can cause spurious findings if not accounted for,and it is one of the most often cited reasons for non-replication of previously confirmed variants[33-34].When the allele frequency differences between the case and control is due to systematic ancestral differences,it is said to have population stratification.Population structure also refers to population admixture,family structure, and cryptic relatedness.The population structure can occur in apparently homogenous study.A famous instance presented by Campbell et al.[35],where it was reported that an SNP was strongly associated with the height of European Americans,which are usually considered a homogenous population,but the relationship was later proven to be attributed to stratification.Various approaches have been proposed to detect and correct for the possible population structure[33-34,36].
Genomic control
Genomic control is a widely employed method to evaluate whether or not the population structure exists[37-38].In the presence of population structure, genomic control assumes that the chi-squared statistic X2is inflated by a constant inflation factor λ,which is defined as the empirical median of L unrelated statistics divided by the expected median under the null distribution
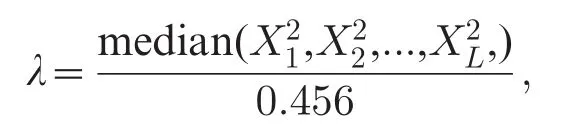
where L is generally selected less than or equal to the number of SNPs m,and 0.456 is the expected median of the chi-squared distribution with d.f.=1.In theory, λ should be equal to one in a homogeneous population. So a value greater than one implies population structure.Note that the inflation of statistics may be not due to population structure alone.For example, only part of the inflation is explained by population structure in terms of a recent study[23],and it was found that there were other confounders such as differential bias or informative missingness,collectively leading to the inflation.
Genomic control corrects for population structure by rescaling each test statistic using uniform inflation factor,i.e.,using X2/λ in place of X2.It is easy and fast to compute,and can deal with cryptic relatedness as well as population stratification.However,some SNPs exhibit more differences in their allele frequencies than others;thus,the uniform adjustment is inappropriate and leads to a loss of power[39].The validity of genomic control relies on several assumptions[37],it is not known whether these assumptions hold in practice.It is also not clear how to choose appropriate threshold of inflation factor λ to assess the effectiveness of adjustment, and empirically a value of less than 1.05 is deemed as safety.
Structured association
Structured association is a model-based clustering method.It firstly uses a subset of unlinked null SNPs to infer the population structure and allocate individuals to subpopulations according to their likelihoods,
and then performs testing for association conditional on these allocations[40-42].The advantages of structured association are that it explicitly infers the genetic ancestry and that it is based on a rigorous Bayesian clustering algorithm.However,this method is computationally intensive when applied to large scale GWAS data,and is sensitive to the number of clusters[31].The structured association is carried out by the software STRUCTURE.
Principal component analysis
Principal component analysis(PCA)is frequently applied to account for population stratification[31,39]. The basic idea of PCA is to explicitly capture the hidden ancestry genetic background by extracting the top several independent axes of variation.Specifically,it suggests that individuals with similar principal components(PCs)are likely from the same subpopulation. The PCs are calculated using the singular value decomposition on the genotype matrix G.
By extensive simulations,it has been demonstrated that the PCA method,called EIGENSTRAT,has the following merits[39].The PCA performs well even under mismatching of case and controls;it can implicitly and automatically match cases and controls to extract the maximum possible amount of power from the data while avoiding false positives due to stratification.It is computationally feasible on GWAS data. Secondly,the continuous axes of variation can be used as covariates to correct for stratification in multi-marker association analysis,and it is not sensitive to the number of axes of variation used as long as there are a sufficient number of axes to capture true population structure effects[43].Thirdly,it is robust to inclusion or exclusion of the causal SNPs.
EIGENSTRAT is executed by the online software EIGENSOFT[39].Fig.2shows the scatter plot of two top PCs and the PCA correction for population structure using a simulated case-control data.The top PCs in EIGENSTRAT may be not able to capture the complicated covariance structure due to the family structure or cryptic relatedness in the sample,for which the novel mixed models that explicitly utilize the kinships among the subjects provide an effective control[31,44-46].
Multidimensional scaling
PLINK also provides an approach to population stratification by clustering based on pairwise IBS distance[24].Specifically,PLINK first considers every individual as a separate cluster,then clusters individuals into homogeneous subsets,and finally performs a multidimensional scaling(MDS)analysis to visualize substructure.Subsequent association analyses are conducted in each cluster if some clear evidence of population stratification is observed.
Association analysis
Single SNP scan
Association analysis by comparing allele or genotype frequency between the case and the control is central to GWAS.Although considerable efforts have been made in developing strategies for association analysis of GWAS,single SNP scan is still the most commonly utilized approach[18].It proceeds by testing each SNP sequentially with the null hypothesis of no association.The additive genetic model,implying that each additional number of copies of the minor allele increases the risk by the same amount,is often employed for association analysis although other genetic models are also considered[18,20].Let Gijbe the genotypes AA,Aa,and aa for the jthSNP (j=1,2,...,m)on the ithindividual(i=1,2,...,n), and a is the minor allele and A is the major allele. The additive genetic model corresponds to AA=0, Aa=1,and aa=2 with 1 degree of freedom (d.f.).
The additive genetic model is tested using the Cochran-Armitage trend test[8,37,47],which is equivalent to the score test in the logistic regression[48].Logistic regression is another popular method for single SNP scan.Let pijbe the disease risk of the jthSNP on the ithindividual,the logistic regression is[49]
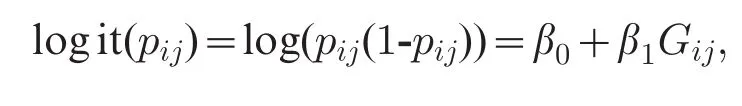
Here,β1=0 corresponds to the null hypothesis of lack of dependence.One of the three asymptotically equivalent tests,i.e.,likelihood ratio test,score test, and Wald test,can be applicable.Under the null hypothesis,any of the three test statistics has an chisquared distribution with d.f.= 1[48].Logistic regression offers a flexible tool that can accommodate interaction effects,covariates(e.g.,sex,age,and smoking)and PCs adjusting for population structure[18].
Similarly,linear regression,analysis of variance,and t-test are natural choices for association analysis if the phenotypes are quantitative,and survival models(e.g., Cox proportional hazards regression)are considered if the phenotypes are survival data.
Multi-marker analysis
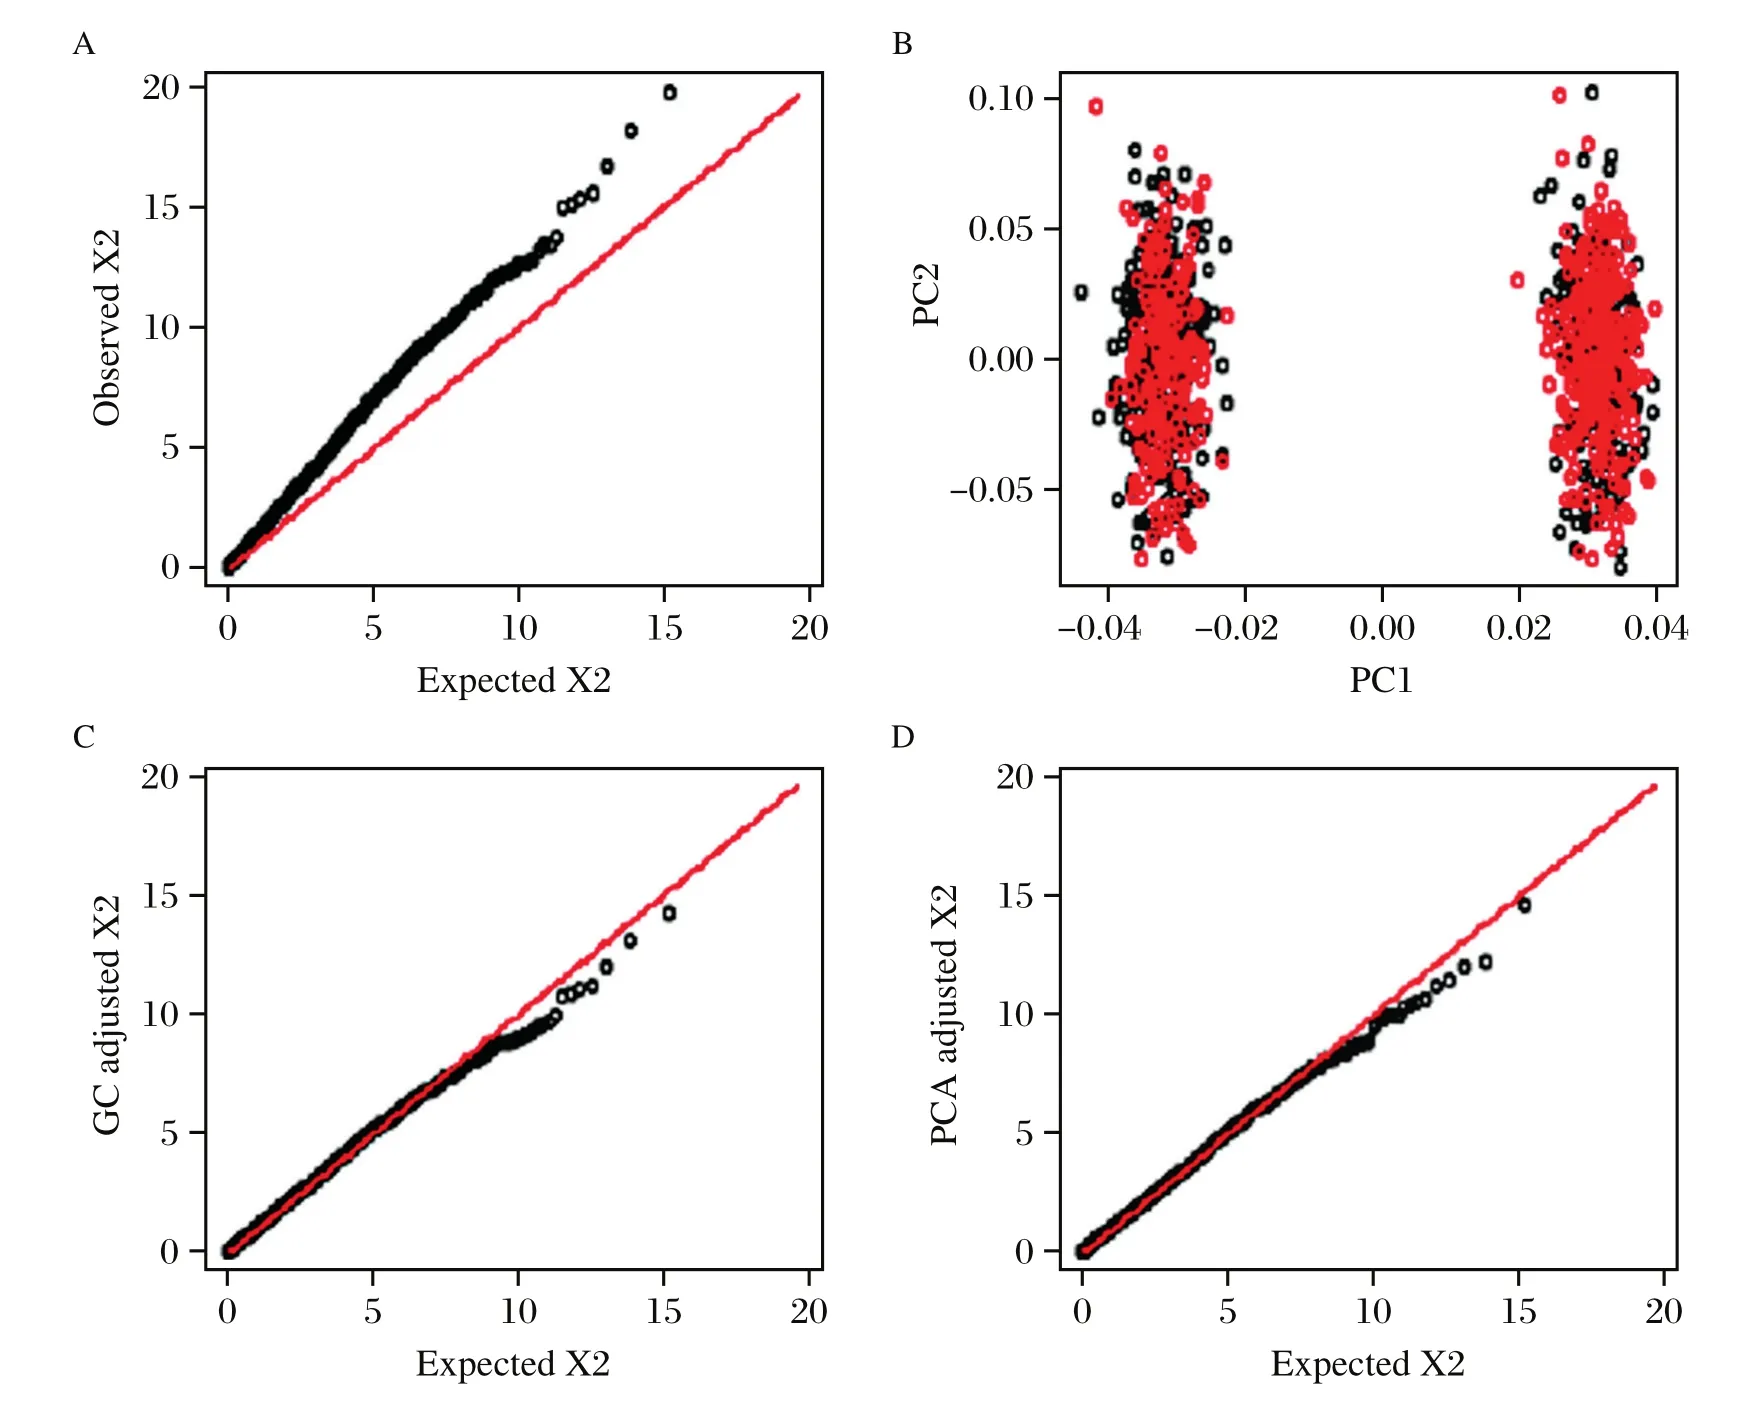
Fig.2The quantile-quantile plot and population structure adjusted by genomic control and principal components analysis. A:The Q--Q plot of the original chi--squared test statistics generated using Cochran--Armitage trend test.Departure from the diagonal is observed,the estimated inflation factor is 1.389(95%CI:1.343--1.446).B:The first two principal components from EIGENSTRAT with different colors indicating cases and controls.The first PC well distinguishes the two subpopulations.C:The Q--Q plot of the adjusted chi--squared test statistics by genomic control,the resulting inflation factor is 1.000(95%CI:0.967--1.042).D:The Q--Q plot of the adjusted chi--squared test statistics by the first principal component,the resulting inflation factor is 0.973(95%CI:0.940--1.020).
Complex diseases are determined by a group of loci in conjunction with environmental factors.Despite its success in identifying numerous loci associated with disease traits,single SNP scan is underpowered for multifactorial diseases.Thereby,it is more preferable to implement multiple markers analysis to capture the joint effects of SNPs[18,20,50].In GWAS analysis,however,one of the main challenges is to examine hundreds of thousands of SNPs simultaneously.In a typical setting,the number of SNPs far exceeds the sample size,which makes it impossible to analyze the data using traditional multiple regressions,so placing regularizations on the regression coefficients is necessary[51].
Recently,a number of penalization-based statistical techniques have been developed to deal with the high dimensional GWAS data,among which the least absolute shrinkage and selection operator(Lasso) has turned out to be a promising method[44,52-56].Let the log-likelihood function be L(β;G,Y),where Yis the phenotype vector with values of 1 or 0 in case-control study,G is the genotypes matrix,andβ is the SNPs effect vector.The Lasso estimators are defined as
where λ is a non-negative tuning parameter determining thestrengthofthepenalty.Thesecondtermintheformula above is called L1-penalty,due to which the Lasso can shrink some small values ofβto be exactly zeros;hence, parameter estimation and variable selection are achieved simultaneously.The optimal λ value is selected by crossvalidation(CV),generalized cross-validation(GCV), and Bayesian information criterion(BIC)[51-52].
The Lasso can deal with genome-wide SNPs at the same time,but performing a full Lasso regression is not practical because the computational burden is intensive.Therefore,it is more efficient to first reduce the total number of SNPs to a manageable level via a
screening procedure,and look for causal loci among these passing the prespecified threshold.This screening-modeling strategy is theoretically and empirically reasonable for the large scale analysis[22,57-59].
Multiple comparisons
Single SNP scan for GWAS analysis is computationally practical.However,it suffers from serious multiple comparison problems due to implementing a large number of hypotheses at the same time.Type I error will be inflated if no measure is taken.Assume that each SNP is tested at the traditional significance level α=0.05,then the total type I error is 1-(1-α)m,which will approach 1 quickly as the number of marker m increases.For example,if m=100,000,it is expected that about 5,000 false positive associations are observed by chance even none of SNPs is diseaserelated.Thus,multiple comparison is an important consideration in GWAS analysis,and must be handled appropriately[18].
Bonferroni correction
Bonferroni correction offers a convenient way to control the family-wise error rate(FWER)by dividing α by m provided that the markers are uncorrelated.The FWER is the probability of rejecting at least one null hypothesis when all the nulls are correct[60-61].The resulting significance level is α/m,an SNP is then considered to be statistically significant if its P-value is less than the adjusted significance level.However,it is well known that Bonferroni correction is conservative.Perhaps none of SNPs can achieve such small threshold;in this case,a few SNPs with relatively small P-values can be chosen for further investigation.
Bayes factor has recently been applied to the measurement of significance as an alternative to P-value[62-64],which avoids adjustment for multiple comparisons.
False discovery rate
False discovery rate(FDR)[65]is another commonly used error measure,which provides a less conservative way by controlling the expected proportion of false rejections of nulls among all rejections.FDR is controlled through the linear step-up procedure.For a given FDR level(e.g.,α=0.05)find the largest k value that satisfies P(k)≤αk/m,where P(k)is the order P-value from the smallest to the largest,and the SNPs with P-values≤P(k)are declared as significance.The step-up procedure is valid when the tests are independent or positively dependent,and it often leads to a lower threshold and thus improves the power[65-66].
The Bonferroni correction,false discovery rate procedures,and other adjustment methods can be performed using PLINK[24].
Independent validation
To minimize the risk of false positive associations in GWAS,statistically significant SNPs should be further validated by independent replications[20,67,68].The main objective of replications is to evaluate systemically whether or not the discovered SNPs in initial GWAS are spurious signals.The replication samples should be collected the same way as the original study. Association analysis has to be based on the same genetic model as being employed in the original study to ensure consistency and robustness of associations. The effect sizes of markers should show the same signs in both the replicated and original study.Mulitple criteria for establishing positive replication are suggested by Chanock et al.[67].
However,the failures of replication do not necessarily mean the original findings of association are false positive because there are many reasons for non-replications.For example,hidden population structures are not taken into account in both the replicated and original samples[34],the found markers have very small effects and cannot be rediscovered easily,and the replications have small sample sizes leading to low power to confirm the initial outcomes[67-68].In conclusion,it has now been agreed that any significant associations in GWAS must be validated strictly by follow-up studies or biological interpretations before being reported.
Visual presentation
Visual presentation is helpful to understand the results of GWAS,a large number of visual tools have been developed.Here,we briefly introduce a few of them.
Quantile-quantile plot
It has been realized that the statistics will be biased due to population structure.It is a routine pattern to apply the quantile-quantile(Q-Q)plot to evaluate the existence of population structure before and after correction.The Q-Q plot is constructed as a scatter plot of the observed ranked chi-squared statistics from the smallest to the largest against the theoretical values under the null hypothesis of no association.If the statistics come from null distribution,the plot should go along the diagonal linearly.The Q-Q plot can be conveniently implemented by R package using the outputs of PLINK[69].
The Q-Q plots for population structure using a simulated data with genomic control and PCA adjustments are shown inFig.2.The simulation settings are similar to those in the report of Price,et al.[39]. Fig.2shows that the population structure leads to inflation of test statistics,and both the genomic control and PCA provide effective corrections.The 95%confidence interval(CI)of inflation factor is calculated using the method of bootstrap[70],repeating 1,000 runs.
Manhattan plot
The P-values of GWAS are generally shown by Manhattan plot.This plot is produced by scattering the P-values in-log10scale in the vertical axis and the physical position of SNP along chromosomes in the horizontal axis.Different chromosomes are generally distinguished with colors.Using-log10scale is to highlight the small P-values,which suggest potential disease-related SNPs.The Manhattan plot is executed through the R package or the program Haplo View[69,71].For example,seeFig.3.
Haploview plot
Once significant susceptibility loci are found,the computation of linkage disequilibrium among their neighboring SNPs upstream and downstream and understanding the population haplotype structure are of interest.Haploview provides such analyses in a visually appealing and interactive interface(Fig.4)[71].
LocusZoom plot
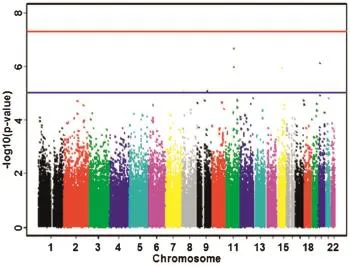
Fig.3Manhattan plot of P-values.The blue and red lines represent the corresponding P-values of 1× 10--5and 1× 10--7, respectively.
LocusZoom,a web-based plotting tool,provides visually regional information such as the strength and extent of the association signal relative to genomic position,local linkage disequilibrium and recombination patterns and the positions of genes in the region (Fig.5)[72].
Other advanced topics
Although the above methods for analyzing the GWAS data have been widely employed in practice, they have some limitations and shortcomings,for example,low power and lack of interpretability and repeatability for single marker scan.Substantial efforts have been made to overcome these difficulties.Now, we discuss some advanced topics for further analyzing the GWAS data.
Missing heritability
In spite of GWAS success for most common diseases,the discovered disease susceptibility loci explain only a remarkably small part of the overall phenotypic variation[22,73-75].Several reasons have been proposed for the missing heritability.(I)The genetic effect sizes on the phenotypes are fairly weak.It is reported that the relative risks(or odds ratios,OR)of most of the related loci are typically on a scale of 1.10-1.20 even for GWAS with very huge sample size.A large number of markers with much weaker effect sizes cannot be detected using current statistical approaches.(II) Part of the heritability is attributable to the interaction effects of gene-gene and gene-environment[76-80], whereas most of the published GWAS literature only considers the main effects.(III)Gene-based and pathway-based analyses can improve the power[81-87];these considerations result from the fact that multiple SNPs nearby are often involved in the same biological pathway and act collectively.(IV)The effectiveness of the current GWAS largely depends on the hypothesis of common disease common variant(CDCV)[18],i.e.,the common complex diseases are mainly attributable to a number of common variants(i.e.,locus with MAF>1%).However,recently,it has been recognized that the rare variants(i.e.,locus with MAF<1%)are expected to contribute to susceptibility to the common complex diseases substantially[75,88-92],i.e.,the hypothesis of common disease rare variant(CDRV)[93].
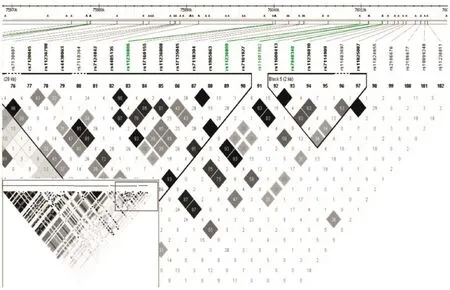
Fig.4Linkage disequilibrium structure of the selected SNPs.The grey scale indicates the strength of correlation coefficient r2between two SNPs;the black lines indicate the block structure of the human genome.The white bars at the top indicate the position of SNP,each square represents the correlation of two SNPs measured by the correlation coefficient r2between the alleles of the two SNPs,and the shades of grey indicate the strength of the correlation varying from zero correlation(white)to strong correlation (black).
All of the issues above are not trivial,and actually they can be more complicated and challenging.Discovering markerswithweakereffectsizesrequiresmuchlargersample size,which will lead to more expenses.Although the importance of epistasis has been recognized,the power of detecting epistatic effect is rather low due to relatively small sample size,andthe calculation ofinteractioneffect is much time-consuming.For example,to look for pairwise interactions from 500,000 SNPs,a total of 1.25 ×10¹¹tests need to be implemented.The issue of multipletestingalsoarisesinepistasismodel,higherorderinteractionsaremorecomplex,andhowtomodelthebiological epistasis statistically is not completely clear.For rare variants,the commonly used methods break down due to the extremely low MAF;therefore,developing powerful statistical approaches for rare variants is an urgent demand[94-105].
Meta-analysis
As mentioned before,current single marker scan of GWAS data is underpowered and limited by the weak to modest effect sizes of related common variants. Fortunately,several independent teams of investigators around the world perform similar GWAS on the same disease[11,106].This provides an opportunity to combine these datasets via the method of meta-analysis.An attractive aspect of meta-analysis is that the statistical power can be improved by increasing the sample size. However,various studies typically contain different sets of SNPs;therefore,the first step of meta-analysis for GWAS is imputing the untyped SNPs.Then,the classical meta-analysis can be employed,such as the fixed effects model and mixed effects model.The former assumes that the genetic effects are the same across the individual studies and the observed differences are duo to sample error;while the latter assumes that the genetic effects vary between studies and the differences include both sample error and substantial distinctions across various GWAS.
The mixed effects model is more conservative than the fixed effects model;thus,determining which models are employed is important.If the evidence of between-study heterogeneity is present,the mixed effects model is used,for example,the DerSimonian and Laird model;otherwise,the fixed effects model is used.The heterogeneity may be due to variable linkage disequilibrium across the studies,winner’s curse, gene-gene interaction and other possibilities[107].Many metrics have been proposed to test the heterogeneity, among those the statistic I2is widely applied,which is a measure of the proportion of total variation between studies attributable to heterogeneity beyond
the sample error[108].The value of I2ranges from 0%to 100%,and a larger I2indicates more heterogeneity.A general guideline of I2for detecting heterogeneity is that 0%to 25%represents ignorable heterogeneity, 25%to 50%represents low heterogeneity,50%to 75%represents moderate heterogeneity,and 75%to 100%represents high heterogeneity[109].
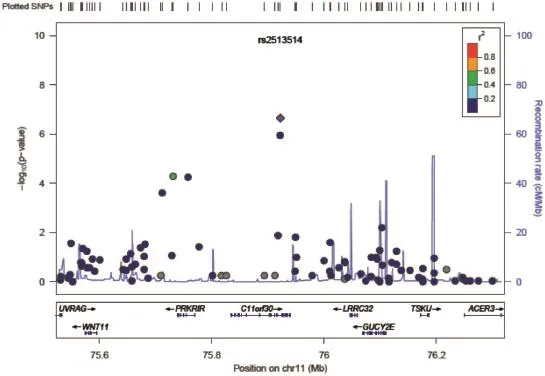
Fig.5A LocusZoom plotfor SNPs in the region flanking 400 kb on either side ofthe selected SNP rs2513514 on chromosome 11. P-values in--log10scale as in Manhattan plot are shown on the left vertical axis,the recombination rates are on the right vertical axis,and the chromosomalpositionsare onthehorizontalaxis.Thebottom panelof aLocusZoomplotshowsthe nameand locationof genes.The SNPsareshown in purple and the r2the values are represented by different colors.The genes within the region are annotated and are shown as arrows.
Set-based association analysis
To overcome the limitation of single SNP analysis,set-based association analyses have been developed,where multiple related SNPs(e.g.,within the same gene,pathway or functional group)are grouped into an SNP set and collectively examined[81-87].SNP set analysis enjoys many advantages compared to single SNP analysis,e.g.,identifying multi-marker effects,decreasing the number of multiple comparisons,allowing for epistatic effects,and making inference on biologically meaningful units[110].The reasonable logics behind the set-based testing procedures exist in two aspects:(I)the statistical power increases significantly due to enriching association signals by grouping;(II)it has been observed that multiple SNPs are often jointly related to diseases. The often used set-based tests include principal components analysis,kernel machine testing,the global test and others[110].
Copy number variant analysis
Beyond SNP,copy number variant(CNV)is another importantgeneticvariationexistinginthehumangenome. CNV is typically defined as a submicroscopic variation of DNA segments,ranging from kilobases to megabases in size,includingdeletions,insertions,duplications,andcomplex multi-site variants.CNV is related to common complex diseases and is widely believed as one of the causes of missing heritability[111,112].Several methods are developed for detecting CNV,e.g.,BAC Array Comparative Genomic Hybridization(CGH),Representational Oligonucleotide Microarray Analysis(ROMA)and Agilent CGH.It is also possible to infer CNV using the GWAS data;however,the optimal strategy for evaluating such data is not clear.Additionally,the approaches for inferring rare and de novo CNV also need to be developed[113].
Furthermore,the next-generation sequencing technologies create new challenges for analyzingCNV since there havebeennoacceptedstandardprotocolsandqualitycontrolmeasuressofar.Thechallengescancomefrommappability,GC-contentbias,qualitycontrolmeasuresofreads and difficulty in identifying duplications[114].
GWAS cohort analysis
Current GWAS is mainly cross-sectional.This may be limited in investigating the causality between
genetic variants and diseases.GWAS cohort can not only provide further insight into causality but also a solution of missing heritability.In cohort study,individuals are collected longitudinally;accordingly,temporal changes in biological properties will offer insight into disease diagnosis,progression,and recovery.However,the temporal effects between different times create great statistical challenge,especially in such high-dimensional data,and should be taken into account[115].Association analysis for GWAS cohort data is a relatively new field although some explorations have been made.Recently proposed methods for cohort GWAS data include,dependent on the type of dataset,for example,the longitudinal support vector machine and the penalized mixed effects model[115].
Discussion
The success of GWAS relies on the progresses of technologies,effective collaborations of researchers, well designs and implementations as well as subsequent analyses and interpretations.This article gives a comprehensive overview of genome-wide association analysis,the basic strategies commonly used in GWAS are introduced,and the shortcomings of these approaches are also emphasized.
Stringent quality control ensures the results of GWAS are believable,some of which will become less important in the future.For example,owing to nextgeneration sequencing,there are fewer genotyping errors and no need to removing SNPs with MAF<1%;instead,the rare variants are of important interest.
When association is analyzed,it requires paying more attention to the issues of multiple testing and population structure because false positive or false negative associations arise.For population structure, it is important either to demonstrate that it can be negligible[6,8],or to adequately adjust for by methods such as genomic control and PC analysis[21].
There are many user-and-interface friendly tools to implement the visualizations.It has become routine in GWAS analysis that one presents the Manhattan plot to show the potential disease-related loci and the Q-Q plot to show the inflations of test statistics.Other plots such as LocusZoom plot and Haploview plot offer valuable complements.
The genome-wide era creates exciting and challenging opportunities to the scientific world.Statistical approaches play very important roles in GWAS.We have noted that some other novel statistical tools are ignored,such as the Bayesian approaches and the machine learning[21-22,51,58,62,79,116-117].We hope that the present overview is helpful for GWAS researchers to obtain a clear picture of analyzing such large scale data,and that the future improvement of statistical methods will enable us to overcome these challenges and to make a better understanding of the genetic basis of the complex diseases.
Some online sources and websites
HAPGEN2 for simulating case control datasets: https://mathgen.stats.ox.ac.uk/genetics_software/hapgen/hapgen2.html.plink for whole genome association analysis:http://pngu.mgh.harvard.edu/~purcell/ plink/.IMPUTE2 for genotype imputation and haplotype phasing program:http://mathgen.stats.ox.ac.uk/ impute/impute_v2.html.NHGRI catalogue of GWAS results:http://www.genome.gov/gwastudies/. EIGENSOFT for population structure:http://genetics.med.harvard.edu/reich/Reich_Lab/Software.html. Haploview:http://www.broadinstitute.org/scientificcommunity/science/programs/medical-and-populationgenetics/haploview/haploview.LocusZoom:http:// csg.sph.umich.edu/locuszoom/.R software:http:// cran.r-project.org/.
Acknowledgments
This work was supported by National Natural Science Foundation of China(No.81072389,81373102, 81473070 and 81402765),Research Found for the Doctoral Program of Higher Education of China(No. 20113234110002),Key Grant of Natural Science Foundation of the Jiangsu Higher Education Institutions of China(No.10KJA330034),College Philosophy and Social Science Foundation from Education Department of Jiangsu Province of China(No.2013SJB790059, 2013SJD790032),Research Foundation from Xuzhou Medical College(No.2012KJ02),Research and Innovation Project for College Graduates of Jiangsu Province of China(No.CXLX13_574)and the Priority Academic Program Development of Jiangsu Higher Education Institutions(PAPD).
We are very grateful to Alkes Price for helpful suggestions on the simulation of discrete populations used inFig.2.We also appreciate anonymous reviewers for their valuable suggestions and comments which substantially improve our manuscript,and thanks also go to the Associate Editor for the support.
Reference
[1] Haiman CA,Chen GK,Vachon CM,et al.A common variant at the TERT-CLPTM1L locus is associated with estrogen receptor-negative breast cancer[J].Nat Genet, 2011,43(12):1210-1214.
[2] Jia WH,Zhang B,Matsuo K,et al.Genome-wide association analyses in east Asians identify new susceptibility loci for colorectal cancer[J].Nat Genet,2013,45(2): 191-196.
[3] Lan Q,Hsiung CA,Matsuo K,et al.Genome-wide association analysis identifies new lung cancer susceptibility loci in never-smoking women in Asia[J].Nat Genet, 2012,44(12):1330-1335.
[4] Shi Y,Hu Z,Wu C,et al.A genome-wide association study identifies new susceptibility loci for non-cardia gastric cancer at 3q13.31 and 5p13.1[J].Nat Genet,2011, 43(12):1215-1218.
[5] Easton DF,Pooley KA,Dunning AM,et al.Genome-wide association study identifies novel breast cancer susceptibility loci[J].Nature,2007,447(7148):1087-1093.
[6] Hu Z,Wu C,Shi Y,et al.A genome-wide association study identifies two new lung cancer susceptibility loci at 13q12.12 and 22q12.2 in Han Chinese[J].Nat Genet, 2011,43(8):792-796.
[7] Thomas G,Jacobs KB,Yeager M,et al.Multiple loci identified in a genome-wide association study of prostate cancer[J].Nat Genet,2008,40(3):310-315.
[8] The Wellcome Trust Case Control Consortium.Genomewide association study of 14,000 cases of seven common diseases and 3,000 shared controls[J].Nature,2007, 447(7145):661-678.
[9] Saxena R,Voight B,Lyssenko V,et al.Genome-wide association analysis identifies loci for type 2 diabetes and triglyceride levels[J].Science,2007,316(5829): 1331-1336.
[10]Sladek R,Rocheleau G,Rung J,et al.A genome-wide association study identifies novel risk loci for type 2 diabetes[J].Nature,2007,445(7130):881-885.
[11]Franke A,McGovern DPB,Barrett JC,et al.Genomewide meta-analysis increases to 71 the number of confirmed Crohn’s disease susceptibility loci[J].Nat Genet, 2010,42(12):1118-1125.
[12]Voight BF,Scott LJ,Steinthorsdottir V,et al.Twelve type 2 diabetes susceptibility loci identified through large-scale association analysis[J].Nat Genet,2010,42(7):579-589.
[13]Deloukas P,Kanoni S,Willenborg C,et al.Large-scale association analysis identifies new risk loci for coronary artery disease[J].Nat Genet,2013,45(1):25-33.
[14]Duerr RH,Taylor KD,Brant SR,et al.A Genome-Wide Association Study Identifies IL23R as an Inflammatory Bowel Disease Gene[J].Science,2006,314(5804):1461-1463.
[15]HuZ,XiaY,GuoX,etal.Agenome-wideassociationstudy inChinese menidentifiesthreerisklocifornon-obstructive azoospermia[J].Nat Genet,2012,44(2):183-186.
[16]Wen W,Cho YS,Zheng W,et al.Meta-analysis identifies common variants associated with body mass index in east Asians[J].Nat Genet,2012,44(3):307-311.
[17]Hindorff LA,MacArthur J,Morales J,et al.A Catalog of Published Genome-Wide Association Studies[EB/OL]. Available at:www.genome.gov/gwastudies,2013.
[18]Balding D.A tutorial on statistical methods for population association studies[J].Nat Rev Genet,2006,7(10):781-791.
[19]Donnelly P.Progress and challenges in genome-wide association studies in humans[J].Nature,2008, 456(7223):728-731.
[20]McCarthy MI,Abecasis GR,Cardon LR,et al.Genomewide association studies for complex traits:consensus, uncertainty and challenges[J].Nat Rev Genet,2008, 9(5):356-369.
[21]Ziegler A,Ko¨nig IR,Thompson JR.Biostatistical Aspects of Genome-Wide Association Studies[J].Biom J,2008, 50(1):8-28.
[22]Moore JH,Asselbergs FW,Williams SM.Bioinformatics challenges for genome-wide association studies[J]. Bioinformatics,2010,26(4):445-455.
[23]Clayton DG,Walker NM,Smyth DJ,et al.Population structure,differential bias and genomic control in a large-scale,case-control association study[J].Nat Genet, 2005,37(11):1243-1246.
[24]Purcell S,Neale B,Todd-Brown K,et al.PLINK:a tool set for whole-genome association and population-based linkage analyses[J].Am J Hum Genet,2007,81(3):559-575.
[25]Howie B,Fuchsberger C,Stephens M,et al.Fast and accurate genotype imputation in genome-wide association studies through pre-phasing[J].Nat Genet,2012, 44(8):955-959.
[26]Li Y,Willer C,Sanna S,et al.Genotype Imputation[J]. Annu Rev Genomics Hum Genet,2009,10(1):387-406.
[27]Marchini J,Howie B.Genotype imputation for genomewide association studies[J].Nat Rev Genet,2010, 11(7):499-511.
[28]Browning S.Missing data imputation and haplotype phase inference for genome-wide association studies[J]. Hum Genet,2008,124(5):439-450.
[29]Guan Y,Stephens M.Practical issues in imputation-based association mapping[J].PLoS Genet,2008,4(12): e1000279.
[30]Wang WY,Barratt BJ,Clayton DG,et al.Genome-wide association studies:theoretical and practical concerns[J]. Nat Rev Genet,2005,6(2):109-118.
[31]Price AL,Zaitlen NA,Reich D,et al.New approaches to population stratification in genome-wide association studies[J].Nat Rev Genet,2010,11(7):459-463.
[32]Wigginton JE,Cutler DJ,Abecasis GR.A note on exact tests of Hardy-Weinberg equilibrium[J].Am J Hum Genet,2005,76(1):887-893.
[33]Setakis E,Stirnadel H,Balding DJ.Logistic regression protects against population structure in genetic association studies[J].Genome Res,2006,16(2):290-296.
[34]Cardon LR,Palmer LJ.Population stratification and spurious allelic association[J].The Lancet,2003,361(9357): 598-604.
[35]Campbell CD,Ogburn EL,Lunetta KL,et al. Demonstrating stratification in a European American population[J].Nat Genet,2005,37(8):868-872.
[36]Vilhjalmsson BJ,Nordborg M.The nature of confounding in genome-wide association studies[J].Nat Rev Genet, 2013,14(1):1-2.
[37]Devlin B,Roeder K.Genomic control for association studies[J].Biometrics,1999,55(4):997-1004.
[38]Dadd T,Weale ME,Lewis CM.A critical evaluation of genomic control methods for genetic association studies[J].Genet Epidemiol,2009,33(4):290-298.
[39]Price AL,Patterson NJ,Plenge RM,et al.Principal components analysis corrects for stratification in genome-wide association studies[J].Nat Genet,2006,38(8):904-909.
[40]Pritchard JK,Stephens M,Donnelly P.Inference of population structure using multilocus genotype data[J]. Genetics,2000,155(2):945-959.
[41]Falush D,Stephens M,Pritchard JK.Inference of Population Structure Using Multilocus Genotype Data:Linked Loci and Correlated Allele Frequencies[J]. Genetics,2003,164(4):1567-1587.
[42]Falush D,Stephens M,Pritchard JK.Inference of population structure using multilocus genotype data:dominant markers and null alleles[J].Mol Ecol Notes,2007, 7(4):574-578.
[43]Patterson N,Price AL,Reich D.Population Structure and Eigenanalysis[J].PLoS Genet,2006,2(12):e190.
[44]Rakitsch B,Lippert C,Stegle O,et al.A Lasso multi-marker mixed model for association mapping with population structure correction[J].Bioinformatics,2013,29(2):206-214.
[45]Zhou X,Stephens M.Genome-wide efficient mixedmodel analysis for association studies[J].Nat Genet, 2012,44(7):821-824.
[46]Astle W,Balding DJ.Population Structure and Cryptic Relatedness in Genetic Association Studies[J].Stat Sci, 2009,24(4):451-471.
[47]Armitage P.Tests for linear trends in proportions and frequencies[J].Biometrics,1955,11375-386.
[48]Agresti A.Categorical Data Analysis[M],2 nd edition. New York:Wiley,2002.
[49]McCullagh P,Nelder JA.Generalized Linear Models[M], 2nd edition.London:Chapman and Hall,1989.
[50]de Bakker PIW,Yelensky R,Pe’er I,et al.Efficiency and power in genetic association studies[J].Nat Genet,2005, 37(11):1217-1223.
[51]Hastie T,Tibshirani R,Friedman J.The Elements of Statistical learning:Data Mining,Inference,and Prediction[M],2 nd edition.New York:Springer,2009. [52]Tibshirani R.Regression shrinkage and selection via the LASSO[J].J R Stat Soc B,1996,58(1):267-288.
[53]Efron B,Hastie T,Johnstone I,et al.Least angle regression[J].Ann Statist,2004,32(2):407-499.
[54]Yang C,Wan X,Yang Q,et al.Identifying main effects and epistatic interactions from large-scale SNP data via adaptive group Lasso[J].BMC Bioinformatics,2010, 11(S1):S18.
[55]Park M,Hastie T.Penalized logistic regression for detecting gene interactions[J].Biostatistics,2008,9(1):30-50.
[56]Park MY,Hastie T.L1 regularization path algorithm for generalized linear models[J].J R Stat Soc B,2007, 69(4):659-677.
[57]Fan J,Lv J.Sure independence screening for ultrahigh dimensional feature space[J].J R Stat Soc B,2008, 70(5):849-911.
[58]Li J,Das K,Fu G,et al.The Bayesian lasso for genomewide association studies[J].Bioinformatics,2011, 27(4):516-523.
[59]Wu T,Chen Y,Hastie T,et al.Genomewide Association Analysis by Lasso Penalized Logistic Regression[J]. Bioinformatics,2009,25(6):714-721.
[60]Dudoit S,Shaffer JP,Boldrick JC.Multiple Hypothesis Testing in Microarray Experiments[J].Stat Sci,2003, 18(1):71-103.
[61]Shaffer JP.Multiple hypothesis testing[J].Annu Rev Psychol,1995,46561-584.
[62]Stephens M,Balding DJ.Bayesian statistical methods for genetic association studies[J].Nat Rev Genet,2009, 10(10):681-690.
[63]Wakefield J.Bayes factors for genome-wide association studies:comparison with P-values[J].Genet Epidemiol, 2009,33(1):79-86.
[64]Sawcer S.Bayes factors in complex genetics[J].Eur J Hum Genet,2010,18(7):746-750.
[65]Benjamini Y,Hochberg Y.Controlling the false discovery rate:a practical and powerful approach to multiple teting[J].J R Stat Soc B,1995,57(1):289-300.
[66]Reiner A,Yekutieli D,Benjamini Y.Identifying differentially expressed genes using false discovery rate controlling procedures[J].Bioinformatics,2003,19(3):368-375. [67]Chanock S,Manolio T,Boehnke M,et al.Replicating genotype--phenotype associations[J].Nature,2007, 447(7145):655-660.
[68]Laird NM,Lange C.The Fundamentals of Modern Statistical Genetics.New York:Springer,2011.
[69]R Core Team.R:A language and environment for statistical computing[EB/OL].R Foundation for Statistical Computing,Vienna,Austria 2013.
[70]Efron B,Tibshirani R.An Introduction to the Bootstrap[M]. New York:Chapman and Hall,1993.
[71]Barrett JC,Fry B,Maller J,et al.Haploview:analysis and visualization of LD and haplotype maps[J]. Bioinformatics,2005,21(2):263-265.
[72]Pruim RJ,Welch RP,Sanna S,et al.LocusZoom:regional visualization of genome-wide association scan results[J]. Bioinformatics,2010,26(18):2336-2337.
[73]Maher B.Personal genomes:The case of the missing heritability[J].Nature,2008,456(6):18-21.
[74]Frazer KA,Murray SS,Schork NJ,et al.Human genetic variation and its contribution to complex traits[J].Nat Rev Genet,2009,10(4):241-251.
[75]Manolio TA,Collins FS,Cox NJ,et al.Finding the missing heritability of complex diseases[J].Nature,2009, 461(7265):747-753.
[76]Carlborg O,Haley CS.Epistasis:too often neglected in complex trait studies?[J].Nat Rev Genet,2004, 5(8):618-625.
[77]Cordell H.Detecting gene-gene interactions that underlie human diseases[J].Nat Rev Genet,2009,10(6):392-404. [78]Dong J,Hu Z,Wu C,et al.Association analyses identify multiple new lung cancer susceptibility loci and their interactions with smoking in the Chinese population[J]. Nat Genet,2012,44(8):895-899.
[79]Zhang Y,Liu J.Bayesian inference of epistatic interactions in case-control studies[J].Nat Genet,2007, 39(9):1167-1173.
[80]Aschard H,Lutz S,Maus B,et al.Challenges and opportunities in genome-wide environmental interaction (GWEI):studies[J].Hum Genet,2012,131(10):1591-1613.
[81]Zhao J,Gupta S,Seielstad M,et al.Pathway-based analysis using reduced gene subsets in genome-wide association studies[J].BMC Bioinformatics,2011,12(1):17.
[82]Zhong H,Yang X,Kaplan LM.Integrating pathway analysis and genetics of gene expression for genome-wide association studies[J].Am J Hum Genet,2010,86(4): 581-591.
[83]Wang K,Li M,Hakonarson H.Analysing biological pathways in genome-wide association studies[J].Nat Rev Genet,2010,11(12):843-854.
[84]Nair R,Duffin K,Helms C,et al.Genome-wide scan reveals association of psoriasis with IL-23 and NF-κB pathways[J].Nat Genet,2009,41(2):199-204.
[85]Ertel A,Tozeren A.Switch-like genes populate cell communication pathways and are enriched for extracellular proteins[J].BMC Genomics,2008,9:3.
[86]Wang K,Li M,Bucan M.Pathway-Based Approaches for Analysis of Genomewide Association Studies[J].Am J Hum Genet,2007,81(6):1278-1283.
[87]Zhao Y,Chen F,Zhai R,et al.Association Test Based on SNP Set:Logistic Kernel Machine Based Test vs. Principal Component Analysis[J].PLoS ONE,2012, 7(9):e44978.
[88]Pritchard JK.Are rare variants responsible for susceptibility to common diseases?[J].Am J Hum Genet,2001, 69(1):124-137.
[89]Asimit J,Zeggini E.Rare variant association analysis methods for complex traits[J].Annu Rev Genet,2010, 44:293-308.
[90]Bodmer W,Bonilla C.Common and rare variants in multifactorial susceptibility to common diseases[J].Nat Genet,2008,40(6):695-701.
[91]Bansal V,Libiger O,Torkamani A,et al.Statistical analysis strategies for association studies involving rare variants[J].Nat Rev Genet,2010,11(11):773-785.
[92]Nejentsev S,Walker N,Riches D,et al.Rare variants of IFIH1,a gene implicated in antiviral responses,protect against type 1 diabetes[J].Science,2009,324387-389.
[93]Pritchard JK.Are rare variants responsible for susceptibility to complex diseases?[J].Am J Hum Genet,2001, 69(1):124-137.
[94]Pashova H,LeBlanc M,Kooperberg C.Boosting for detection of gene-environment interactions[J].Stat Med, 2013,32(2):255-266.
[95]Rajapakse I,Perlman MD,Martin PJ,et al.Multivariate Detection of Gene-Gene Interactions[J].Genet Epidemiol,2012,36(6):622-630.
[96]Hsu L,Jiao S,Dai JY,et al.Powerful Cocktail Methods for Detecting Genome-Wide Gene-Environment Interaction[J].Genet Epidemiol,2012,36(3):183-194.
[97]YungLS,YangC,WanX,etal.GBOOST:aGPU-basedtool for detecting gene--gene interactions in genome--wide case control studies[J].Bioinformatics,2011,27(9):1309-1310.
[98]Wu J,Devlin B,Ringquist S,et al.Screen and clean:a tool for identifying interactions in genome-wide association studies[J].Genet Epidemiol,2010,34(3):275-285.
[99]Wan X,Yang C,Yang Q,et al.BOOST:A Fast Approach to Detecting Gene-Gene Interactions in Genome-wide Case-Control Studies[J].Am J Hum Genet,2010, 87(3):325-340.
[100]Yang C,He Z,Wan X,et al.SNPHarvester:a filteringbased approach for detecting epistatic interactions in genome-wide association studies[J].Bioinformatics,2009, 25(4):504-511.
[101]Herold C,Steffens M,Brockschmidt FF.INTERSNP: genome-wide interaction analysis guided by a priori information[J].Bioinformatics,2009,25(24):3275-3281.
[102]Ritchie M,Hahn L,Roodi N,et al.Multifactor-dimensionality reduction reveals high-order interactions among estrogen-metabolism genes in sporadic breast cancer[J]. Am J Hum Genet,2001,69(1):138-147.
[103]Wu MC,Lee S,Cai T,et al.Rare-Variant Association Testing for Sequencing Data with the Sequence Kernel Association Test[J].Am J Hum Genet,2011,89(1):82-93. [104]Han F,Pan W.A data-adaptive sum test for disease association with multiple common or rare variants[J].Hum Hered,2010,70(1):42-54.
[105]Zhang L,Pei YF,Hai R,et al.Testing Rare Variants for Association with Diseases:A Bayesian Marker Selection Approach[J].Ann Hum Genet,2012,76(1):74-85.
[106]Wen W,Cho Y-S,Zheng W,et al.Meta-analysis identifies common variants associated with body mass index in east Asians[J].Nat Genet,2012,44(3):307-311.
[107]IoannidisJP,PatsopoulosNA,EvangelouE.Heterogeneity in meta-analyses of genome-wide association investigations[J].PLoS ONE,2007,2(9):e841.
[108]Higgins J,Thompson SG.Quantifying heterogeneity in a meta-analysis[J].Stat Med,2002,21(11):1539-1558.
[109]Higgins JP,Thompson SG,Deeks JJ,et al.Measuring inconsistency in meta-analyses[J].BMJ,2003, 327(7414):557.
[110]Wu MC,Maity A,Lee S,et al.Kernel Machine SNP-Set Testing Under Multiple Candidate Kernels[J].Genet Epidemiol,2013,37(3):267-275.
[111]McCarroll SA.Extending genome-wide association studies to copy-number variation[J].Hum Mol Genet,2008, 17(R2):R135-R142.
[112]Wong KK,deLeeuw RJ,Dosanjh NS,et al.A comprehensive analysis of common copy-number variations in the human genome[J].Am J Hum Genet,2007,80(1):91-104.
[113]Zo¨llner S,Teslovich TM.Using GWAS data to identify copy number variants contributing to common complex diseases[J].Stat Sci,2009,24(4):530-546.
[114]Teo SM,Pawitan Y,Ku CS,et al.Statistical challenges associated with detecting copy number variations with next-generation sequencing[J].Bioinformatics,2012, 28(21):2711-2718.
[115]Chen S,Grant E,Wu TT,et al.Some recent statistical learning methods for longitudinal high-dimensional data[J].WIREs Comp Stats,2014,6(1):10-18.
[116]Szymczak S,Biernacka JM,Cordell HJ,et al.Machine learning in genome-wide association studies[J].Genet Epidemiol,2009,33(S1):S51-S57.
[117]Yi N,Zhi D.Bayesian analysis of rare variants in genetic association studies[J].Genet Epidemiol,2011, 35(1):57-69.
✉Corresponding author:Feng Chen,Ph.D,Department of Epidemiology and Biostatistics,School of Public Health,Nanjing Medical University,818 East Tianyuan Road,Nanjing,Jiangsu 211166, China.Tel/fax:+86-25-86862754/+86-25-86527613;E-mail:fengchen@ njmu.edu.cn.
Received 15 January 2014,Revised 7 June 2014,Accepted 27 September 2014,Epub 30 November 2014
R181.2,Document code:A
The authors reported no conflict of interests.
 THE JOURNAL OF BIOMEDICAL RESEARCH2015年4期
- THE JOURNAL OF BIOMEDICAL RESEARCH的其它文章
- Translating transitions-how to decipher peripheral human B cell development
- Comparison of dimension reduction-based logistic regression models for case-control genome-wide association study:principal components analysisvs.partial least squares
- Co-firing of levator palpebrae and masseter muscles links the masticatory and oculomotor system in humans
- Impact of crosslinking/riboflavin-UVA-photodynamic inactivation on viability,apoptosis and activation of human keratocytesin vitro
- Delorme's operation plus sphincteroplasty for complete rectal prolapse associated with traumatic fecal incontinence
- Distraction osteogenesis for correction of post ankylosis mandibular deformities