Assessment of Stroke Volume Variation Perioperatively by Using Arterial Pressure with Cardiac Output
Wen-jing Li, Yi-ping Hu*, and Min-min Zhu
Department of Anesthesia, Wuxi No. 2 People's Hospital, Nanjing Medical University, Wuxi, Jiangsu 214000, China
ORIGINAL ARTICLE
Assessment of Stroke Volume Variation Perioperatively by Using Arterial Pressure with Cardiac Output
Wen-jing Li, Yi-ping Hu*, and Min-min Zhu
Department of Anesthesia, Wuxi No. 2 People's Hospital, Nanjing Medical University, Wuxi, Jiangsu 214000, China
hemodynamics; stroke volume variation; arterial pressure with cardiac output
Objective To observe the sensitivity of stroke volume variation (SVV) for assessing volume change during induction period of general anesthesia.
Methods Patients who underwent orthopaedic surgery under general anesthesia and mechanical ventilation were divided into two groups randomly. Patients in the group Iwere subjected to progressive central hypovolemia and correction of hypovolemia sequentially; patients in the Group Ⅱ were exposed to hypervolemia alone. Each step was implemented after 5 minutes when the hemodynamics was stable. SVV and cardiac index (CI) were recorded, and Pearson’s product-moment correlation was used to analyze correlation between SVV and CI.
Results Forty patients were included in this study, 20 cases in each group. For group I patients, SVV was increased significantly along with blood volume reduction, and changes in CI were negatively correlated with changes in SVV (r=-0.605, p<0.01); SVV decreased significantly along with correction of blood volume; changes in CI were negatively correlated with changes in SVV (r=-0.651, p<0.01). For groupⅡ patients, along with blood volume increase, SVV did not change significantly; changes in CI revealed no significant correlation with changes in SVV (r=0.067, p>0.05).
Conclusion SVV is a useful indicator for hypovolemia, but not for hypervolemia.
Chin Med Sci J 2015; 30(2):95-99
CLOSE monitoring of volume status of patients undergoing major surgery is essential to finding of hemodynamic instability and initiation of fluid resuscitation as early as possible. However, traditional dynamic parameters usually cannot predict hemodynamic response to blood loss and volume expansion very well. When the volume of blood loss reached 20%-30% of total blood volume, blood pressure was decreased significantly, but organ perfusion was not reduced significantly.1Central venous pressure (CVP) has been used to estimate the cardiac preload, but multifactors have influence on the monitoring result of CVP, for example blood pressure, thoracotomy, and mechanical ventilation, etc.2-4Therefore, it is in question whether we can use CVP to guide liquid theapy.5,6Stroke volume variation (SVV) which is measured by arterial pressure-based cardiac output (APCO) has been an important hemodynamic parameter to predict fluid responsiveness.7-9Our study observes the sensitivity of stroke volume variation (SVV) for assessing volume change during induction period of general anesthesia.
PATIENTS AND METHODS
Patients
From January to March 2014, the consecutive patients who underwent orthopaedic surgery at the Wuxi No. 2 People's Hospital were enrolled. Inclusion criteria were as follows: patients whose age was less than 70 years, and more than 18 years, and weight < 90 kg and >45 kg; with American Society of Anesthesiologists (ASA) classI to Ⅱ, whose hematocrit >0.35, haemoglobin >120 g/L, and with normal electrocardiogram. Patients who diagnosed with arrhythmias, valvular heart disease or a history of lung disease were excluded. This study was approved by the Ethics Committee of Wuxi No.2 People's Hospital and all cases gave written informed consents.
Anaesthesia method
All the orthopaedic surgeries were performed in the supine position with general anesthesia. Heat rate (HR), blood pressure, electrocardiogram, and pulse oximetry were monitored continuously. A central venous catheter was inserted through the right internal jugular vein. Anaesthesia was induced with dexamethasone 5 mg, midazolam 0.05 mg/kg, fentanil 0.05 mg/kg, propofol 1.5 mg/kg, and cisatracurium 1.5 mg/kg.
After tracheal intubation, the controlled mechanical ventilation (Ohmeda Aespire Anesthesia Machine, GE, WI, USA) was maintained throughout the procedure with a tidal volume of 12 ml/kg of estimated lean body weight and an inspiratory∶expiratory ratio of 1∶2, without positive end expiratory pressure (PEEP). The ventilatory frequency was 12 breaths per minute.
No changes to the ventilator settings were made during the study period. Anaesthesia was maintained with inhalation of 1.5%-3.0% sevoflurane.
Study protocol
The patients were divided into two groups randomly. Before operation, all patients in the Group Iwere subjected to progressive central hypovolemia and correction of hypovolemia sequentially; patients in the Group Ⅱ were exposed to hypervolemia alone.
Two series of blood withdrawal (5% of the calculated blood volume) from the central venous catheter of patients in the Group Iwas performed at the rate of 30-50 ml/min to induce hypovolemia (T1and T2steps respectively). Then each patient was infused with 6% hydroxyethyl starch (HES) 130/0.4 at the rate of 50-70 ml/min to correct hypovolemia with two steps (T3and T4steps with 5% of the calculated blood volume respectively). Whole-blood volume (ml) was calculated as follows: weight×n (male: 70, female: 65).
The patients of the Group Ⅱ underwent mechanical ventilation (t0step). Then HES 130/0.4 (6%) was infused at the rate of 50-70 ml/min via the central venous catheter for two steps. Infusion volume of each step was 5% of the calculated blood volume.
The each step was implemented after 5 minutes when the hemodynamics was stable. During data recording, ventilatory settings were kept constant. Inotropes or vasopressors were not administrated. Additionally, stimulation for patients should be avoided.
Haemodynamic monitoring
After induction of anaesthesia, a 22 G artery catheter was inserted in the left radial artery. Artery pressure was measured by using the FloTrac transducer (Edwards Lifesciences, CA, USA) coupled to both MP20 Philips and Vigileo monitors (software version: V03.06, Edwards Lifesciences). Pressure transducers were zeroed at the mid-axillary level to atmospheric pressure.
At each step of the study protocol, HR, mean arterial pressure, CVP, stroke volume variation (SVV), systemic vascular resistance, cardiac output (CO), and cardiac index (CI) were recorded.
Statistical analysis
Statistical analyses were performed by using a commercially available statistical software SPSS 17.0. All normally distributed continuous data were expressed as mean±standard deviation (SD). Pearson’s productmoment correlation was used to analyze correlation between two parameters. P<0.05 was considered as significant.
RESULTS
General characteristics
Finally, 40 consecutive patients were enrolled with 20 cases in the each group. The group I included 8 males and 12 females with 12 ASA class Icases and 8 ASA class Ⅱcases, and the average age was 52±11 years. Their BMI was 23.8±2.4 kg/m2. The group Ⅱ consisted of 13 males and 7 females, of whom 14 were ASA class I and 6 ASA class Ⅱ. Their average age was 50±14 years, and BMI was 23.4±3.0 kg/m2. And 8 cases in the group I were with hypertension; 5 in the group Ⅱ with hypertension and 1 with glycuresis.
Correlation of CVP and CI
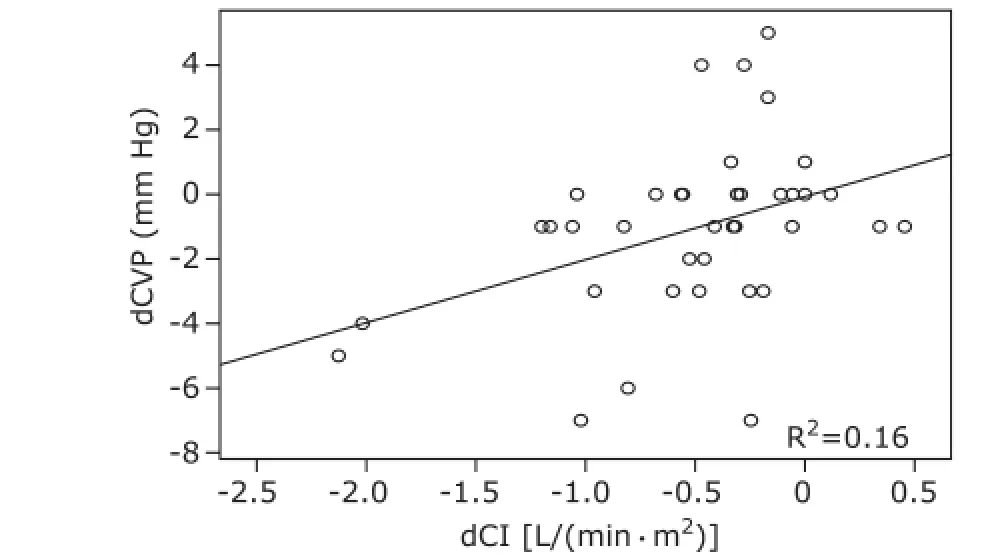
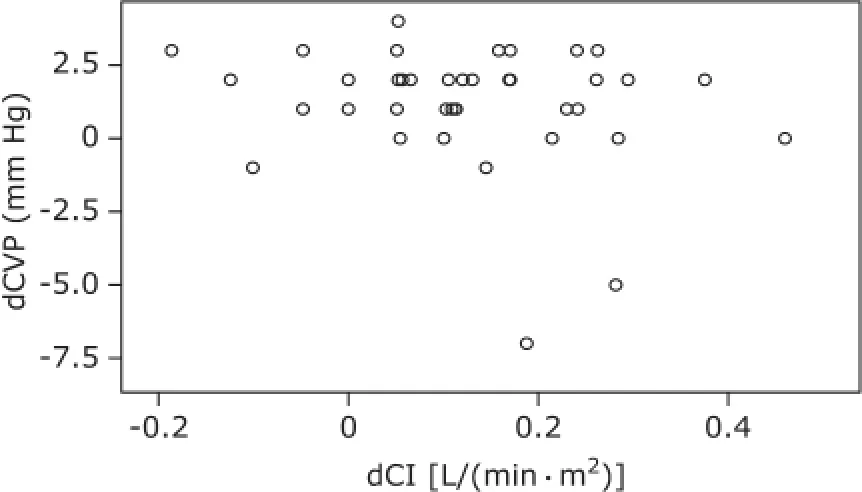
Hemodynamic changes during the experiment are presented in Table 1. For group I patients, CVP did not change significantly along with the blood volume decrease, and changes in CI had no significant correlation with changes in CVP (r=0.400, P<0.05, Fig. 1); CVP was significantly increased as the blood volume was corrected (P<0.05), and statistical analysis showed changes in CI had no significant correlation with changes in CVP (r=-0.207, P>0.05, Fig. 2). For group Ⅱ patients, along with blood volume increase, CVP did not augment significantly; changes in CI revealed no significant correlation with changes in CVP (r=0.200, P>0.05, Fig. 3).
Correlation of SVV and CI
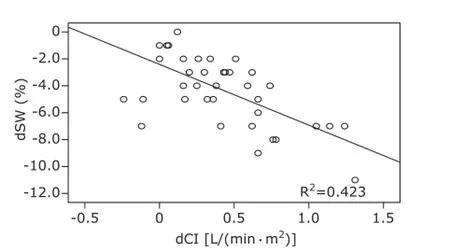
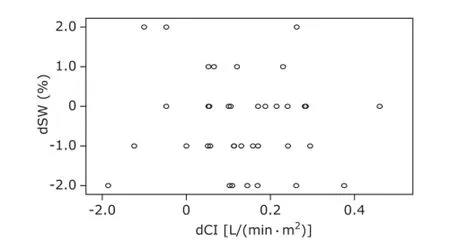
For group I patients, SVV was increased significantly along with blood volume reduction, and changes in CI were negatively correlated with changes in SVV (r=-0.605, P<0.01, Fig. 4); SVV decreased significantly along with correction of blood volume; changes in CI were negatively correlated with changes in SVV (r=-0.651, P<0.01, Fig. 5). For group Ⅱ patients, along with blood volume increase, SVV did not change significantly; changes in CI revealed no significant correlation with changes in SVV (r=0.067, P>0.05, Fig. 6).

Table 1. Hemodynamic variables of the two groups§(n=20)

Figure 1. Correlation between dCVP and dCI during hypovolemia.dCVP: difference of CVP between T1and T0as well as between T2and T0; dCI: difference of CI between T1and T0as well as T2and T0.

Figure 2. Correlation between dCVP and dCI during correction of hypovolemia.dCVP: difference of CVP between T3and T2as well as between T4and T2; dCI: difference of CI between T3and T2as well as between T4and T2.

Figure 3. Correlation between dCVP and dCI during hypervolemia. dCVP: difference of CVP between t1and t0as well as between t2and t0; dCI: difference of CI between t1and t0as well as between t2and t0.

Figure 4. Correlation between dSVV and dCI during hypovolemia.dSVV: difference of SVV between T1and T0as well as between T2and T0; dCI: difference of CI between T1and T0as well as between T2and T0.
DISCUSSION
This study demonstrated that SVV might be sensitive for detecting hypovolemia during mechanical ventilation, but they could not correctly reflect blood volume status during hypervolemia. However, CVP did not change significantly all the time during hypovolemia or hypervolemia.
The drawbacks of CVP monitoring were as follows: relatively large individual variances and invasiveness associated with catheter placement. CVP at a single point is considered as a poor indicator for the intravascular blood volume state or for predicting the responsiveness to intravascular fluid administration.10However, CVP could change in parallel with the intravascular blood volume status during different time in this study.
SVV is referred to as dynamic variables because it reflects respiration-induced cyclic changes in preload, whereas CVP is called as static variable.10This study confirmed a close relation between difference of SVV and difference of CI between two time points. It is thus considered that SVV is useful as an indicator of hypovolemia in mechanically-ventilated patients.

Figure 5. Correlation between dSVV and dCI during correction of hypovolemia.dSVV: difference of SVV between T3and T2as well as between T4and T2; dCI: difference of CI between T3and T2as well as between T4and T2.

Figure 6. Correlation between dSVV and dCI during hypervolemia.dSVV: difference of SVV between t1and t0as well as between t2and t0; dCI: difference of CI between t1and t0as well as between t2and t0.
However, our study still has some limitations. Firstly, CO obtained by the VigileoTM/FloTracTM system. The accuracy of the VigileoTM device to assess CO has been tested in numerous settings with various results.11-14Then, it has been shown that the device is able to track the changes in SV and CO induced by ventilation volume, PEEP, and mechanical ventilation.15-17It has been demonstrated that evaluating fluid responsiveness used the Vigileo TM/FloTrac TM system as the reference to define response to ventilation volume.18,19Secondly, we excluded the subjects with spontaneous breathing activity or cardiac arrhythmias because respiratory variations in hemodynamic signals are ineffective.20Thirdly, the study was performed in subjects sedated and mechanically ventilated with a tidal volume of 12 ml/kg, and SVV might be affected by tidal volume under mechanical ventilation.21Finally, our small sample numbers might limit the interpretation of the results.
In summary, through monitoring cardiac preload variables simultaneously in mechanically-ventilated patients before operation of graded hypovolemia and hypervolemia, we found that SVV might be a useful indicator of hypovolemia, and could be used to guide preload optimization, because it allows estimation of preload and prediction of CI changes in response to fluid loading.
REFERENCES
1. Arieff AI. Fatal postoperative pulmonary edema: Pathogenesis and literature review. Chest 1999; 115:1371-7.
2. Yoshihisa Fujita MD, Tokunori Yamamoto, MD, et al. A comparison of changes in cardiac preload variables during graded hypovolemia and hypervolemia in mechanically ventilated dogs. Anesth Analg 2004; 99: 1780-6.
3. Morgan BC, Martin WE, Hornbein TF, et al. Hemodynamic effects of intermittent positive pressure respiration. Anesthesiology 1966; 27:584-90.
4. Taylor RR, Covell JW, Sonnenblick EH, et al. Dependence of ventricular distensibility on filling of the opposite ventricle. Am J Physiol 1967; 213:711-8.
5. Swarm DG. The utility of pulmonary artery catheterization. Br J Anaesth 2000; 85:501-3.
6. Brower R, Wise RA, Hassapoyannes C. Effect of lung inflayion on lung blood volume and pulmonary venous flow. J Appl Physiol 1995; 58:954-63.
7. Monnet W, Teboul JL. Volume responsiveness. Crit Care 2007; 13:549-53.
8. Pinsky MR, Payen D. Functional hemodynamic monitoring. Crit Care 2005; 9:566-72.
9. Cavallaw F, Sandreni C, Antonelli M. Functional hemodynamie monitoring and dynamic indices of fluid responsiveness. Minerva Anestesial 2008; 74:123-35.
10. Michard F, Teboul JL. Predicting fluid responsiveness in ICU patients: A critical analysis of the evidence. Chest 2002; 121:2000-8.
11. Biais M, Nouette-Gaulain K, Cottenceau V, et al. Cardiac output measurement in patients undergoing liver transplantation: Pulmonary artery catheter versus uncalibrated arterial pressure waveform analysis. Anesth Analg 2008; 106:1480-6.
12. de Waal EE, Kalkman CJ, Rex S, et al. Validation of a new arterial pulse contour-based cardiac output device. Crit Care Med 2007; 35:1904-9.
13. Mayer J, Boldt J, Wolf MW, et al. Cardiac output derived from arterial pressure waveform analysis in patients undergoing cardiac surgery: Validity of a second generation device. Anesth Analg 2008; 106:867-72.
14. Sakka SG, Kozieras J, Thuemer O, et al. Measurement of cardiac output: A comparison between transpulmonary thermodilution and uncalibrated pulse contour analysis. Br J Anaesth 2007; 99:337-42.
15. Biais M, Nouette-Gaulain K, Cottenceau V, et al. Uncalibrated pulse contour-derived stroke volume variation predicts fluid responsiveness in mechanically ventilated patients undergoing liver transplantation. Br J Anaesth 2008; 101:761-8.
16. Biais M, Nouette-Gaulain K, Quinart A, et al. Uncalibrated stroke volume variations are able to predict the hemodynamic effects of positive end-expiratory pressure in patients with acute lung injury or acute respiratory distress syndrome after liver transplantation. Anesthesiology 2009; 111:856-62.
17. Biais M, Nouette-Gaulain K, Roullet S, et al. A comparison of stroke volume variation measured by Vigileo/FloTrac system and aortic Doppler echocardiography. Anesth Analg 2009; 109:466-9.
18. Monge Garcia MI, Gil Cano A, Diaz Monrove JC. Arterial pressure changes during the Valsalva maneuver to predict fluid responsiveness in spontaneously breathing patients. Intensive Care Med 2009; 35:77-84.
19. Monge Garcia MI, Gil Cano A, Díaz Monrové JC. Brachial artery peak velocity variation to predict fluid responsiveness in mechanically ventilated patients. Crit Care 2009; 13:R142.
20. Michard F. Changes in arterial pressure during mechanical ventilation. Anesthesiology 2005; 103:419-28.
21. Reuter DA, Kirchner A, Feltinger TW, et al. Usefulness of left ventricular stroke volume. Br J Anaesth 2005; 94:318-23.
for publication September 25, 2014.
Tel: 86-510-82727501, E-mail: yipinghu554@ yahoo.com.cn
 Chinese Medical Sciences Journal2015年2期
- Chinese Medical Sciences Journal的其它文章
- Relationship between Ulcerative Colitis and Lung Injuries△
- Evaluation of Tubal Patency with Transvaginal Threedimensional Hysterosalpingo-contrast Sonography△
- Perinipple Broken Line Incision: a Novel Approach for Breast Augmentation
- Impact of Laparoscopic Versus Open Hepatectomy on Perioperative Clinical Outcomes of Patients with Primary Hepatic Carcinoma
- Effect of Neoadjuvant Chemotherapy Treatment on Prognosis of Patients with Advanced Gastric Cancer: a Retrospective Study△
- Clinical Characteristics and Outcome of Gleason Score 10 Prostate Cancer on Core Biopsy Treated by External Radiotherapy and Hormone Therapy
