Numerical Studies on Stratified Rock Failure Based on Digital Image Processing Technique at Mesoscale
Ang Li,Guo-jian Shao,2,Pei-rong Du,Sheng-yong Ding and Jing-bo Su
Numerical Studies on Stratified Rock Failure Based on Digital Image Processing Technique at Mesoscale
Ang Li1,Guo-jian Shao1,2,Pei-rong Du3,Sheng-yong Ding1and Jing-bo Su4
This paper investigates the failure behaviors of stratified rocks under uniaxial compression using a digital image processing(DIP)based finite difference method(FDM).The two-dimensional(2D)mesostructure of stratified rocks,represented as the internal spatial distribution of two main rock materials(marble and greenschist),is first identified with the DIP technique.And then the binaryzation image information is used to generate the finite difference grid.Finally,the failure behaviors of stratified rock samples are simulated by FDM considering the inhomogeneity of rock materials.In the DIP,an image segmentation algorithm based on seeded region growing(SRG)is proposed,instead of the traditional threshold value method.And with the new proposed image segmentation algorithm,the mesostructure of stratified rocks can be fully acquired.In the process of simulation,to sufficiently capture the inhomogeneity of stratified rocks,mechanical properties of each rock material are all characterized by the Weibull statistical manner.Several cases of stratified rocks with different homogeneity indices of rock materials have been discussed under two compression loading conditions considering the anisotropy of stratified rocks to some extent.Results from numerical simulations show that the inhomogeneity of stratified rocks arising from the presence of different rock materials has a great influence on the failure behaviors of stratified rocks and that the numerical failure behaviors of stratified rocks without confining stresses applied agree quite well with the general observations reported in the literature.
Stratified rocks,Failure process,inhomogeneity,mesostructure,SRG,weibull random manner,DIP-FDM.
1 Introduction
As a special jointed rock,containing one preferred orientation of discontinuity,the stratified rock is often met in underground engineering.It is necessary to fully take into account the failure behaviors of stratified rocks for evaluating the stability of underground constructions.Many scholars have devoted visible efforts to the study of failure behaviors of joint rocks[Bobet and Einstein(1998);Jiao et al.(2011);Jiao et al.(2014);Li et al.(2012b);Singh et al.(2002);Zhang et al.(2008)].To stratified rocks,considering the existence of preferred fabric orientation and the composition of different rock materials,they exhibit strong inherent anisotropy and inhomogeneity.Over the past decades,the research on stratified rocks has mainly focused on the macroscopic anisotropy[Attewell and Sandford(1974);Cazacu et al.(1998);Duveau and Shao(1998);Jaeger(1960);Li et al.(2012a);Niandou et al.(1997);Salamon(1968);Tien and Kuo(2001);Tien et al.(2006)]In fact,the macroscopic anisotropy of stratified rocks is strongly related to the inhomogeneity at mesoscale[Brady and Brown(2004)].And the failure modes of stratified rocks are dependent on the internal mesostructure.Consequently,it is significant to consider the inhomogeneity in the study of failure behaviors of stratified rocks.And the key problem is how to accurately obtain the mesostructure and inhomogeneity.Attempts have been made by many researchers to examine the influence of inhomogeneity on mechanical properties of materials.For example,Fang et al.,Leite et al.,Ma et al.,Tang et al.,Wang et al.,Zhu et al.[Fang and Harrison(2002);Leite et al.(2007);Ma et al.(2011);Tang et al.(2000);Wang et al.(1999);Zhu et al.(2004)]investigated the failure behaviors of rock-like materials on the basis of mesostrcture modeling generated by random methods.Dong and Atluri studied on inhomogeneous materials from micromechanical aspect[Dong and Atluri(2012a),(2011);Dong and Atluri(2012b),(2013)].With the development of digital image hardware and software,The DIP technique provides an innovative approach to acquire the real mesostructure of inhomogeneous materials.The so-called DIP technique is the term applying various mathematical algorithms by means of computers to extract significant information from digital images.This information may be characteristics of cracks on a material surface,the mesostructure of inhomogeneous soils,rocks,or other man-made geo-materials and so on.Several authors studied the feasibility of acquiring real mesostructures of rock-like materials by DIP technique[Kwan et al.(1999);Ammouche et al.(2000);Lawler et al.(2001);Mora et al.(1998);Obaidat et al.(1998);Yue and Morin(1996)].
Presently,the research is mainly focused on the application of DIP technique combined with certain numerical method to investigate the mechanical property of inhomogeneous materials.Yue et al.[Yue et al.(2003)]developed a DIP based finite element method by fully considering mesostructure of geo-materials.And the new method is applied to the mechanical analysis of Brazilian indirect tensile test in rock mechanics and pavement engineering.Chen et al.[Chen et al.(2007)]extrapolated 3-D cuboid mesostructure from the 2-D image mesostructure and utilized finite difference approach to analyze the failure process of rock samples by taking into account the actual 3-D mesostructure modeling.Zelelew et al.[Zelelew and Papagiannakis(2010)]employed Volumetric-based Global Minima thresholding algorithm to capture mesostructures from X-Ray CT images and proposed a methodology for simulating the viscoelastic properties of asphalt concretes by the discrete element method.Du et al.[Du et al.(2012)]reconstructed the internal structures of concrete composites using the DIP technique followed by post-processing through MATLAB and adopted finite element method to analyze the cracks location compared with experimental results.Chen et al.[Chen et al.(2013)]used a finite difference code to simulate the mechanical responses and failure patterns of the concrete,based on the generated actual 3-phase mesostructure modeling obtained by DIP techniques.
It is worth noting that,in the DIP method,the threshold segmentation algorithm is usually utilized to extract image mesostructure by assuming that all pixels whose value(gray level,color value,or others)lie within a certain range belong to one class.This hypothesis neglects all of the spatial information of the image and does not deal well with noise or blurring at boundaries.Furthermore,in order to sufficiently capture the inhomogeneity of rock-like materials,it is not appropriate to consider the mechanical parameters of component materials as constants in most literature.
In this paper,the DIP based FDM is proposed to analyze the failure behaviors of stratified rocks.In the method,the 2D mesostructure inhomogeneity of stratified rocks are identified firstly using the DIP technique,the finite difference grids are then generated according to the transforming information of binary images,and finally the failure behaviors of stratified rock samples from Chinese Jinping underground carves under uniaxial compression is simulated with the FDM based on the mesostructure modeling.In order to fully consider the influence of inhomogeneity of stratified rocks,an image segmentation algorithm based on SRG is developed to detect different rock materials and the Weibull statistical approach is employed to distribute mechanical parameters of rock materials.
2 Mesostructure identification using the DIP technique
In the ensuing,fundamental aspects of digital images are briefly introduced first.Then,the pre-treatments and segmentation algorithm based on SRG are further developed to measure and identify different rock materials in stratified rocks.
2.1 Digital images and discrete functions
Generally,the digital image consists of a rectangular array of image elements named as pixels.Each pixel is the intersection area of any horizontal scanning line with the vertical scanning line.All of these lines have an equal width h.At each pixel,the gray level is assigned with an integer value to reflect the image brightness.As a result,the digital image can be expressed as a discrete function in the i and j Cartesian coordinate system below,

where i changes from 1 to n and j changes from 1 to m.
In the laboratory,digital images of rock sample cross-sections are usually acquired by a digital camera or an X-ray CT system.Fig.1 shows the mostly used 256 gray images of a typical stratified rock cross-section from Jinping underground carves.Its gray levels have the integer interval from 0 to 255.And the center of the i and j coordinate system is located at the top left corner of the image.For the original image in Fig.1(a),the numbers of the scanning lines along the i-axis and the j-axis are 100 and 100,respectively.The actual size of the sample is 50mm×50mm.So,the scanning line is 0.5mm wide and the pixel size is 0.5mm×0.5mm.
2.2 Pre-treatments of digital images
The effect of external environment(e.g.,asymmetric illumination,electrical and mechanical noise)has a great influence on converting actual sample into digital images.The original image quality is usually not good enough to acquire a well-defined material mesostructure.Therefore,image pre-treatments such as image contrast enhancement and image noise elimination methods are applied to obtain more reasonable mesostructure of inhomogeneous materials.
Owing to the contrast improvement among different rock materials,the image contrast enhancement can help to acquire material mesostructure.The commonly used image enhancement method is known as the histogram equalization transformation.The histogram is employed to display the distribution of gray values in the image.It is a discrete function showing the number of pixels for each gray level.The histogram equalization adopts some transformations shown in Ref.[Gonzalez and Woods(2002)]to get a new histogram which ensures all displayed gray levels are approximately equally represented.Although the histogram will not be uniform as before after histogram equalization,the result of the gray level equalization process can provide an image with increased dynamic range,which tends to have higher contrast.
For the noise elimination,due to the variety of image noise,elimination methods are also in many ways.The commonly used noise elimination methods include neighborhood averaging method,lower pass filtering method,multiple images and averaging method[Gonzalez and Woods(2002)].But all these methods may blur the edges and other sharp details when removing noises to some extent.In order to protect the sharp details and reduce noise influence,the median filter is adopted in this study.As an applicable method,the median filter is a non-linear function that are carried out on pixels of a neighborhood,and whose result constitutes the response of the operation at the center pixel of the neighborhood.If the pixel neighborhood is set to A,then the output of median filtering is as follows
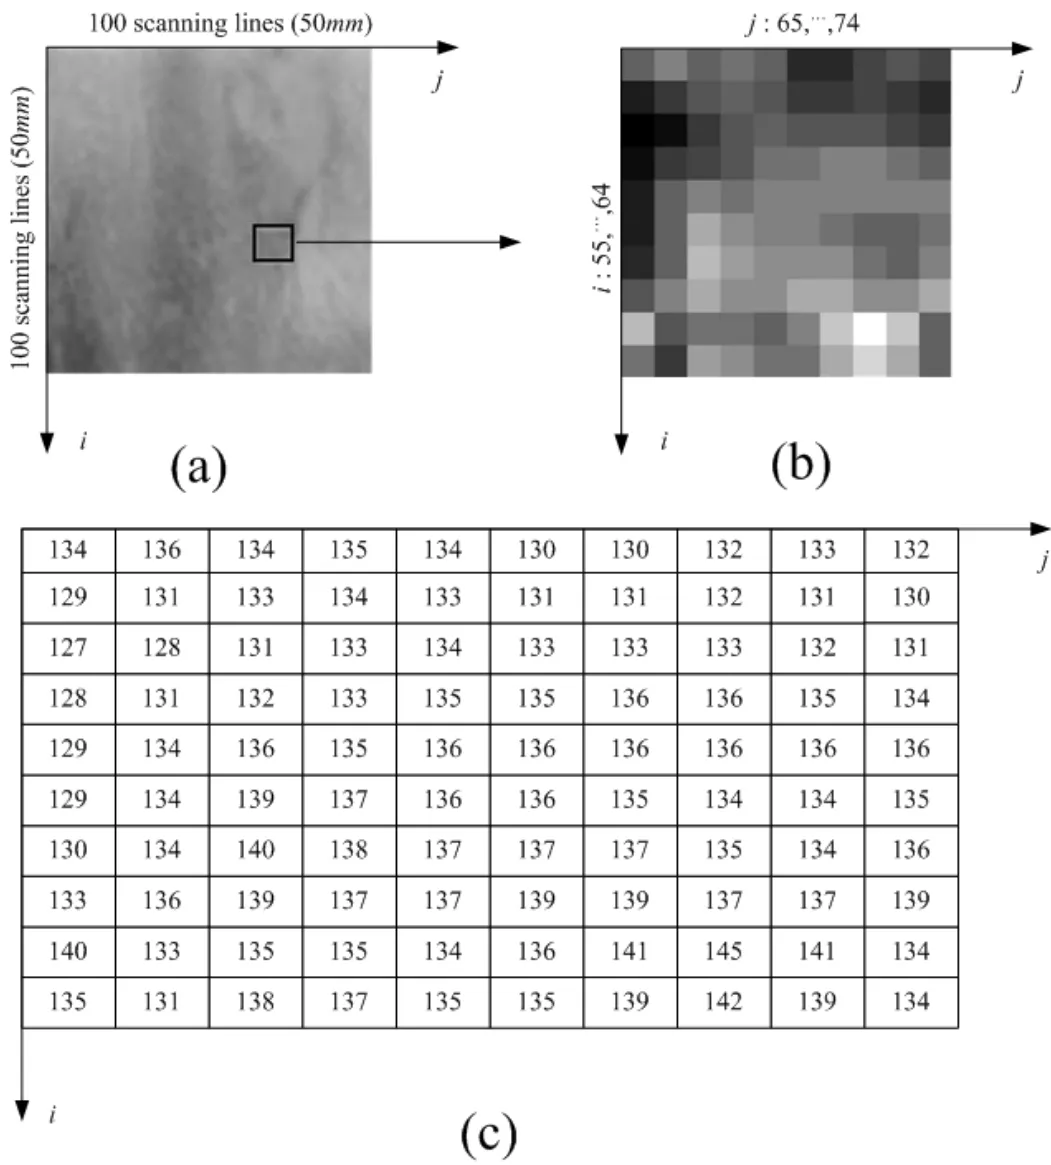
Figure 1:An example of original digital image and discrete function:(a)Original image,(b)Some part of rectangle girds(Local i and j coordinate system),(c)Matrix of discrete function f(i,j)(Local i and j coordinate system)

where,g(i,j)is the grey value of pixel in the i th row and the j th column after the median filter;Med{}denotes the median function;f(i,j)is the original grey value of pixel in the i th row and the j th column;r and s are the length and width of the neighborhood A.
In this paper,the median filter for original images has been performed with a defined 3-by-3 square neighborhood by sliding the center point of it through the image.And the pixel value in the image is replaced by median value of its neighboring pixels.Fig.2 shows digital images before and after pre-treatments.Comparing to the original image,the new image enhances contrast among the different rock materials and preserves more details of mesostrcuture.
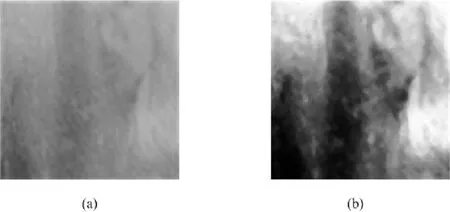
Figure 2:The comparison before and after image pre-treatments:(a)the original image,(b)the image after pre-treatments
2.3 Image segmentation technique based on SRG
Image segmentation is an important process of image analysis.It consists of subdividing an image into its constituent parts and extracting these parts of interest.For gray-scale images,segmentation algorithms are based on two basic properties of image gray value:discontinuity and similarity.In the former,the approach is to partition an image base on abrupt changes in grey level,such as edge detection algorithm;in the latter,the principal approach is on the basis of partitioning an image into regions that are similar according to a set of predefined criteria,such as SRG and traditional threshold algorithm.However,due to the property of rock materials,the gray level of each material is not an exact value but an interval.So it is common that some overlap of gray level interval among rock materials is presented.This case may lead to inaccurate segmentation by using traditional threshold algorithm.Because the threshold algorithm assumes that all pixels whose value(gray level,color value,or others)lie within a certain range belong to one class.Thus,SRG algorithm which can fully consider the spatial information of rock materials is adopted in this paper.
In fact,the basic approach of SRG is to start with a number of seed points which have been classified into n sets,say,A1,A2,···,Anand form these growing regions by appending to each those neighboring pixels that have predefined properties similar to the seed point.And the choice of similarity criteria is critical for even moderate success in region growing[Adams and Bischof(1994);Pavlidis and Liow(1990)].Generally,three types of expression are given:criterion based on gray value difference,criterion based on gray value distribution and criterion based on region shape.
Taking the above stratified rock image pre-treated(Fig.2(b))as an example,the purpose of segmentation is partitioning the image into two regions that is greenschist region(growing region)and marble region(ungrowing region).Firstly,in order to acquire better segmentation results,nine seed points,namely the initial state of the sets A1,A2,···,A9,consisting of single points respectively,are manually chosen from the image.Their coordinates are shown in Table 1.Then,the indicator matrix employed to record the growing process is formed.It has the same size with the rectangle array of the image and all its initial elements are filled by label“1”.Afterward,the corresponding elements in the indicator matrix to seed points are changed to the label“0”.Setting T as growing pixels which border ungrowing region,the state of after m steps will be considered as follow,

where N(x)is the immediate neighbors of the pixel x and R represents entire region of the digital image.In fact,T is a data structure(an array)termed queue of border pixels(QBP).When considering a new pixel,at the beginning of each step of SRG,we take that one at the beginning of the array.For the segmentation process to be presented,the immediate neighbors which are 8-connected to the pixel x are used.δ[Ni(x)]is defined to be a measure of how different the pixel Ni(x)is from the growing region it adjoins.Where,i belongs to{1,2,···,8}.The simplest definition for δ[Ni(x)]is

where f[Ni(x)]and f(y)are the gray value of the pixel Ni(x)and seed point y which belongs to the growing region,respectively.
The similarity criterion based on gray value difference is given as follow,


Eq.(5)notes that for the pixelNi(x),if the gray value difference to the growing region it adjoins is in the predefined range of Δ,the pixelNi(x)will belong to the region.That is,the corresponding label in the indicator matrix to the pixelNi(x)will be changed to the label of the pixelx.Meanwhile,the pixelNi(x)is put in the end of data structureT.And the pixelxis deleted in the data structureT.This completes stepm+1.The process is repeated until no pixels are in the data structureT.The flow chart of the algorithm is shown in Fig.3.For threshold Δ,a trial-and-error method can be used to adjust it so that the best results are obtained.And the thresholds correspond to the nine individual seeds are shown in Table 1.
After segmentation,some holes and gaps may still exist in images.The morphological closing and filling method shown in Ref.[Gonzalez et al.(2004)]are used to get rid of them.Fig.4 reflects the whole process of segmentation of the stratified rock image.
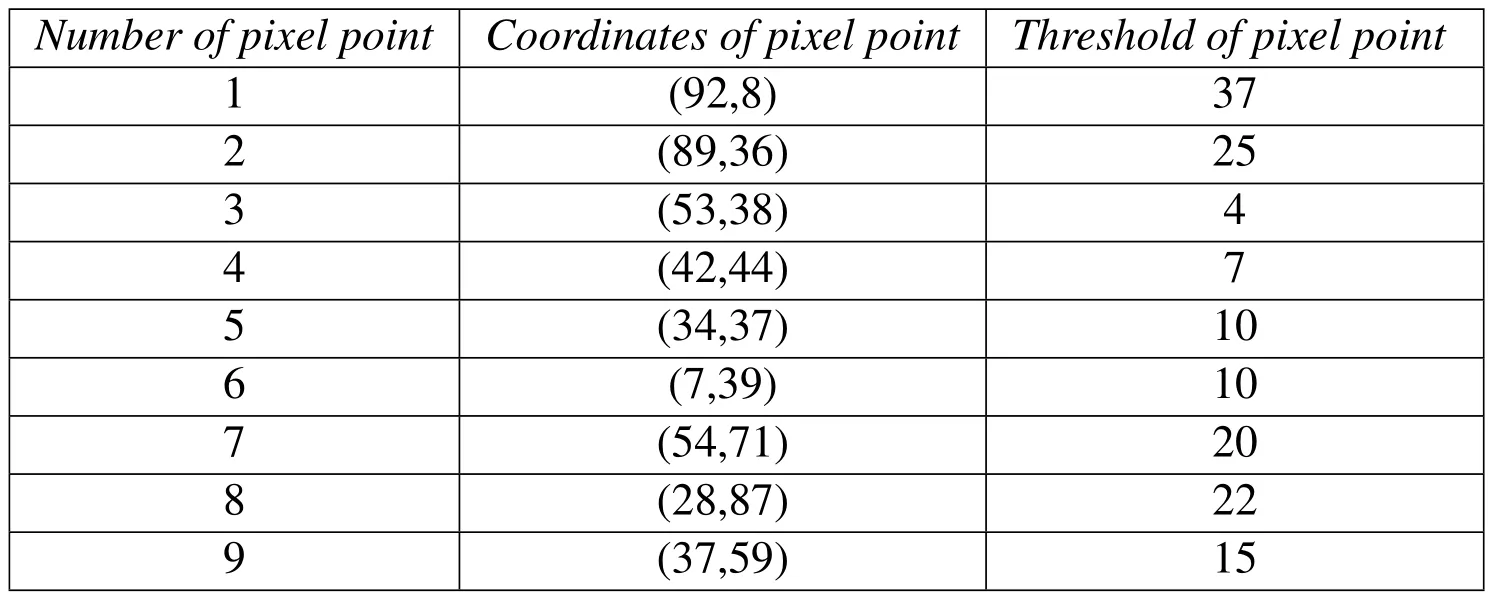
Table 1:The coordinates and response thresholds of individual seeds.
3 The Finite difference grid Generation
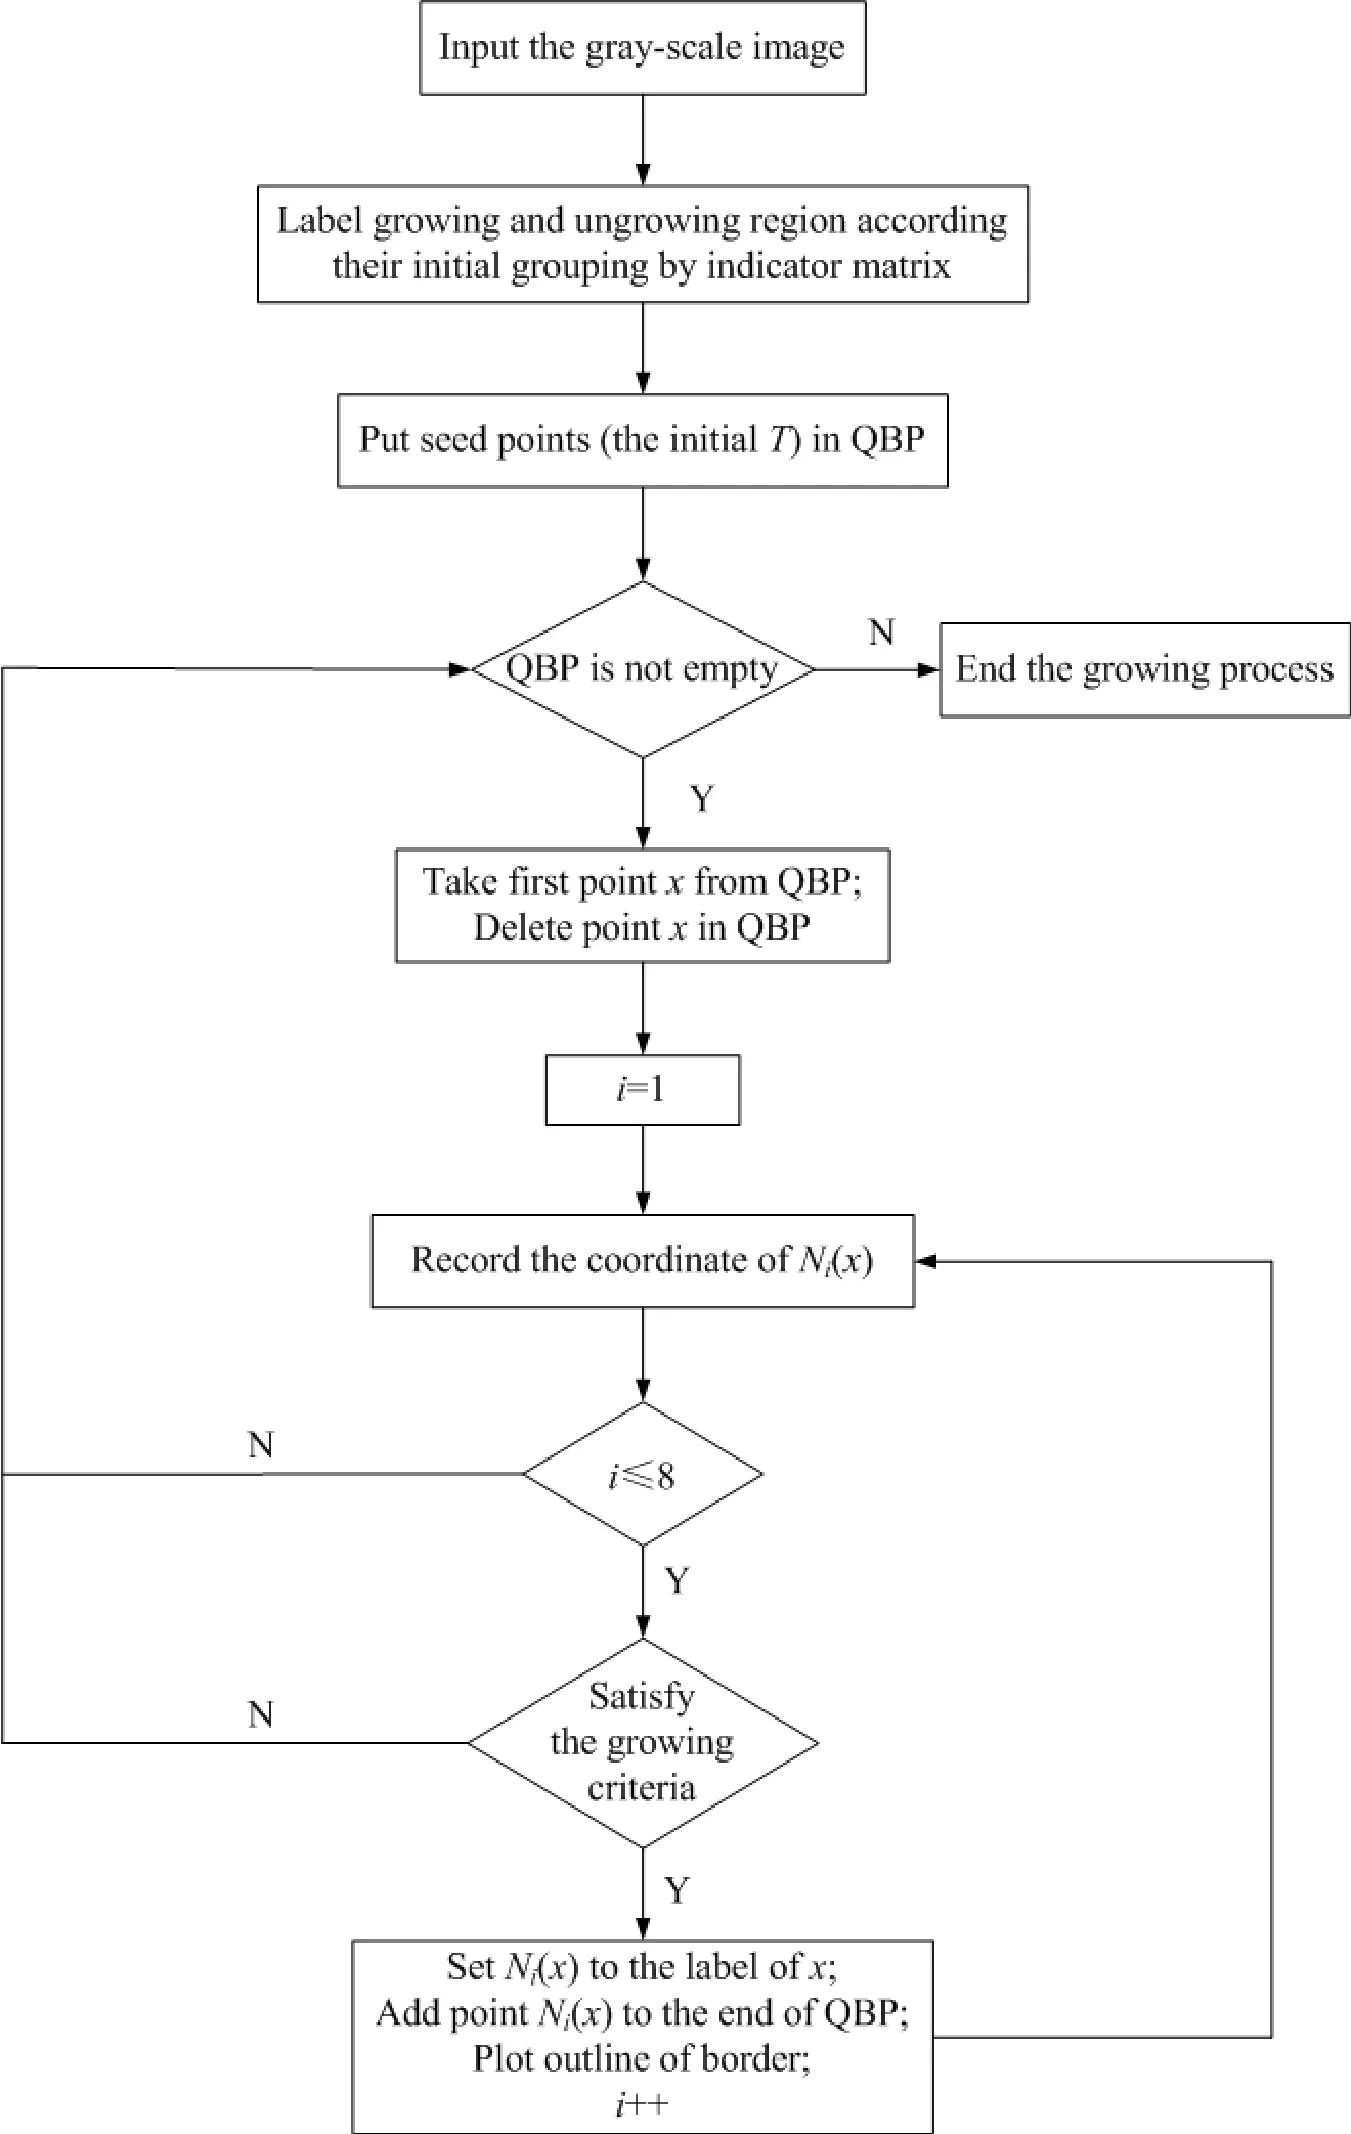
Figure 3:The flow chart of the SRG algorithm for individual seed.
The Finite difference grid is a prerequisite for carrying out the numerical analysis.In order to represent the mesostructure of inhomogeneous rocks,the rock material distribution and geometry shown in the binary above should be taken into account.However,the finite difference grid cannot be generated directly from the binary images.The binaryzation information is required to be transformed.As mentioned in section 2.3,binary images are special discrete rectangular arrays and their gray values of pixels are either 0 or 1.Therefore,the image can be considered as equivalent finite difference grid.Using the Fig.1(b)as an example,basic grids are generated by dealing with pixels in the image as grids and pixel angular points as nodes shown in Fig.5(a).And the scale distance l can be calculated as follow,

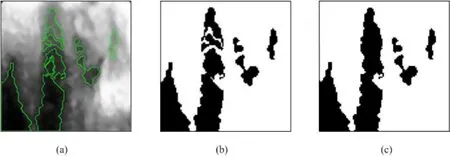
Figure 4:The whole process of segmentation of the stratified rock image:(a)the outline formed by SRG,(b)the binary image after segmentation,(c)the binary image after morphological mend.
Meanwhile,the corresponding discrete rectangular arrays of binary image transforming from Fig.1(b)can provide exact distribution of the two rock materials,as shown in Fig.5(b).Subsequently,combining the basic grids with distribution information of different rock materials,the finite difference grid considering actual mesostructure is generated in Fig.5(c).And the finite difference grid corresponding to the numerical image of stratified rock cross-section is displayed in Fig.6.The size of grids is 50mm×50mm and the scale of rectangle grid is 0.5mm×0.5mm.In fact,the precision of finite difference grid generated is decided by the scale of pixels.
As a practical approach,the grids generation method is not complicated to implement.And in this method,the actual mesostructure preserved in pixels of image are represented by the transforming information of binaryzation image.Thus,the finite difference grid generated keep highly consistent with the stratified rock crosssection in appearance.
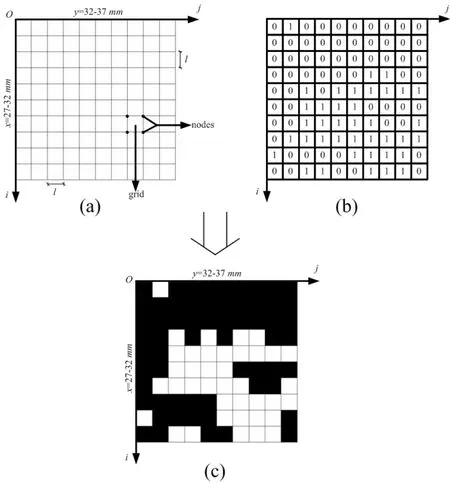
Figure 5:An example of finite difference grids generation:(a)Basic grids;(b)Matrix of discrete function f(i,j);(c)Finite difference grids(Local i and j coordinate system).
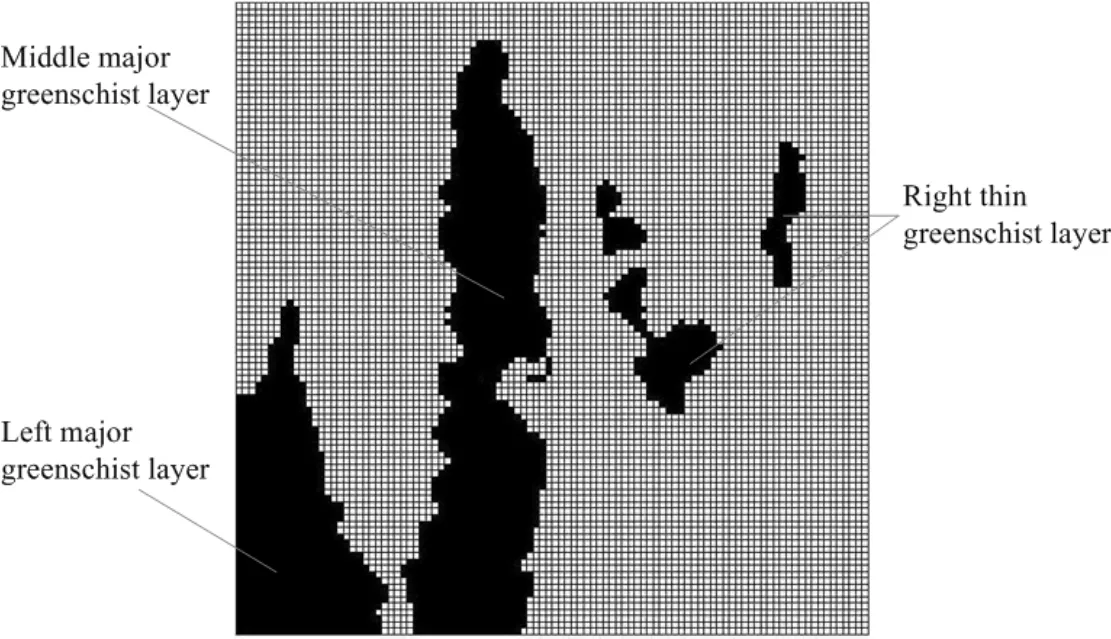
Figure 6:The Finite difference grid.
4 Numerical simulation of failure behaviors
In this section,an explicit finite difference scheme,the commercial software FLAC(Fast Lagrangian Analysis of Continua),is employed to simulate failure behaviors of stratified rock specimens with different inhomogeneity indices under uniaxial compression loading.In order to consider the property of anisotropy,loading directions parallel and vertical with preferred orientation of greenschist layers are adopted.
4.1 FDM modeling and loading procedure
In the numerical analysis,the finite difference grid based on the actual mesostructure of stratified rocks is utilized at mesoscale;the Mohr-Coulomb failure criterion envelope with a tensile cut-off,which is incorporated into the elastic-brittle-plastic constitutive model[Lee et al.(1997)],is used so that the failure of the grids may be either in shear or in tension state.In the elastic-brittle-plastic model,the degradation index of elastic modulus and cohesive is 30%.In order to capture the material inhomogeneity of stratified rocks,the Weibull random manner is taken into account to distribute the mechanical properties(elastic modulus Ec and cohesion Cc of different rock materials.The adaptable Weibull distribution function is given as follow,

where Ecand E0is the elastic modulus and mean elastic modulus of grids,respectively.For the cohesive Cc,the same distribution is used;m is defined as the homogeneity index of the rock materials.According to the definition,a larger m implies a more inhomogeneous material and vice versa.In this study,on the basis of mesostructure model,four specimens with different homogeneity indices,m=2.0,4.0,6.0,8.0,and a homogenous specimen are generated,representing rock materials from relative inhomogeneity to completely homogeneity.The mechanical properties for all the specimens are listed in Table 2 referring to Ref.[Deng and Zhang(2001);Huang(2008)].The homogeneous elastic modulus and cohesion are assumed equally with mean elastic modulus and cohesion.Fig.7 displays the elastic modulus distribution of marble with different homogeneity indices.
For the loading procedure,an external displacement at a constant rate of 10−5mm/step is set in the axial direction and the stress as well as the deformation in each grid is also computed.The external displacement in the axial direction is then increased step by step.And this is equivalent to displacement control in the analogous servo-controlled laboratory experiment.At each step,the stress states in some grids may satisfy the failure criterion.Such grids are damaged and weakened according to the rules specified by the soften function of strength parameters in the next step.And the stress and deformation distribution throughout the specimen are then inclined to reach the equilibrium state by adjusting instantaneously.At locations with increased stresses due to stress redistribution,the stress state may reach the critical value and further ruptures are caused,the process is repeated until the macroscopic fractures are formed.

Table 2:Material parameters.
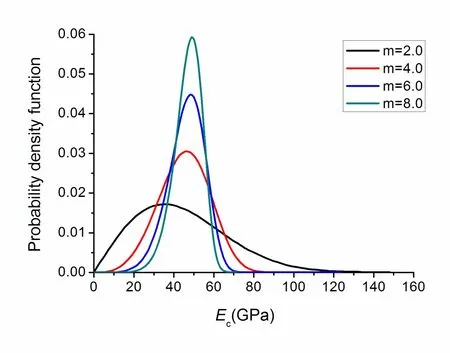
Figure 7:Elastic modulus distribution with different homogeneity indices.
4.2 Analyses of Numerical failure behaviors
4.2.1Influence of rock material inhomogeneity
Fig.8 reveals the stress-strain characteristics of five stratified rock specimens with different homogeneity indices under parallel loading condition.As the axial strain is increased,each stress-strain curve is nearly linear at the initial stage.When the applied load reaches approximately 50%of the peak load,the strain-softening behavior is demonstrated.And due to the fact that the rock begins to nucleate obvious mesofractures,the tangent stiffness of the specimen decreases and it reaches zero at the compressive strength.Above that stress,the brittle feature is displayed by large stress drop rapidly.Until macrofractures occur,the state similar with perfect plastic is shown in the end.Comparing the five stress-strain curves,it is evident that the stress-strain relation and the strength characterization depend strongly on the heterogeneity of the specimen.From Fig.8,the maximal strength values of the specimens are 67,72,80,85 and 95 MPa for the inhomogeneous specimens,m=2.0,4.0,6.0,8.0 and the homogeneous specimen.It can be seen that the higher the degree of the homogeneity,the higher the strength of the specimen.The elastic modulus value in linear stage is smaller,and the strength loss is also gentler as the increase of inhomogeneity level.These results agree fairly well with the experimental observations and numerical simulations[Hudson et al.(1972);Liu et al.(2004);Tang et al.(2000);Wawersik and Brace(1971)].
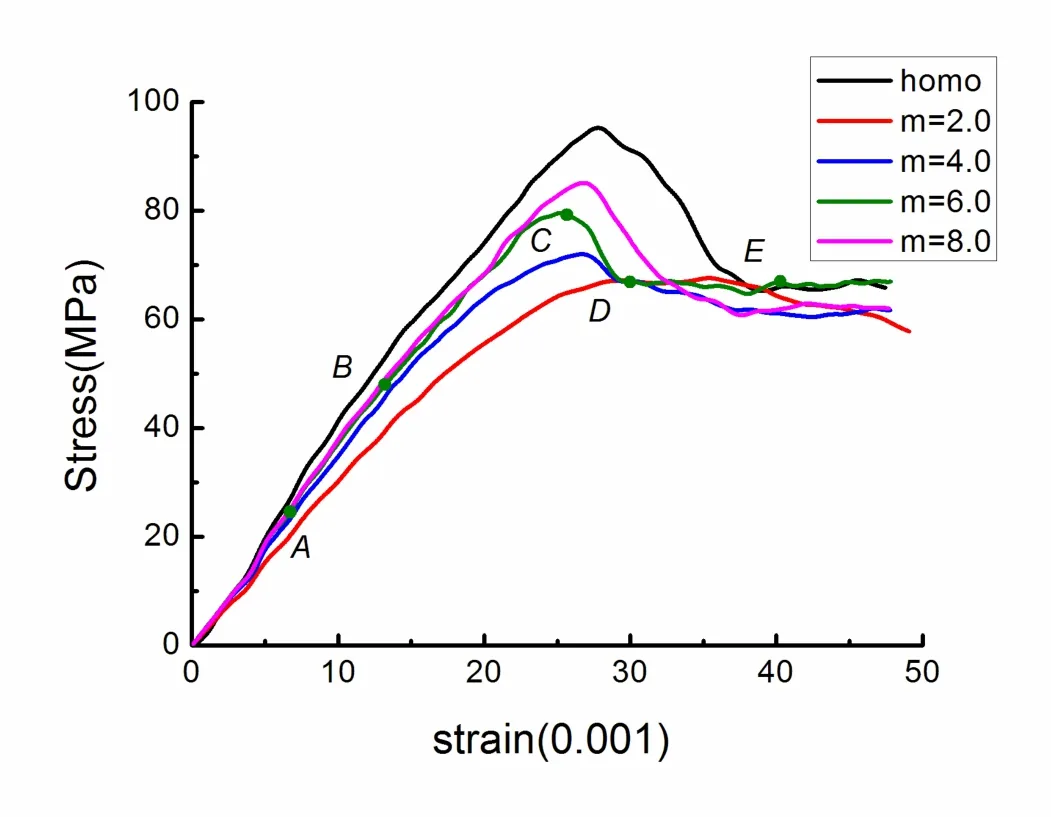
Figure 8:influence of rock material inhomogeneity on the stress-strain curves for five specimens with different homogeneity indices(loading in the parallel condition).
4.2.2 Influence of loading conditions
Fig.9 shows the stress-strain characteristics of the stratified rock specimen with homogeneity index,m=6,in vertical loading condition.The elastic-brittle-plastic property of specimen can also be displayed.But due to the influence of different loading conditions,it has a great difference for the shape of the two stress-strain curves of specimens with the same homogeneity index m=6 shown in Fig.8 and Fig.9.Compared to the vertical loading condition,it is found that the elastic modulus value in linear stage as well as the strength loss is much larger under the parallel loading condition.
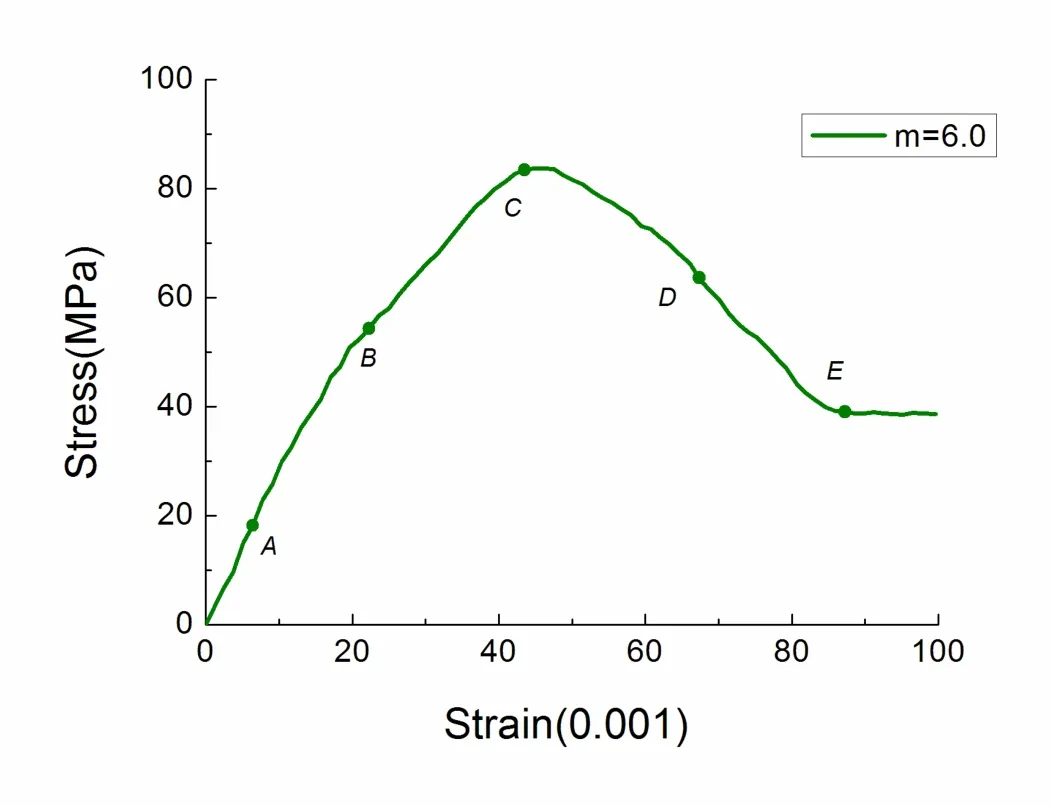
Figure 9:The stress-strain curve for the specimen with homogeneity index m=6(loading in the vertical condition).
Fig.10 and Fig.11 indicate the progressive failure processes corresponding to the five points of the stress-strain curves such as points(a)to(e)under parallel and vertical loading conditions when homogeneous index m=6,respectively.From Fig.10,it is observed that:(1)at point(a)of the stress-strain curve,tension failure first occurs,and most failure domains locate the right thin and left major greenschist layers,few failure domains are from the middle major greenschist layer;(2)increasing the applied load to point(b),the tension failure domains slowly increase,and the shear failure appears at right thin and left major greenschist layers;(3)as the fractures grow and coalescence,a large amount of shear failure domains are formed along the long-axial direction of middle major greenschist layer.And at last the sample is completely destroyed because most shear failure domains links up a few tension failure domains;(4)the final failure mode is quite different from the traditional failure mode of homogenous materials under uniaxial compression loading.
For Fig.11,It presents from the results that:(1)at point(a)of the stress-strain curve,tension failure first occurs the same as that under parallel loading condition,and most failure domains locate the middle major greenschist layer;(2)with the increased load,at point(b),the shear failure mainly appears at the middle major greenschist layer and the failure domain has some angle with short-axial direction of middle major greenschist layer.In addition,a few shear failure domains appear at right thin and left major greenschist layers;(3)due to the further increase in applied load,a large amount of shear failure domains as well as tension failure domains are formed the specimen failure mode,and the expansion of failure domains are inclined to the loading direction;(4)the final failure mode is quite different from that under parallel loading condition.In particular,the shear failure domains are along the long-axial direction for the vertical loading condition and approximately along the short-axial direction of major greenschist layer for the horizontal loading condition.
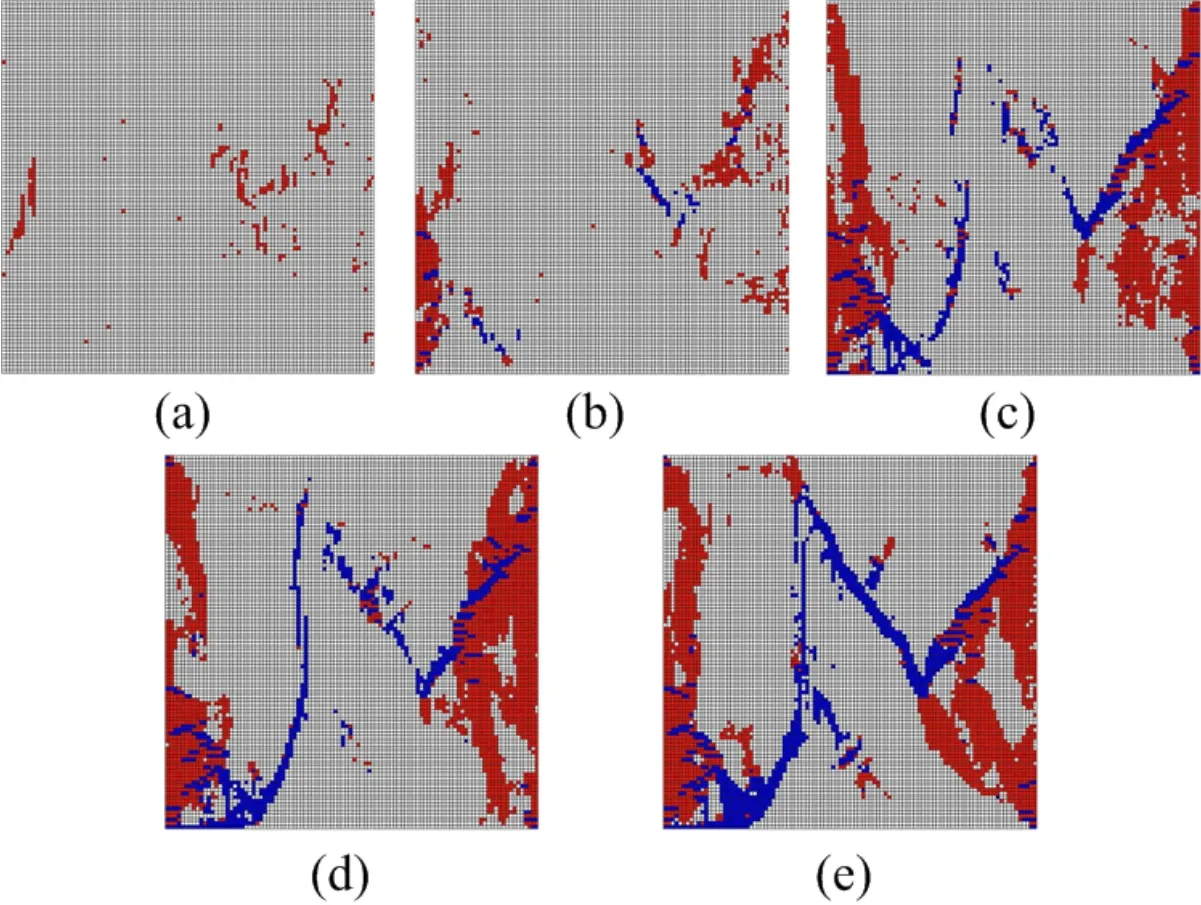
Figure 10:Simulated fracture process of the sample under parallel loading condition(white:elastic state;red:tension failure state;blue:shear failure state):(a)the failure domains corresponding to point(a)of stress-strain curve;(b)the failure domains corresponding to point(b)of stress-strain curve;(c)the failure domains corresponding to point(c)of stress-strain curve;(d)the failure domains corresponding to point(d)of stress-strain curve;(e)the failure domains corresponding to point(e)of stress-strain curve.
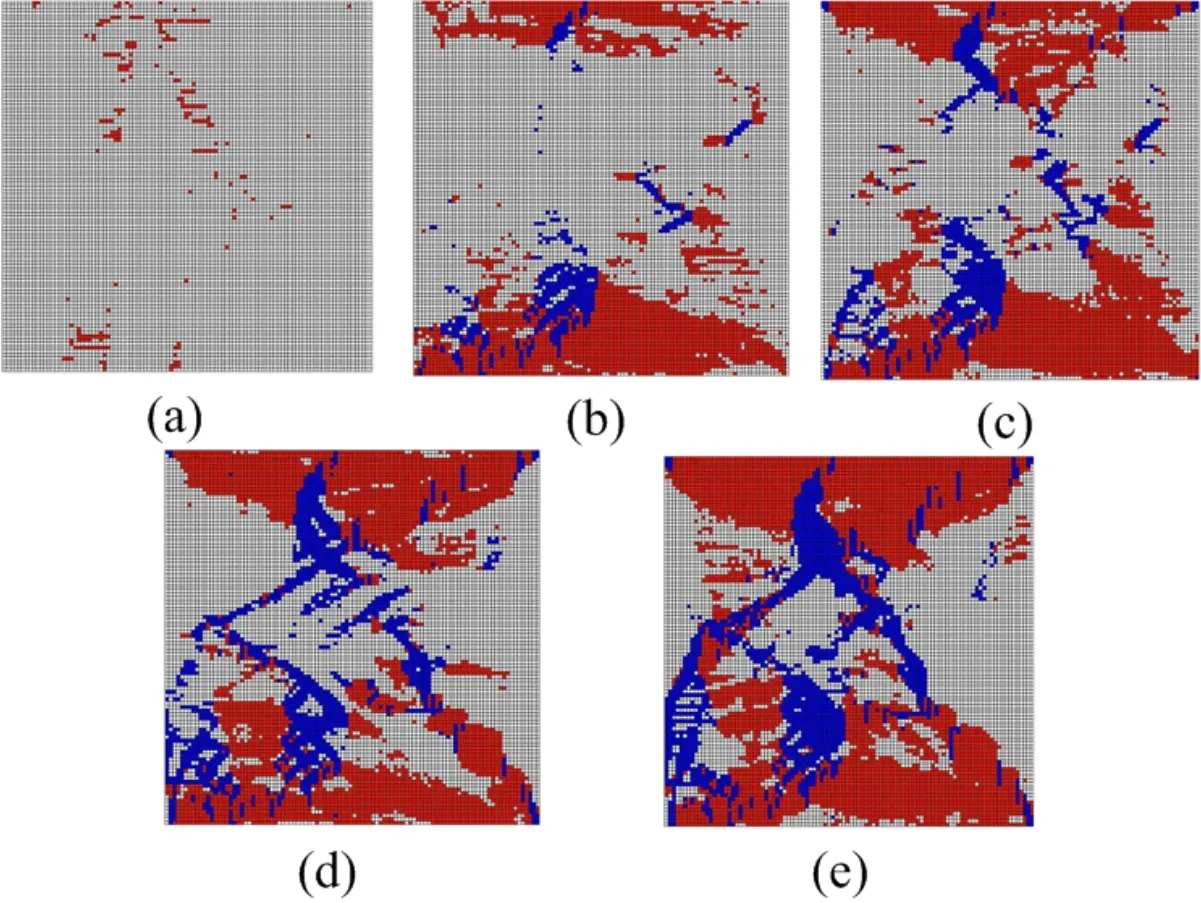
Figure 11:Simulated fracture process of the sample under vertical loading condition(white:elastic state;red:tension failure state;blue:shear failure state):(a)the failure domains corresponding to point(a)of stress-strain curve;(b)the failure domains corresponding to point(b)of stress-strain curve;(c)the failure domains corresponding to point(c)of stress-strain curve;(d)the failure domains corresponding to point(d)of stress-strain curve;(e)the failure domains corresponding to point(e)of stress-strain curve.
5 Conclusions
In this study,the DIP based FDM is developed for prediction of inhomogeneous rock failure behavior under loadings.In the method,the 2D mesostructure of stratified rocks is identified with the DIP technique,the binaryzation image information is then used to generate the numerical grids,and considering the inhomogeneity of rock materials,the failure behaviors of stratified rock specimens are simulated by the FDM under different uniaxial compression conditions.The macroscopic mechanical properties performed in numerical simulations are in a good agreement with the presentation in the literature.Several key points may be drawn from the present discussion as follows:
1.The inhomogeneity of stratified rocks can be well obtained by the developed DIP based FDM from aspects of mesostructure and rock materials.And the problem of overlapping between gray level intervals of rock materials can be solved with image segmentation algorithm based on SRG.
2.The inhomogeneity and the loading conditions have significant effects on the failure behaviors of stratified rocks.Particularly,as the increase of homogeneity degree,mechanical properties of stratified rocks display regular changes.
3.The DIP based FDM is suitable for the failure analysis of stratified rocks because it can fully take into account the rock inhomogeneity,and the macroscopic anisotropy of stratified rocks can also be shown by the inhomogeneous modeling to some extent.
AcknowledgementThe work described in this paper was supported by the National Natural Science Foundation of China(No.50978083,51278169).
Adams,R.;Bischof,L.(1994):Seeded region growing.Pattern Analysis and Machine Intelligence,IEEE Transactions on,vol.16,no.6,pp.641-647.
Ammouche,A.;Breysse,D.;Hornain,H.;Didry,O.;Marchand,J.(2000):A new image analysis technique for the quantitative assessment of microcracks in cement-based materials.Cement and Concrete Research,vol.30,no.1,pp.25-35.
Attewell,P.B.;Sandford,M.R.(1974):Intrinsic shear strength of a brittle,anisotropic rock—I:Experimental and mechanical interpretation.International Journal of Rock Mechanics and Mining Sciences&Geomechanics Abstracts,vol.11,no.11,pp.423-430.
Bobet,A.;Einstein,H.(1998):Fracture coalescence in rock-type materials under uniaxial and biaxial compression.International Journal of Rock Mechanics and Mining Sciences,vol.35,no.7,pp.863-888.
Brady,B.;Brown,E.(2004):Rock Mechanics for underground mining.3rd Edition.Springr.
Cazacu,O.;Cristescu,N.;Shao,J.(1998):A new failure criterion for transversely isotropic rocks.International Journal of Rock Mechanics and Mining Sciences,vol.35,no.4,pp.421-421.
Chen,S.;Yue,Q.;Kwan,A.(2013):Actual microstructure-based numerical method for mesomechanics of concrete.Computers and Concrete,vol.12,no.1,pp.1-18.
Chen,S.;Yue,Z.;Tham,L.(2007):Digital image based approach for three-dimensional mechanical analysis of heterogeneous rocks.Rock mechanics and rock engineering,vol.40,no.2,pp.145-168.
Deng,R.G.;Zhang,Z.Y.(2001):On the microstructure and mechanical properties of greenschist in the dam site of Jinping Hydropower Station.Journal of Chengdu University of Technology,vol.28,no.1,pp.93-97.
Dong,L.;Atluri,S.N.(2011):Development of T-Trefftz four-node quadrilateral and Voronoi Cell Finite Elements for macro-µmechanical modeling of solids.CMES:Computer Modeling in Engineering&Sciences,vol.81,no.1,pp.69-118.
Dong,L.;Atluri,S.N.(2012a):Development of 3D T-Trefftz Voronoi cell finite elements with/without spherical voids&/or elastic/rigid inclusions for micromechanical modeling of heterogeneous materials.CMC:Computers Materials and Continua,vol.29,no.2,pp.169-212.
Dong,L.;Atluri,S.N.(2012b):Development of 3 D Trefftz Voronoi Cells with Ellipsoidal Voids&/or Elastic/Rigid Inclusions for Micromechanical Modeling of Heterogeneous Materials.CMC:Computers Materials and Continua,vol.30,no.1,pp.39-82.
Dong,L.;Atluri,S.N.(2013):SGBEM Voronoi Cells(SVCs),with embedded arbitrary-shaped inclusions,voids,and/or cracks,for micromechanical modeling of heterogeneous materials.CMC:Computers,Materials&Continua,vol.33,no.2,pp.111-154.
Du,C.;Jiang,S.;Qin,W.;Xu,H.;Lei,D.(2012):Reconstruction of internal structures and numerical simulation for concrete composites at mesoscale.Computers&Concrete,vol.10,no.2,pp.135-147.
Duveau,G.;Shao,J.(1998):A modified single plane of weakness theory for the failure of highly stratified rocks.International Journal of Rock Mechanics and Mining Sciences,vol.35,no.6,pp.807-813.
Fang,Z.;Harrison,J.(2002):Development of a local degradation approach to the modelling of brittle fracture in heterogeneous rocks.International Journal of Rock Mechanics and Mining Sciences,vol.39,no.4,pp.443-457.
Gonzalez,R.C.;Woods,R.E.(2002):Digital image processing.Upper Saddle River,N J:Pearson Prentice Hall.
Gonzalez,R.C.;Woods,R.E.;Eddins,S.L.(2004):Digital image processing using MATLAB.Upper Saddle River,N J:Pearson Prentice Hall.
Huang,S.L.(2008):Study of mechanical model of brittle rock under high stress condition and its engineering applications.Ph.D thesis,Chinese Academy of Sci-ences.
Hudson,J.A.;Brown,E.T.;Fairhurst,C.(1971):Shape of the complete stressstrain curve for rock.Proceedings of the 13thUS Symposium on Rock Mechanics Stability of Rock Slopes,Urbana,United States,A.S.C.E.,pp.773-795.
Jaeger,J.(1960):Shear failure of anistropic rocks.Geological Magazine,vol.97,no.1,pp.65-72.
Jiao,Y.Y.;Zhang,X.L.;Zhao,J.(2011):Two-dimensional DDA contact constitutive model for simulating rock fragmentation.Journal of EngineeringMechanics,vol.138,no.2,pp.199-209.
Jiao,Y.Y.;Zhang,H.Q.;Zhang,X.L.;Li,H.B.;Jiang,Q.H.(2014):A coupled hydro-mechanical discontinuum model for simulating hydraulic fracturing of jointed rock.International Journal for Numerical and Analytical Methods in Geomechanics,in press.
Kwan,A.;Mora,C.;Chan,H.(1999):Particle shape analysis of coarse aggregate using digital image processing.Cement and Concrete Research,vol.29,no.9,pp.1403-1410.
Lawler,J.S.;Keane,D.T.;Shah,S.P.(2001):Measuring three-dimensional damage in concrete under compression.ACI Materials Journal,vol.98,no.6,pp.465-475
Lee,C.;Zheng,H.;Ge,X.(1997):Macro-constitutive model for brittle-plastic rock and its application.Proceedings of IS-NAGOYA97,Gifu,Japan,pp.359-64.
Leite,J.;Slowik,V.;Apel,J.(2007):Computational model of mesoscopic structure of concrete for simulation of fracture processes.Computers&Structures,vol.85,no.17,pp.1293-1303.
Li,L.;Tang,C.;Wang,S.(2012a):A numerical investigation of fracture infilling and spacing in layered rocks subjected to hydro-mechanical loading.Rock mechanics and rock engineering,vol.45,no.5,pp.753-765.
Li,S.;Feng,X.T.;Li,Z.;Zhang,C.;Chen,B.(2012b):Evolution of fractures in the excavation damaged zone of a deeply buried tunnel during TBM construction.International Journal of Rock Mechanics and Mining Sciences,vol.55,pp.125-138.
Liu,H.;Roquete,M.;Kou,S.;Lindqvist,P.A.(2004):Characterization of rock heterogeneity and numerical verification.Engineering Geology,vol.72,no.1,pp.89-119.
Ma,G.;Wang,X.;Ren,F.(2011):Numerical simulation of compressive failure of heterogeneous rock-like materials using SPH method.International Journal of Rock Mechanics and Mining Sciences,vol.48,no.3,pp.353-363.
Mora,C.;Kwan,A.;Chan,H.(1998):Particle size distribution analysis of coarse aggregate using digital image processing.Cement and Concrete Research,vol.28,no.6,pp.921-932.
Niandou,H.;Shao,J.;Henry,J.;Fourmaintraux,D.(1997):Laboratory investigation of the mechanical behaviour of Tournemire shale.International Journal of Rock Mechanics and Mining Sciences,vol.34,no.1,pp.3-16.
Obaidat,M.T.;Al-Masaeid,H.R.;Gharaybeh,F.;Khedaywi,T.S.(1998):An innovative digital image analysis approach to quantify the percentage of voids in mineral aggregates of bituminous mixtures.Canadian journal of civil engineering,vol.25,no.6,pp.1041-1049.
Pavlidis,T.;Liow,Y.T.(1990):Integrating region growing and edge detection.Pattern Analysis and Machine Intelligence,IEEE Transactions on,vol.12,no.3,pp.225-233.
Salamon,M.(1968):Elastic moduli of a stratified rock mass.International Journal of Rock Mechanics and Mining Sciences&Geomechanics Abstracts,vol.5,no.6,pp.519-527.
Singh,M.;Rao,K.;Ramamurthy,T.(2002):Strength and deformational behaviour of a jointed rock mass.Rock Mechanics and Rock Engineering,vol.35,no.1,pp.45-64.
Tang,C.;Liu,H.;Lee,P.;Tsui,Y.;Tham,L.(2000):Numerical studies of the influence of microstructure on rock failure in uniaxial compression—part I:effect of heterogeneity.International Journal of Rock Mechanics and Mining Sciences,vol.37,no.4,pp.555-569.
Tien,Y.M.;Kuo,M.C.(2001):A failure criterion for transversely isotropic rocks.International Journal of Rock Mechanics and Mining Sciences,vol.38,no.3,pp.399-412.
Tien,Y.M.;Kuo,M.C.;Juang,C.H.(2006):An experimental investigation of the failure mechanism of simulated transversely isotropic rocks.International journal of rock mechanics and mining sciences,vol.43,no.8,pp.1163-1181.
Wang,Z.;Kwan,A.;Chan,H.(1999):Mesoscopic study of concrete I:generation of random aggregate structure and finite element mesh.Computers&structures,vol.70,no.5,pp.533-544.
Wawersik,W.;Brace,W.(1971):Post-failure behavior of a granite and diabase.Rock Mechanics,vol.3,no.2,pp.61-85.
Yue,Z.;Chen,S.;Tham,L.(2003):Finite element modeling of geomaterials using digital image processing.Computers and Geotechnics,vol.30,no.5,pp.375-397.
Yue,Z.Q.;Morin,I.(1996):Digital image processing for aggregate orientation in asphalt concrete mixtures.Canadian Journal of Civil Engineering,vol.23,no.2,pp.480-489.
Zelelew,H.M.;Papagiannakis,A.T.(2010):Micromechanical modeling of asphalt concrete uniaxial creep using the discrete element method.Road Materials and Pavement Design,vol.11,no.3,pp.613-632.
Zhang,X.l.;Jiao,Y.Y.;Zhao,J.(2008):Simulation of failure process of jointed rock.Journal of Central South University of Technology,vol.15,issue 6,pp.888-894.
Zhu,W.;Teng,J.;Tang,C.(2004):Mesomechanical model for concrete.Part I:model development.Magazine of concrete research,vol.56,no.6,pp.313-330.
1Department of Engineering Mechanics,Hohai University,Nanjing 210098,PR China.
2Corresponding author.E-mail:gjshao@hhu.edu.cn
3Department of Engineering Mechanics,North China University of Water Resources and Electric Power,Zhengzhou 450011,PR China.
4College of Harbour,Coastal and Offshore Engineering,Hohai University,Nanjing 210098,PR China.
 Computers Materials&Continua2015年1期
- Computers Materials&Continua的其它文章
- On Improving the Celebrated Paris’Power Law for Fatigue,by Using Moving Least Squares
- Development and Characterization of the Midrib of Coconut Palm Leaf Reinforced Polyester Composite
- Impact Response of Stiffened Cylindrical Shells With/without Holes Based on Equivalent Model of Isogrid Structures
