
Study of Damping Ratio Identification for a Truss Spar Based on Continuous Wavelet Transform
2015-12-12 08:52:46ZHANGHuiYANGJianminXIAOLongfeiLUHaining
船舶力学 2015年9期
ZHANG Hui,YANG Jian-min,XIAO Long-fei,LU Hai-ning
(State Key Laboratory of Ocean Engineering,Shanghai Jiao Tong University,Shanghai 200240,China)
0 Introduction
The dynamic analysis of a cylinder subjected to VIM requires the information of dynamic properties of the structures,including response frequencies and damping ratios.The investigation on the damping ratio of the Truss Spar subjected to VIM is not intensive.However,in the field of Vortex-Induced Vibration(VIV),damping is extensively studied.One of the most widely used models is the structural damping model,where the dissipation of energy in a single oscillation is independent of the frequency[1].Another widely used model is the hydrodynamic damping model which assumes the hydrodynamic damping is the function of response frequency,flow speed and vibration amplitude.In the early 1996,Venugopal[2]proposed a damping model which was extensively applied in the VIV prediction program,such as SHEAR7[3].Vikestad[4]improved the damping model based on the Venugopal’s damping model.Modal damping ratios are difficult to predict and have a strong influence on the dynamic structuralbehavior,the amplitude of vibrations at resonance being inversely proportional to these coefficients.The influence of damping ratios on VIV of a cylinder was widely studied[5-7]and it also affects the energy harvest from the flow induced vibration[8].
The Continuous Wavelet Transform(CWT)as a typical time-frequency method,possesses the ability to construct a time-frequency representation of a signal that offers good time and frequency localization compared to Fast Fourier Transform(FFT)or other frequency domain method.Compared to traditional Fourier Transform methods,CWT method has advantages,in representing many different frequency components at the same time or many different time components in one frequency,identifying discontinuities and sharp peaks,processing non-periodic and non-stationary signals,and processing short signals[9].In the past decade,the CWT-based damping identification methods have been proved to be some of the more promising damping-identification method and were extensively applied to identify the damping ratio in engineering filed,including the damping estimation of railway and cable-stayed bridge in civil engineering[10-11],the damage identification of the material in material engineering[12],the identification of an actuator’s valve on a nuclear plant[13],application in train whistle and bird chirps or ultrasonic detect system in acoustic field[14-15]and vibration isolation system in mechanical engineering[16].However,CWT method was not widely applied to flow induced vibration field in ocean engineering until now.
A series of VIM model tests of the Truss Spar were conducted in towing tank at Zhejiang Ocean University(ZOU).Eight different free-decay tests were conducted in still water to provide sufficient and different dataset.The CWT method has been proven to be resistant to noise and can identify damping at closely spaced natural frequencies.Based on its advantage,CWT method was applied to identify the damping ratio of the Truss Spar in ocean engineering.
1 The free vibration with viscous damping
It is well known that the free vibration(no external force)of the Single-Degree-of-Freedom system(SDOF)with viscous damping can be illustrated as Fig.1.
For an unforced damped SDOF system,the general equation of motion can be expressed as:

where m,c and k are mass,spring stiffness and viscous damping of system,respectively.and x are the acceleration,velocity and displacement of the system,respectively.
Supposing the natural frequency ωnand damping ratio ζncan be expressed as follows:
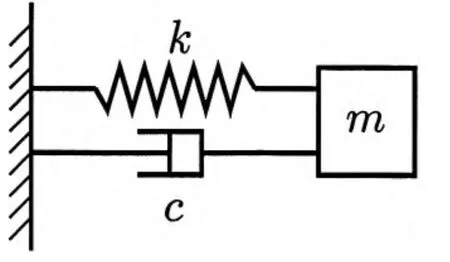
Fig.1 The free vibration of singledegree-of-freedom system

For under-damped system,the solution of Eq.(1)can be easily obtained as:

where the damped vibration frequency
The free vibration response is shown in Fig.2.The oscillation response decays exponentially.The dash line is the envelope of the free vibration response.The damping ratio ζncould be estimated by getting the attenuation parameter ζnωn.For simplification,this method for estimating the damping ratio is called as‘conventional’method compared to the wavelet method.
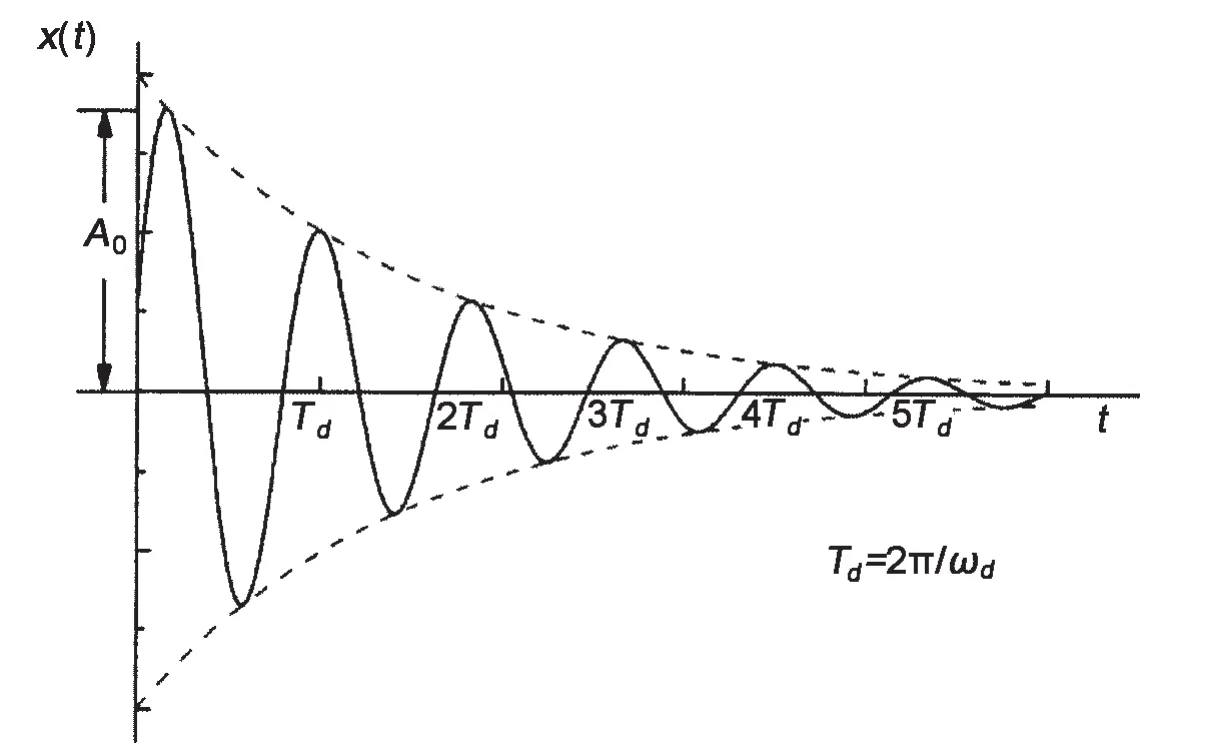
Fig.2 The damping ratio estimation with exponential curve fitting method
An exponential decay is given in Eq.(4):

2 Damping ratio identification based on Continuous Wavelet Transform
The CWT is the inner product or cross correlation of the signal x(t)with the scaled and time shifted wavelet.The time-history signal is supposed as x(t).The CWT of the signal is defined as[17-18]:

where u is the translation parameters,s is the scale/dilation parameters,andis the complex conjugate of the basic wavelet function
Eq.(6)gives the basic wavelet function.The basic wavelet functionis the translated and dilated function of the mother wavelet function ψ (t).

The Gabor wavelet function is used as a mother function and obtained with a modified Gaussian window,as given in the following:

The Gaussian window is written as:

Eq.(5)can be written as Eq.(9),using Eqs.(6),(7)and(8).

where σ is a positive bandwidth parameter and η is the wavelet center frequency.
The signal x(t)can be written as:

For an analytic function which is complex,this is entirely characterized by its real part.The CWT of an analytic function will be twice of the CWT of its real part[19],as given in Eq.(11):

Assuming t1=t-u,Eq.(10)can be expressed as Eq.(12)and Eq.(13)by using Taylor power series expansion close to u.

For a Gaussian distribution,the probability 1 is computed as an integral of the probability density function over the whole region which is shown in Eq.(14).

where the parameter μ is the mean and σ2is the variance.
Eq.(15)can be given using Eqs.(11),(12),(13)and(14).

If the frequency dissipation of the wavelet function is relatively small,then the error termcan be neglected.
The relation between the instantaneous scale s and the instantaneous angular velocity ωd=φ′(u)of the Gabor wavelet function is defined as:

Consequently,Eq.(17)is obtained:

where A(u)is the modulated amplitude.
Considering the CWT is a linear transform,it could be used to estimate damping ratios of multi-mode resonant,as given in the following:

3 Wavelet ridges identification
The time-scale representation of the energy concentration of the CWT is called the ridge.Ridge represents the frequency components of the analyzed signal with a high density of energy which can be expressed as a function of u.Cross-section method,amplitude method and phase method are the three methods to detect the wavelet ridge[20].In this study,the amplitude method is chosen to analyze the signal.
The amplitude method is used to identify the local maxima of the CWT at its response frequency.The procedure of identifying the wavelet ridge is shown as follows:
(1)Transform the time series signal x(t)into the frequency domain to get the ωdby using FFT;
(2)Transform the time series signal x(t)into the time-frequency domain by using the CWT;
(3)Search the local maxima of the CWT results in the vicinity of ωd;
(4)Extract the wavelet ridges by maximizing the modulus of the CWT at each time instant;
(5)Estimate the damping ratio and its corresponding natural frequency from Eq.(17).
4 Method validation with a synthetic multimodal signal
In order to assess the performance of the proposed wavelet-based demodulation method,a test signal is synthesized.The test signal is composed of three exponentially decaying signals with different frequencies and damping ratios.
This signal is composed of three different frequencies(25 Hz,50 Hz and 125 Hz)and their corresponding damping ratios(0.02,0.01 and 0.003).The magnitudes of modal components are randomly selected as 6,6 and 6.The phase angles are chosen arbitrarily.Fig.3 shows the synthetic waveform.Fig.4 shows the corresponding power spectrum of the synthetic signal.
The synthetic signal is given as:
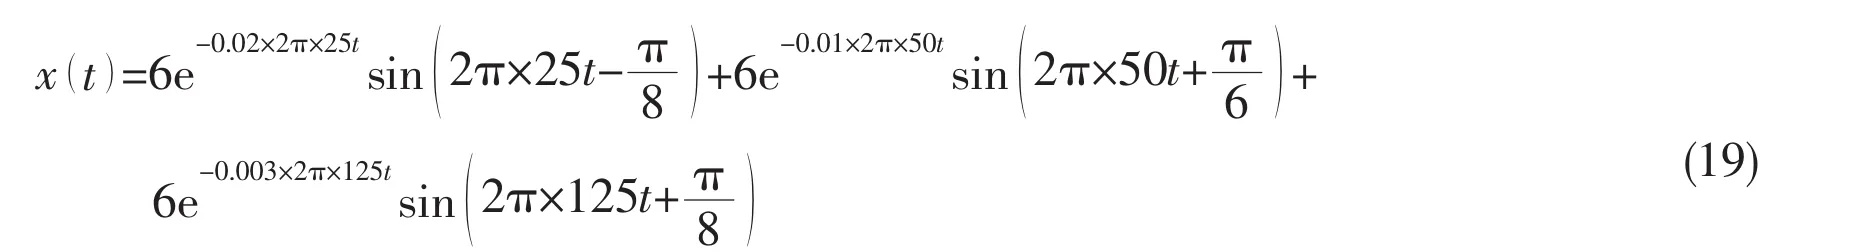
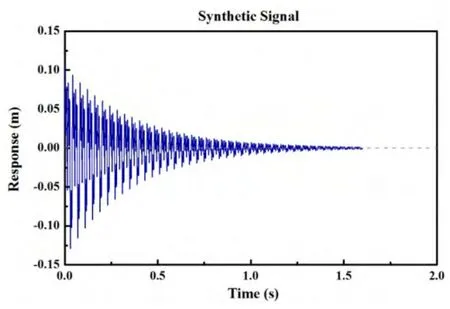
Fig.3 The time series of the synthetic transient signal
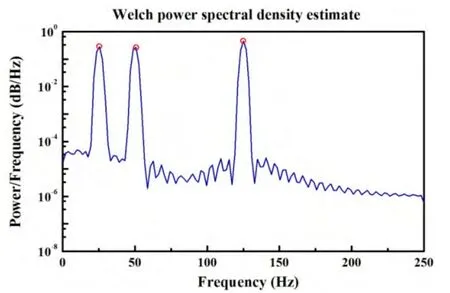
Fig.4 The power spectrum of the synthetic transient signal
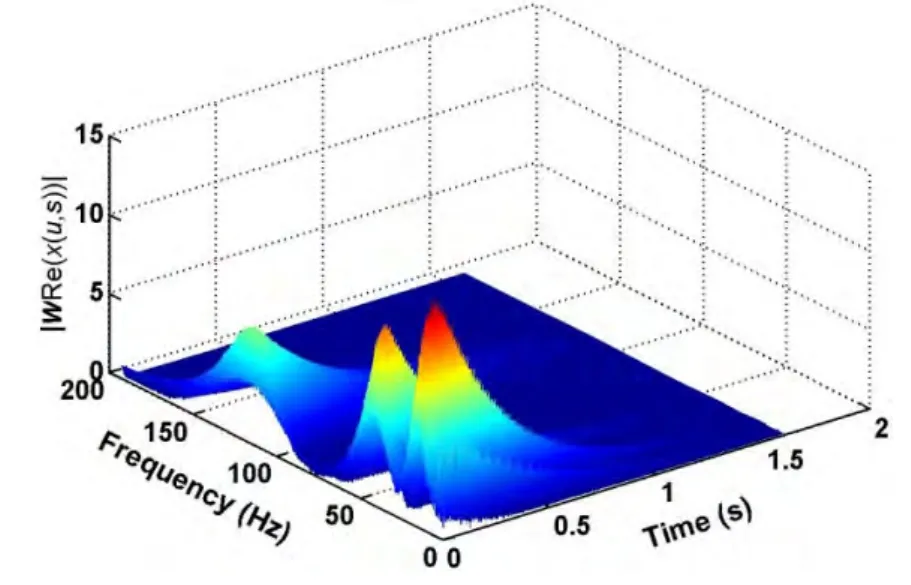
Fig.5 The wavelet plot of the synthetic transient signal
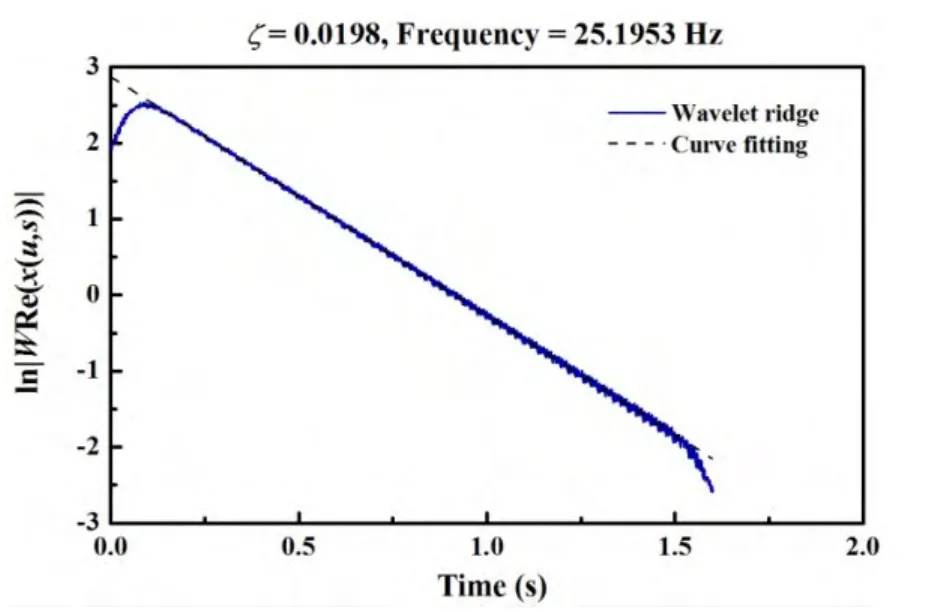
Fig.6 The envelope of the wavelet ridge at the first frequency component
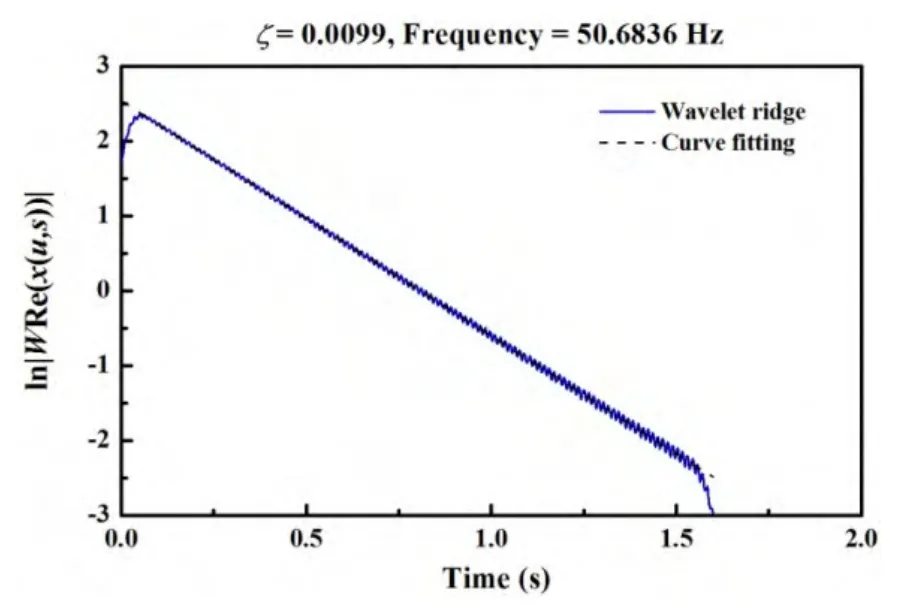
Fig.7 The envelope of the wavelet ridge at the second frequency component
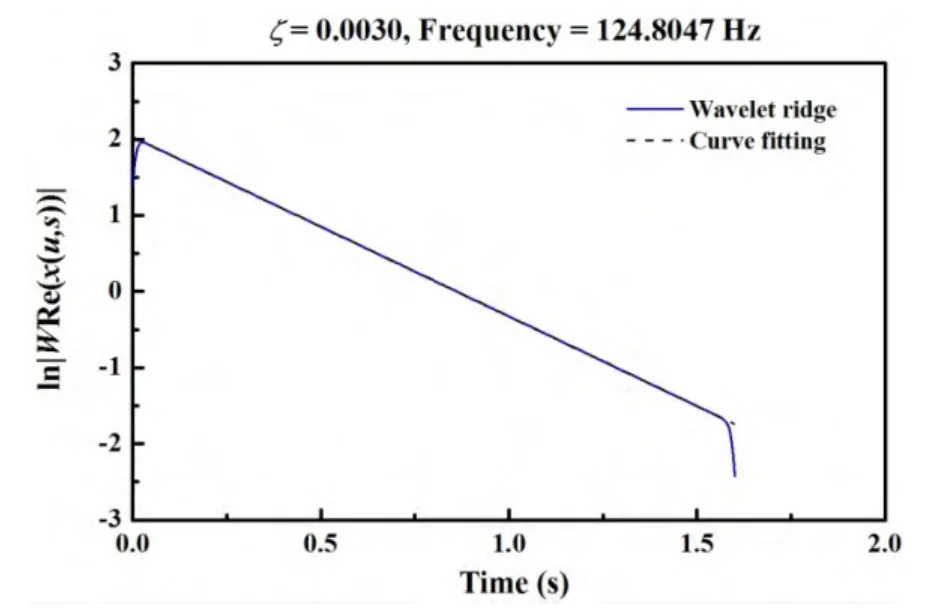
Fig.8 The envelope of the wavelet ridge at the third frequency component
Fig.5 shows the wavelet plot of the signal.In order to identify all three wavelet ridges,a numerical algorithm was developed.The basic idea of the algorithm is to:(1)Find all response frequencies in the spectrum plot(See Fig.4);(2)Then find the corresponding locations of each frequency in the wavelet plot;(3)Near these locations,search the local maxima of the wavelet coefficient;(4)Extract the wavelet ridge from the wavelet plot by a slice parallel to time axis through the local maxima of the wavelet coefficient.
According to Eq.(17),the envelope of the wavelet ridge can be used to estimate the corresponding damping ratio.Figs.(6-8)show the extracted wavelet envelops at three different frequency components.The solid line is the envelope of the wavelet ridge and the dash line is the linear curve to fit the envelope of the wavelet ridge.The summary of estimation results are shown in the Tab.1.The estimation results match with the original data well.
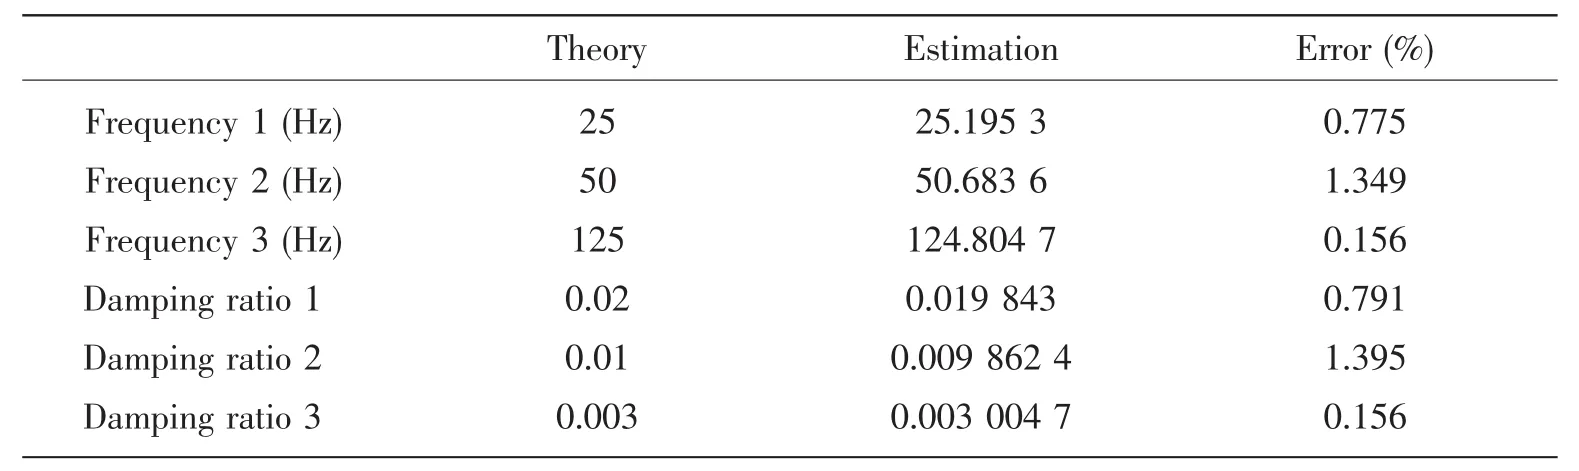
Tab.1 Summary of the estimation results
From Tab.1,it can be seen that the estimation error is below 1.4%,which shows that the CWT method is reliable and accurate.Based on this result,the CWT method is used to identify the response frequency and damping ratio of real VIM data.
5 Description of the experiment
Model tests were carried out in towing tank at Zhejiang Ocean University(ZOU),as shown in Fig.9.Principal dimensions of the towing tank are 130 m×6 m×3 m(L×B×D).The experimental setup was characterized by a scaled model.The scaled model was towed by the towing carriage,together with the instrumentation dedicated to measure the motion of the Truss Spar.
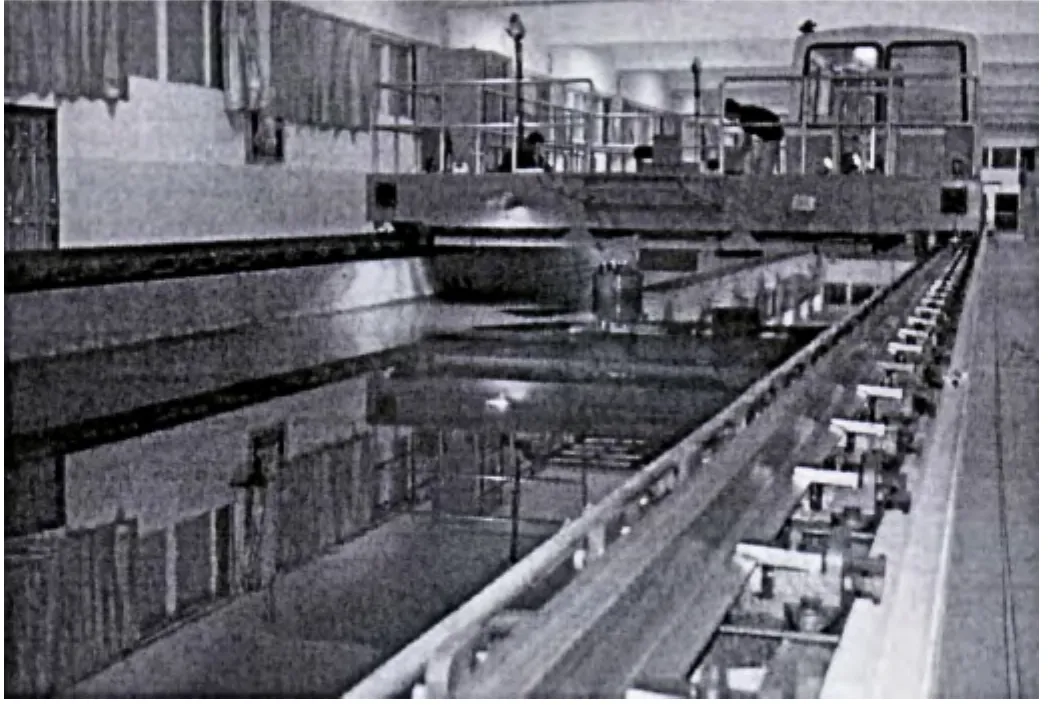
Fig.9 Towing tank of Zhejiang Ocean University(ZOU)
5.1 Model description
The Truss Spar model consists of a square soft tank,a truss section and a hard tank(with or without helical strakes).The scale factor for the Spar was 1:60.Tab.2 shows the main parameters of the Truss Spar.
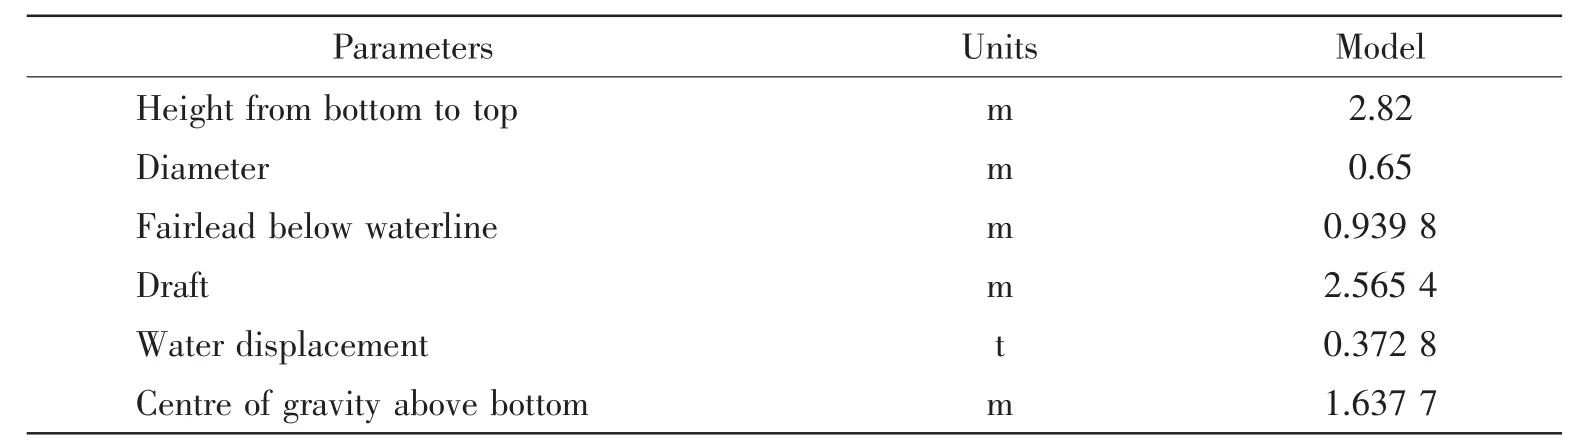
Tab.2 Main parameters of the Truss Spar
The Truss Spar was installed with a simplified mooring system which was composed of three or four mooring lines.Fig.10 shows the model of the Truss Spar with strakes.Figs.11 and 12 show the schematic diagram of the Spar model with three and four lines mooring system,respectively.The mooring line stiffness was 60.56 N/m for each mooring line.Mooring lines were equally spaced.The angles between the mooring lines were 90°and 120°in horizontal plane for four and three lines mooring system,respectively.The mooring lines on the Truss Spar model were attached at the height of the fairleads,which were 0.94 m below the waterline.The mooring points on the towing carriage were above the waterline,which leaded to an upward angle for each mooring line,as shown in Fig.13.
The platform north is defined as the opposite direction of the current direction.Surge is defined as the direction of the Truss Spar towards the current.Sway is defined perpendicular to the direction of the current,as shown in Fig.11 and Fig.12.
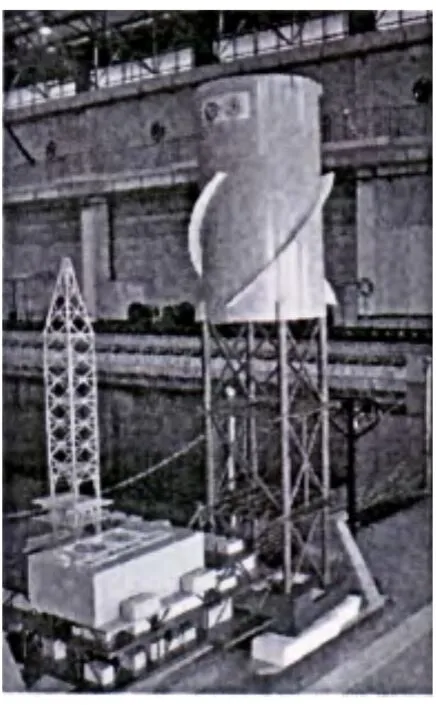
Fig.10 Truss Spar model with strakes
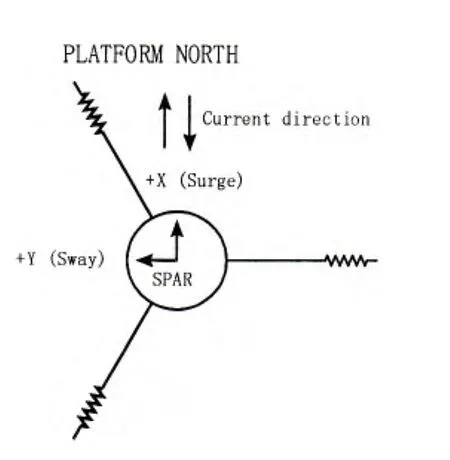
Fig.11 The top view of the Spar model with three lines mooring system
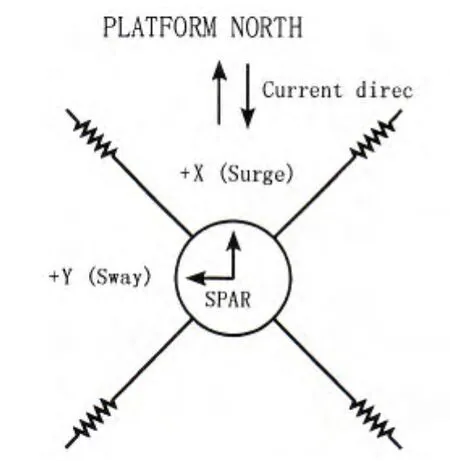
Fig.12 The top view of the Spar model with four lines mooring system
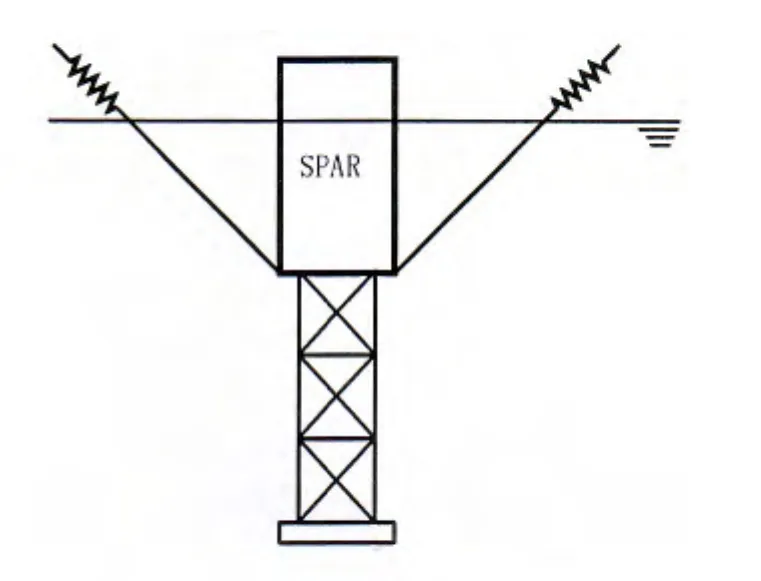
Fig.13 The side view of the Spar model with the simplified mooring system
5.2 Experiment programs
The experiment of the Truss Spar has been conducted to investigate the VIM of the Truss Spar at different current headings and different flow speeds.Specific measurements were used for the purpose of the present study.Still water free-decay tests were emphasized in this paper.The aforementioned method was applied to estimate the natural frequency and the damping ratio of the Truss Spar with the simplified mooring system.
For still water free-decay tests,eight test conditions,namely Truss Spar model with/without strakes and with three/four lines in sway or surge direction,were conducted.The free-decay test of the Truss Spar without strakes and with three lines mooring system in sway direction was selected to demonstrate the estimation of damping ratio based on the CWT method.
The six-degrees-of-freedom motions of the Truss Spar were measured using an infrared optical tracking device.Fig.14 shows a time history of response in sway direction.Solid line is the raw data and dash line is the data filtered by band-pass filter.The upper and lower cutoff frequencies are the 1.5x and 0.5x response frequency.Fig.15 shows the corresponding spectrum in frequency domain and the dash lines are the upper and lower cutoff frequencies.Fig.15 indicates that the response frequency is about 0.036 6 Hz and its corresponding period is 27.3 seconds.
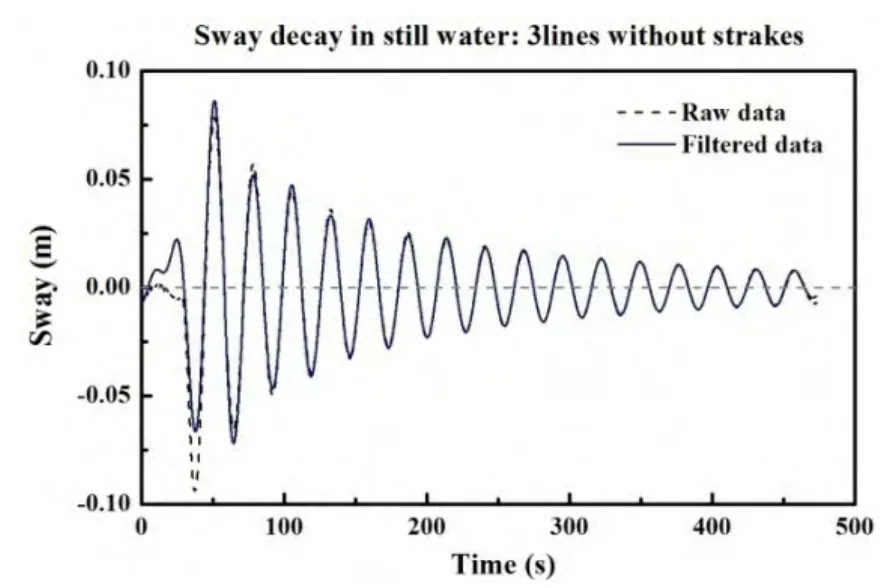
Fig.14 The time series of still water free-decay test of the Spar model without strakes under three lines mooring system in sway direction
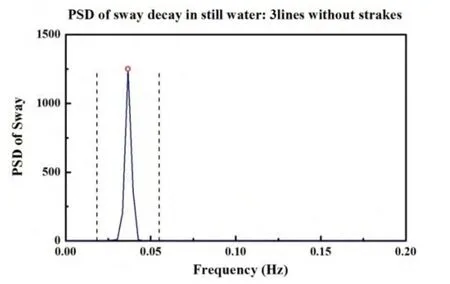
Fig.15 The spectrum of still water free-decay test of the Spar model without strakes under three lines mooring system in sway direction
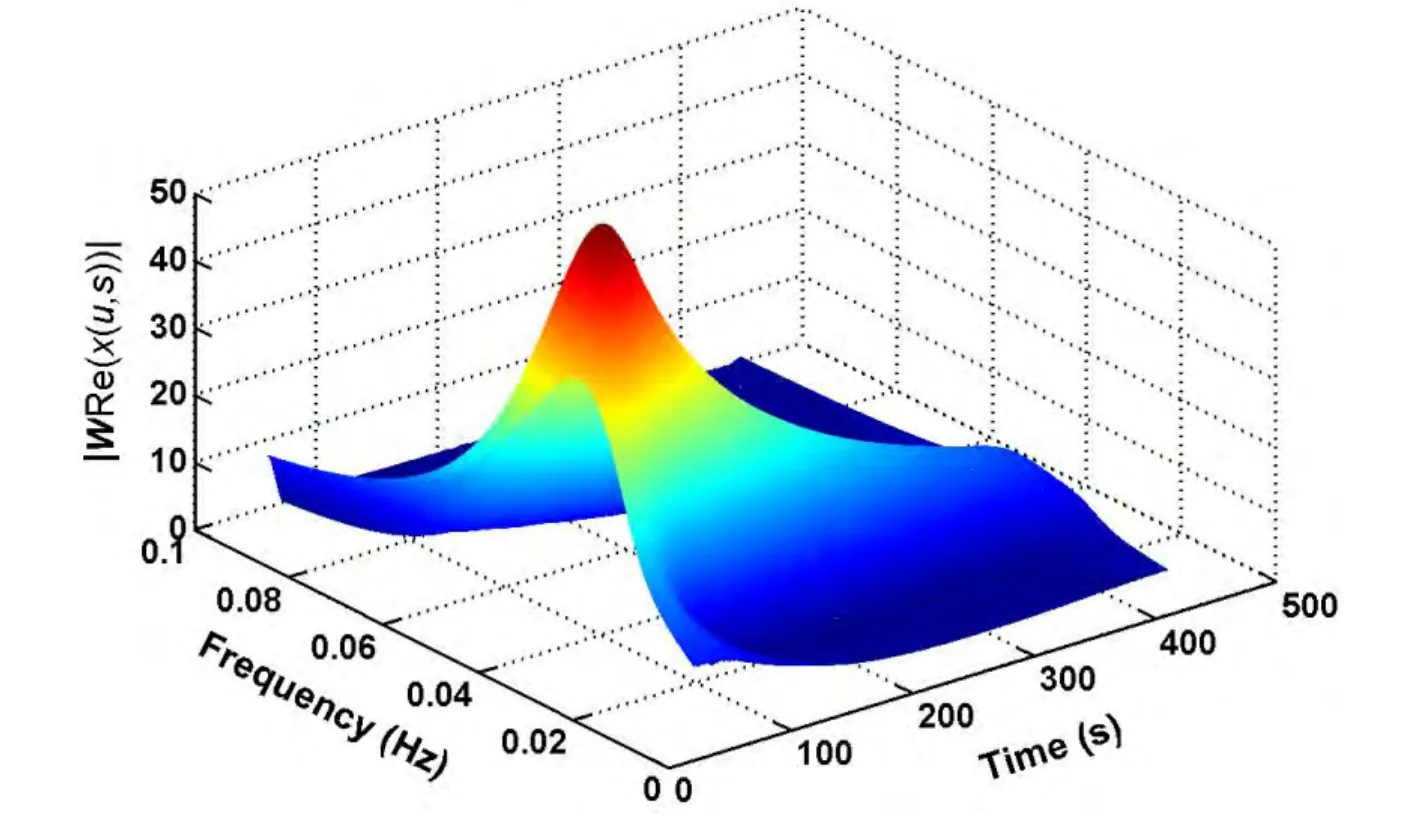
Fig.16 The wavelet plot of still water free-decay test of the Spar model without strakes under three lines mooring system in sway direction
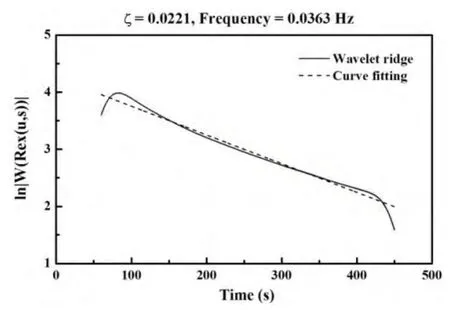
Fig.17 The envelope of the wavelet ridgeat the response frequency for estimating the damping ratio
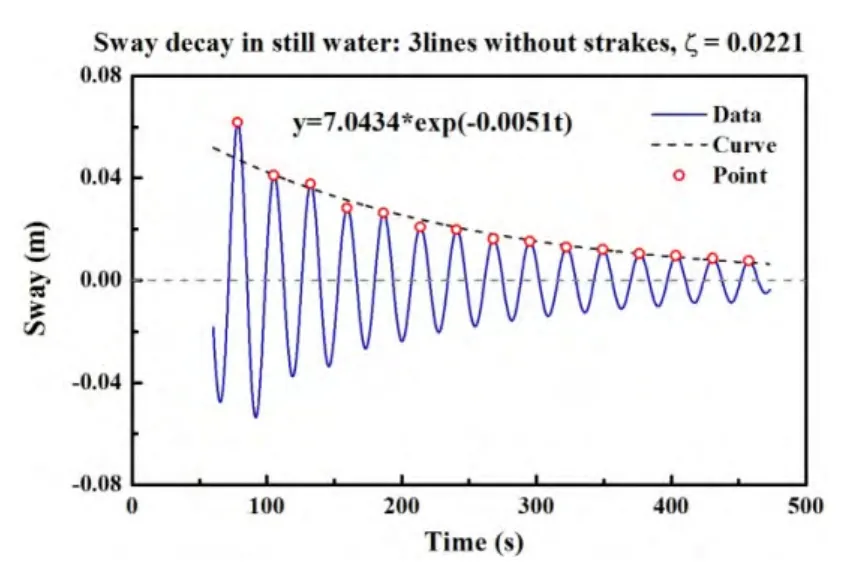
Fig.18 The conventional exponential decay method for estimating the damping ratio
Fig.16 shows the wavelet plot of the measured signal.From the wavelet plot,a wavelet ridge is detected at the frequency 0.036 3 Hz with the developed algorithm.The envelope of the wavelet ridge is displayed as solid line in Fig.17.The dash line is the linear fitting curve for estimating the damping ratio.The estimated damping ratio with the CWT method is 0.022.Fig.18 shows the estimated damping ratio 0.022 with the convention exponential decay method.The solid line is the time series of filtered data and the dash line is the exponential fitting curve for estimating the damping ratio.From the comparison of these two results,it is found that the CWT method is a good tool for estimating the damping ratio.
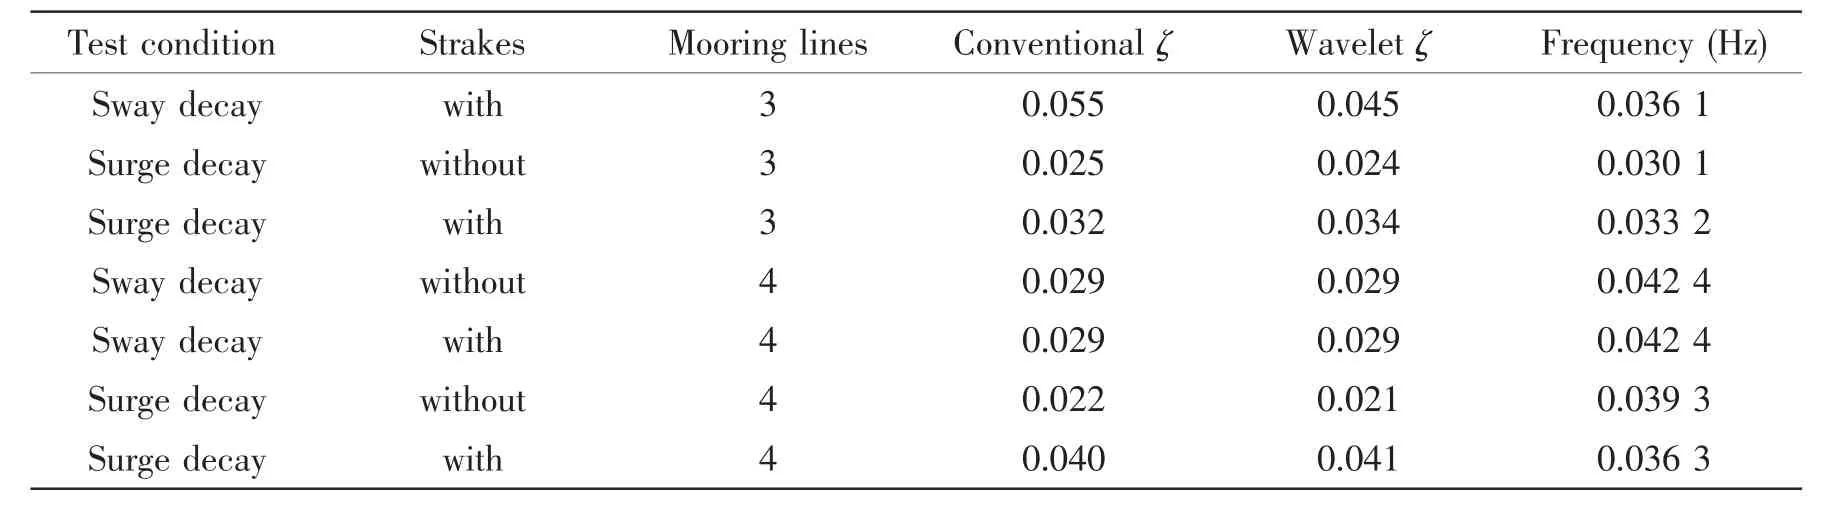
Tab.3 summarizes the estimated frequencies and damping ratios of all eight test conditions.The estimated frequency should consider the added mass effect of the Truss Spar in the still water.Generally,the model with strakes has larger added mass than the model without strakes.The existence of the strakes will cause the lower frequency according to a simple formulawhere m includes both structural mass and added mass.As shown in Tab.3,the results indicate that the frequencies of the Truss Spar with strakes are lower than those of the Truss Spar without strakes,except one test condition.It may be explained by the nonlinearity of the stiffness or other reasons.Due to each mooring line has the same stiffness,the stiffness of four lines mooring system will be larger than the three lines mooring system,which also explains the frequency for four lines mooring system is larger than that for three lines mooring system.It also shows that the damping ratio of the Truss Spar model with strakes is generally greater than that of the model without strakes.It is interpreted as the model with strakes tends to dissipate more energy than the model without strakes in one cycle.However,the effect of mooring system on the damping ratio in still water is not obvious.In this paper,the identification of the damping ratio with the CWT method is based on the assumption of viscous damping model.The reason is that for many weakly damped systems,the viscous damping model is a rather good approximation and most widely used.

Tab.3 The estimated damping ratio in still water
Continue Tab.3
6 Conclusions
This paper applied a CWT method to identify the damping ratio of VIM in ocean engineering.Applications to both analytical and experimental data of free-decay have been made.The results have been compared to the exact values in the case of analytical data and to those estimated by the exponential method,also called‘conventional’method in the case of experimental data.In the case of analytical data,the estimation error is below 1.4%,which shows that the CWT method has sufficient and accurate estimation for both natural frequencies and damping ratio.It also shows that the CWT method is able to process the multi-mode vibration data.In the case of experimental data,eight different free-decay tests were conducted in still water to provide sufficient datasets,including Truss Spar model with/without strakes and with three/four lines in sway or surge direction.The estimated results with CWT method match with the‘conventional’method well.
Acknowledgement
The authors gratefully acknowledge the high-tech ship research projects of the Ministry of Industry and Information Technology‘Research on the key characteristic of Spar design’and National Natural Science Foundation of China(51239007)for supporting this research.
[2]Venugopal M.Damping and response of a flexible cylinder in a current[D].PhD Thesis M.I.T,1996.
[3]Vandiver J K,et al.SHEAR7 V4.5 User Guide[K].Atlantia Offshore Ltd,TX,USA,2007.
[4]Vikestad K,Larsen C M,Vandiver J K.Norwegian deepwater program:Damping of vortex-induced vibrations[C].Offshore Technology Conference,11998,2000.
[5]Nguyen T,Koide M,Yamada S,Takahashi T,Shirakashi M.Influence of mass and damping ratios on VIVs of a cylinder with a downstream counterpart in cruciform arrangement[J].Journal of Fluids and Structures,2012,28:40-55.
[6]Bahmani M H,Akbari M H.Effects of mass and damping ratios on VIV of a circular cylinder[J].Ocean Engineering,2010,37(5-6):511-519.
[7]Klamo J T,Leonard A,Roshko A.The effects of damping on the amplitude and frequency response of a freely vibrating cylinder in cross-flow[J].Journal of Fluids and Structures,2006,22(6-7):845-856.
[8]Lee J H,Bernitsas M M.High-damping,high-Reynolds VIV tests for energy harnessing using the VIVACE converter[J].Ocean Engineering,2011,38(16):1697-1712.
[9]Boltežar M,SlaviJ.Enhancements to the continuous wavelet transform for damping identifications on short signals[J].Mechanical Systems and Signal Processing,2004,18(5):1065-1076.
[10]Ulker-Kaustell M,Karoumi R.Application of the continuous wavelet transform on the free vibrations of a steel-concrete composite railway bridge[J].Engineering Structures,2011,33:911-919.
[11]Magalhães F,Cunha Á,Caetano E,Brincker R.Damping estimation using free decays and ambient vibration tests[J].Mechanical Systems and Signal Processing,2010,24(5):1274-1290.
[12]Haase M,Widjajakusuma J.Damage identification based on ridges and maxima lines of the wavelet transform[J].International Journal of Engineering Science,2003,41(13-14):1423-1443.
[13]Panet M,Jezequel L.Dissipative unimodal structural damping identification[J].International Journal of Non-Linear Mechanics,2000,35(5):795-815.
[14]Yan Z H,Miyamoto A,Jiang Z W,Liu X L.An overall theoretical description of frequency slice wavelet transform[J].Mechanical Systems and Signal Processing,2010,24(2):491-507.
[15]Yan Z H,Miyamoto A,Jiang Z W.Frequency slice wavelet transform for transient vibration response analysis[J].Mechanical Systems and Signal Processing,2009,23(5):1474-1489.
[16]Tan J B,Liu Y,Wang L,Yang W G.Identification of modal parameters of a system with high damping and closely spaced modes by combining continuous wavelet transform with pattern search[J].Mechanical Systems and Signal Processing,2008,22(5):1055-1060.
[17]Mallat S.A wavelet tour of signal processing[M].2nd Edition,Academic Press,New York,1999.
[18]Hur K,Santoso S.Estimation of system damping parameters using analytic wavelet transforms[J].IEEE Transactions on Power Delivery,2009,24(3):1302-1309.
[19]Dien N P.Damping identification using the wavelet-based demodulation method:Application to gearbox signals[J].Technische Mechanik,2008,28(3-4):324-333.
[21]Park S Y,Kang Y J,Kim S H.Identification of beat characteristics and damping ratios of bell type structures using wavelet transform[J].Journal of Sound and Vibration,2009,326(1-2):367-382.

- 船舶力学的其它文章
- Study on Vortex Induced Characteristics of Four Square Columns at Different Spacing Ratio
- Roll Motion Prediction of PSV with Anti-rolling Tank Based on RANS and Nonlinear Dynamic Method
- Numerical Simulation of Strong Shock Wave Impacting on Water-elastic Solid Interface by Essentially Modified Ghost Fluid Method
- A Double-layer Depth-averaged Boussinesq Model for Water Wave
- Fatigue Strength Evaluation of Transverse Fillet Welded Joints Based on Notch Stress Strength Theory
- Low Noise Collocation on Fluid Pipeline System