Phenotypic Traits and Genetic Diversity of Erianthus arundinaceum Germplasm
Chaohua XU, Xin LU, Li MA, Xinlong LIU, Hongbo LIU, Huosheng SU, Xiuqin LIN,Qing CAI,3*
1. Sugarcane Research Institute, Yunnan Academy of Agricultural Sciences, Kaiyuan 661699, China;
2. Yunnan Key Laboratory of Sugarcane Genetic Improvement, Kaiyuan 661699, China;
3. Biotechnology & Genetic Resources Institute, Yunnan Academy of Agriculture Sciences, Kunming 650223, China
Sugarcane (Saccharum L) as the major sugar crop contributes to 90% of sugar production in China[1]. At present, sugarcane varieties worldwide are mostly the hybrids of tropical species Saccharum officinarum, S. spontaneum and Indian species S. barberi, so they have similar genetic background,which limits the breeding and promotion of new varieties[2].Erianthus arundinaceum, a species belonging to an allied genus of sugarcane, widely distributed in Yunnan, Sichuan, Guizhou,Fujian,Hainan and Guangxi and other provinces of China, has excellent traits, such as good tillering ability,adaptability, drought tolerance and abundant ecological types[3-4]. In recent years increasing attention has been paid to the collection of E.arundinaceum resources[5-8], and their genetic diversity had been evaluated through morphological markers[9], cytological markers[10-12], protein markers[13-14]and mo-lecular markers[15-17],etc.Besides, extensive studies have been carried out on their tolerance to cold[18], drought[19-21]and disease[22]. In this study, the genetic diversity of phenotypic traits of 162 accessions of E. arundinaceum fromnine provinces of China was investigated to explore their genetic background,with an attempt to provide theoretical references for resource collection , heterosis application and development of excellent genes of sugarcane germplasm.
Materials and Methods
Materials
The 162 accessions of E.arundinaceum were preserved in the National Nursery of Sugarcane Germplasm Resources, among which, 74 samples were collected from Yunnan,15 from Fujian, 19 from Guizhou, 18 from Hainan,14 from Sichuan,10 from Jiangxi, 4 from Guangdong, 4 from Guangxi and 4 from Zhejiang.
Measurement items and methods
The experiment was conducted at the National Nursery of Sugarcane Germplasm Resources in November 2008 . All the 162 accessions of E. arundinaceum were separately grown in cement frames (0.8 m in diameter and depth),spacing 1 m to each other. Six normal plants from each accession were selected and surveyed for five quantitative traits and 21 qualitative traits. The five quantitative traits were lamina length,lamina width,stalk length, stalk diameter and brix,and the 21 qualitative traits were aerial root, stalk shape, pipe, pith, internode shape,internode color unexposed and exposed, growth ring shape, root primordial, bud shape, bud placement,sheath detached from culm, hair group,shape of inner auricle,shape of outer auricle, angle of lamina to culm,lamina colour, wax band, corky patch and growth crack. From which, ten of the phenotypic traits with diversity:internode color unexposed, internode color exposed,growth ring shape,root primordial,bud shape,bud placement,hair group, angle of lamina to culm,lamina colour, wax band were screened out and analyzed for their genetic diversity. All the data were standardized according to the literatures[23]and[24]. The quantitative traits were grouped into six levels for cluster analysis together with the qualitative traits.
The genetic diversity of the populations was measured by Shannon-Wiener index which was calculated with the formula as follows:
Wherein, H’ reflects the genetic diversity of the populations; Piis the frequency of the i-th code value of a quality trait[25].The total genetic diversity(Ht),the genetic diversity within populations(Hs),genetic divergence coefficient (Gst) and gene flow value (Nm)were all calculated using the formulas described in literature[26].
Data analysis
Spss17.0 software was adopted to analyze the coefficient of variations(CV) and degree of dispersion of the five quantitative traits. Excel and NTSYSpc2.1 software were used to calculate the phenotypic frequencies of qualitative traits, and the Nei’s genetic distance between the populations from different provinces. Finally, a dendrogram was constructed from Nei’s genetic distance based on UPGMA(weighted pair group method using arithmetic averages).
Results and Analysis
Coefficient of variation in the quantitative traits
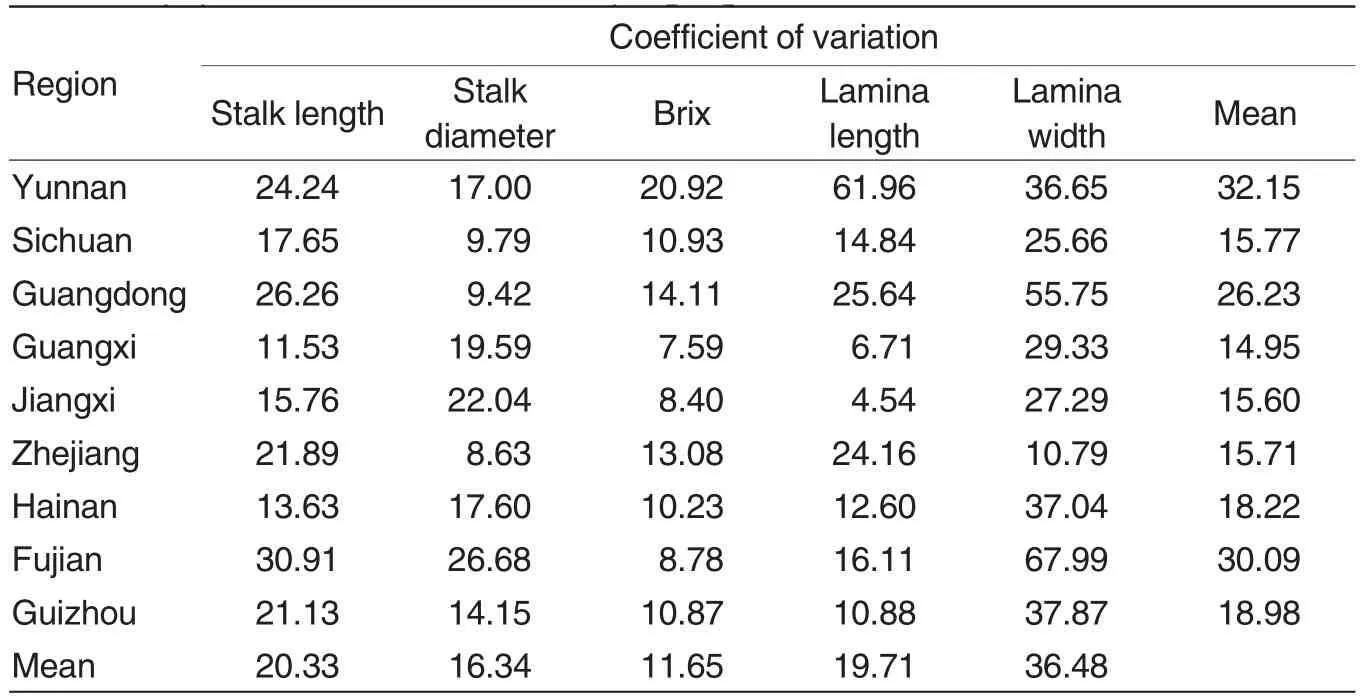
As shown in Table 1, among the five quantitative traits of the 162 E. arundinaceum accessions, the average coefficient of variation for lamina width was the largest (36.48%),followed by that for stalk length(20.33%)and lamina length (19.71%), while the coefficient of variation for brix(11.65%)was the smallest. Therefore, quantitative traits should be considered as an important index for the assessment of E. arundinaceum resources.
Besides, by comparing the variation of the five quantitative traits for the E. arundinaceum samples from different regions,it was found that the population from Fujian had the largest variation coefficient of stalk length(30.91%), while the population from Guangxi had the smallest one(11.53%); the population from Fujian also had the largest variation coefficient of stalk diameter (26.68%), while the population Zhejiang had the smallest one (8.63%); the largest variation coefficient of brix (20.92%)was found in population from Yunnan, and the smallest (7.59%) in population from Guangxi;the largest coefficient of variation for stalk length (61.96%) was found in population from Yunnan, and the smallest (4.54% ) in population from Jiangxi; the largest coefficient of variation for stalk width (67.99%)was found in population from Fujian, and the smallest (10.97%) in population from Zhejiang.
The coefficients of variation for the five quantitative traits of the samples in each province were averaged,and the resulting means ranged from 14.95%to 32.14,as shown in Table 1.Among them, the mean in Yunnan was the largest (32.15%), followed by that Fujian (30.09%)and Guangdong(26.23%), while that in Guangxi was the smallest(14.95%).

Table 1 Coefficients of variance of quantitative traits for Erianthus arundinaceum populations from different sampling regions %
Genetic diversity in quality traits
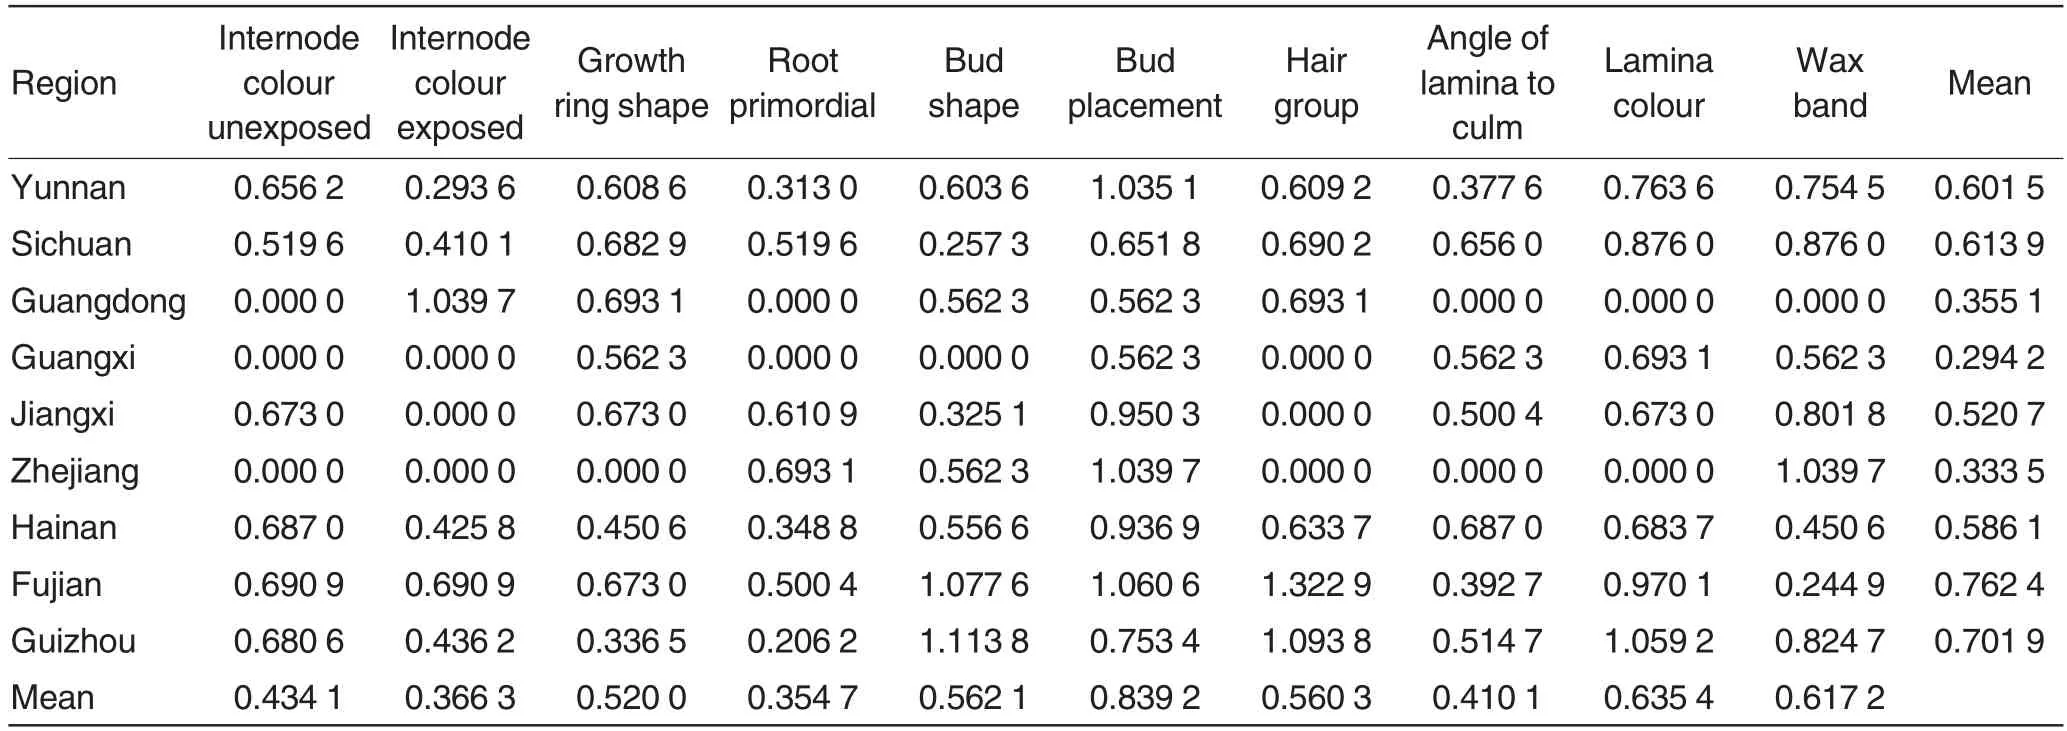
As could be seen from Table 2,the Shannon-Wiener indices for the 10 qualitative traits of the E. arundinaceum samples from each province were averaged, and the resulting means ranged from 0.294 2 0.762 4,which were close to that of the decaploids of Saccharum spontaneum,but lower than the Shannon-Wienerindices of the sugarcane germplasm[27-28].Among the nine provinces,the Shannon-Wiener index in Fujian was the largest (0.762 4), followed by that in Guizhou(0.701 9),Sichuan(0.613 9)and Yunnan Province (0.601 5), while that in Guangxi was the lowest(0.294 2).In addition, by comparing the Shannon-Wiener indices of the 10 qualitative traits of the 162 E. arundinaceum accessions, it was found that bud placement had the largest Shannon-Wiener index (0.839 2), followed by lamina colour (0.635 4), and root primordial had the smallest diversity index(0.354 7).

Table 2 Shannon-Wiener index of qualitative trait for Erianthus arundinaceum populations from different sampling regions
Correlations of quantitative traits with latitude and altitude
It could be concluded from Table 3 that altitude had an extremely significant negative correlation with brix,but no significant correlations with stalk length, stalk diameter, lamina length and lamina width of E. arundinaceum samples, indicating that brix deceased with the increase in altitude. Latitude had an extremely significant negative correlation with stalk length, but no significant correlations with stalk diameter, lamina length, lamina width and brix of E.arundinaceum samples, indicating that their stalk length increased with the increase of latitude. Therefore, E. arundinaceum resources with large plant and high brix could be easily found in low-latitude and low-altitude areas, and those with short plant and low brix in high-latitude and high-altitude areas.
Genetic diversity of E. arundinaceum populations from different provinces
The genetic diversity index for the quantitative traits within E. arundinaceum populations from the nine provinces was 0.629 6, and the total genetic diversity index was 0.725 4.The genetic diversity index for their quality traits within the populations was 0.177 1, and the total genetic diversity was 0.232 8. The results suggested that the quantitative traits of these E. arundinaceum resources had richer genetic diversity than their quality traits. For quality traits, the genetic divergence coefficient was 23.95% and gene flow was 1.587 9;for quantitative traits, the genetic divergence coefficient was 13.20%, and the gene flow was 3.287 8, suggesting that there was active genetic exchanges and no obvious genetic divergence among the E. arundinaceum populations from different regions.
Cluster analysis of the E. arundinaceum populations from different regions
The Nei’s genetic distances between the E. arundinaceum populations from different regions were relative small, ranging from 0.083 4 to 0.513 7, with an average value of 0.227 2,indicating a low degree of genetic divergence among the populations. The genetic distance between the populations from Jiangxi and Hainan (0.083 4) was the smallest,and that between the populations from Sichuan and Jiangxi (0.097 5)was the second smallest; the genetic distance between the populations from Guangxi and Zhejiang was the largest (0.513 7),followed by that between the populations from Zhejiang and Hainan(0.497 8).
As shown in Fig.1, the E. arundinaceum population from Zhejiang was most distantly related to the populations from other regions, followed by that from Guangdong and Guangxi.The populations from Jiangxi and Hainan were most closely related and clustered together, indicating that they had the most similar genetic background, and then they clustered with the populations from Sichuan, Fujian,Guizhou and Yunnan. All the results showed that the phenotypes of the E. arundinaceum samples in this study had a certain relationship with their geographical locations.

Table 3 Correlation coefficients between quantitative traits and latitude or altitude

Table 4 Genetic structure of Erianthus arundinaceum populations from different sampling regions
Conclusion and Discussion
Liu et al.[28]studied the genetic diversity of 1 160 sugarcane accessions from 20 regions of 13 countries, and provided useful references for the selection of parental materials, hybrid combinations and construction of core collection for sugarcane breeding.The study of Xiao et al.[29]which was about genetic diversity in morphological traits of Miscanthus floridulus provided theoretical information for the breeding and genetic improvement of Chinese M. floridulus resources. The study of Liu et al.[27]discovered the diverse Saccharum spontaneum resources in China. Our findings proved that abundant genetic variation existed in the morphological traits of E.arundinaceum populations from different regions. The variation coefficients of the five morphological traits (such as stalk length and stalk diameter) among the E. arundinaceum populations from the nine provinces ranged from 1.65% to 36.48%, with an average of 20.90%,indicating the great genetic differences and abundant genetic diversity of them.Besides,the quantitative traits of the E. arundinaceum populations shared significant correlations with latitude and altitude. Among them, brix had an extremely significant negative correlation with altitude, while stalk length had an extremely significant negative correlation with latitude. UPGMA cluster analysis showed that the morphological traits of the E. arundinaceum populations had certain relationship with their location, indicating that they were affected by geographical environments.
The genetic divergence coefficient for quality traits among the E. arundinaceum populations from different regions was 23.95%, indicating that only 23.95% of the genetic variation was caused by their geographical locations, while 76.05% of the variation was retained within the populations. The genetic divergence coefficient for quantitative traits among the E. arundinaceum populations was 13.20%, indicating that 86.8% of the variation was retained within populations. In summary, extensive genetic exchanges existed in both the quality and quantitative traits of these E. arundinaceum populations, while the gene flow of quantitative traits was over two folds of qualitative traits, indicating that there should be more emphasis on quantitative traits than quality traits in resource evaluation of E. arundinaceum.The large gene flow also indicated a low degree of genetic divergence, which may be related to the propagation and selection of E. arundinaceum under natural environmental conditions[30].
[1]LI YR(李杨瑞).Modern sugarcane(现代甘蔗学)[M]. Beijing:China Agriculture Press(北京:中国农业出版),2010.
[2]PENG SG(彭绍光).Sugarcane breeding(甘蔗育种学)[M]. Beijing:China Agriculture Press (北京:中国农业出版),1990:160.
[3]Editorial Committee of Flora of China of Chinese Academy of Sciense(中国科学院中国植物志编辑委员会).Flora of China(10)(中国植物志)[M]. Beijing:China Agriculture Press(北京:中国农业出版),1997.
[4]LIANG XZ (梁绪振),YAN JJ (鄢家俊),BAI SQ (白史且), et al. Variations of important morphological features of Erianthus arundinaceumg-ermplasms(斑茅种质资源形态性状的变异研究)[J].Pratacultural Science(草业科学), 2011,28(7):1307-1314.
[5]DAO ZX (刀志学), YAN JJ (鄢家俊),ZHANG JB(张建波),et al.Investigation and collection of wild Erianthus arundinaceum germplasm resources (斑茅野生种质资源的考察与收集)[J].Journal of Plant Genetic Resources(植物遗传资源学报),2013,14(5),51-55.
[6]NAIR NV, SOMARAJAN KG. Diversity of Saccharum germplasm in Kerala, India[J].Plant Genet Resources Newsletter,2003,135:40-43.
[7]VIGNESWARAN M,NAIR NV.Diversity in Saccharum germplasm in Arunachal Pradesh, India [J]. Plant Genetic Resources,2004,140:57-61.
[8]BERDING N, KOIKE H. Germplasm conservation of the Saccharum complex:a collection from the Indonesian archipelago [J]. Hawaiian Planters Records,1980,59(7):87-176.
[9]XIAO FH. Comparison between the E. arundinaceus and some species under Saccharum and Erianthus on the plant morphology and isozyme[J].Sugarcane1,994,1(1):22-27.
[10]DENG ZH(邓祖湖),LI YC(李玉婵),LIU WR (刘文荣),et al.Chromosome genetic analysis for the hybrid progeny of S.officinarum L.and Erianthus arundinaceum (甘蔗和斑茅远缘杂交后代的染色体遗传分析)[J]. 热带作物学报,2007,28(3):63-67.
[11]NAIR NV,PRANEETHA M.Cyto-morphological studies on three Erianthus arundinaceus (RetZ) Jeswiet accessions from the Andaman Nicobar Islands, India [J]. Cytologyia, 2006, 71:107-109.
[12]TAGANE S, TAGANE M Y, PONRAGDEE W,et al.Cytological study of Erianthus procerus and E. arundinaceus (Gramineas) in Thailand [J].Cytologyia,2011,76:171-175.
[13]DENG HH(邓海华),LIAO ZZ(廖兆周),LI QW (李奇伟), et al. Breeding and isozyme marker assisted selection of F2hybrids from Saccharum spp.×Erianthus arundinaceus(斑茅F2杂种选育与同工酶标记辅助选择)[J].Sugarcane and Canesugar (甘蔗糖业), 2002,(1):1-5.
[14]LIU SM(刘少谋),FU C(付成),WU QW(吴其卫),et al.Breeding and selection of BC1 of Erianthus arundinaceus at Hainan Sugarcane Breeding Station(斑茅杂种甘蔗BC1 选育研究)[J].Chinese Journal of Tropical Agriculture(热带农业科学),2007,27(3):9-12.
[15]ZHANG MQ, HONG YX, LI QW, et al.Molecular polymorphic analysis for the germplasms of Erianthus arundinaceus collected in China [J]. Journal of Plant Resources and Environment,2004,13(1):1-6.
[16]YANG RZ(杨荣仲),TAN YM(谭裕模),HE WZ (何为中),et al.RAPD application in the identification of hybrid progeny Erianthus arundinaceus(RAPD 在鉴定斑茅杂种后代中的应用)[J]. Guangxi Sugarcane & Canesugar(广西蔗糖),2003(2):8-12.
[17]WU SJ (吴水金), PAN SM (潘世明),CHEN YQ (陈义强),et al.ITS identification of genuine hybrids from the cross of Saccharum and E. arundinaceum (甘蔗斑茅属间远缘杂种真实性的ITS 鉴定)[J]. Fujian Sugarcane(福建甘蔗),2008,(8):13-15.
[18]RAM B,SREENIVASAN TV,SAHI BK,et al. Introgression of low temperature tolerance and red rot resistance from Erianthus in sugarcane [J].Euphytica,2001,122(1):145-153.
[19]ZHANG MQ (张木清), PAN J (潘婕),WENG XY (翁笑艳),et al.Analysis of the difference of drought tolerance in Saccharum officinarum and Erianthus arundinaceum Retz (甘蔗与斑茅抗旱生理生化差异性分析)[J]. Chinese Journal of Tropical Crops (热带作物学报),2004,25(2):50-54.
[20]CHEN YQ ( 陈义强). Screening of drought-resistant Saccharum officinarum germplasm and drought resistance of Erianthus arundinaceum hybrid(甘蔗抗旱种质资源的筛选及斑茅杂种后代抗旱性分析)[D].Fuzhou:Fujian Agriculture and Forestry University(福州:福建农林大学),2005.
[21]LIU WR(刘文荣),ZHANG JS(张积森),RAO J (饶进), et al. Construction and analysis of suppression subtractive hybridization library for Saccharum arundinaceum Retz. leaves exposed to drought stress(干旱胁迫下斑茅消减文库的构建及分析)[J].Acta Agronomica Sinica (作物学报), 2007, 33(6):961-967.
[22]PIPERIDIS G, CHRISTOPHER MJ,CARROLL BJ, et al. Molecular contribution to selection of intergeneric hybrids between sugarcane and the wild species Erianthus arundinaceus [J].Genome,2000,43(6):1033-1037.
[23]CAI Q (蔡青),FAN YH (范源洪).Descriptors and data standard for sugarcane(Saccharum officinarum L.)(甘蔗种质资源描述规范和数据标准)[S].Beijing:China Agriculture Press(北京:中国农业出版),2006:7-40.
[24]CAI Q(蔡青),FAN YH(范源洪).Technical code for evaluating germplasm resources—sugarcane (农作物种质资源鉴定技术规程-甘蔗)[S]. Beijing:China Agriculture Press (北京:中国农业出版),2008:1-4.
[25]ZHANG HP(张海平),FANG WM(方伟民),CHEN FD (陈发棣),et al.Investigation on the morphological diversity of taxa in genus Nymphaea (部分睡莲属植物形态性状的多样性分析)[J].Journal of Nanjing Agricultural University(南京农业大学学报), 2009, 32(4):47-52.
[26]WANG JL (王建林), DAN B (旦巴),CHENG HH (成海宏), et al. AFLP analysis on genetic diversity of wild and cultivated rapeseed(B.campestris and B.juncea)in Tibet (西藏野生油菜和栽培油菜遗传多样性的AFLP 分析)[J]. 中国油料作物学报, 2008, 30(1):10-16.
[27]LIU XL(刘新龙),SU HS(苏火山),YING XM(应雄美),et al.Phenotypic correlation and genetic diversity of decaploids of Saccharum spontaneum (中国十倍体割手密资源的表型相关性及遗传多样性)[J].Journal of Hunan Agricultural University(Natural Sciences)(湖南农业大学学报:自然科学版), 2012, 38(6):575-579.
[28]LIU XL(刘新龙),CAI Q(蔡青),WU CW(吴才文),et al. Phenotypic diversity of sugarcane variety germplasm (甘蔗品种资源的表型遗传多样性)[J]. 生物多样性,2010,18(1):37-43.
[29]XIAO L (肖亮),JIANG JX (蒋建雄),YI ZL(易自力),et al.Study on phenotypic diversity of Miscanthus floridulus(五节芒种质资源的表型多样性分析)[J].Journal of Hunan Agricultural University (Natural Sciences)(湖南农业大学学报:自然科学版), 2013, 39 (2):151-154.
[30]LIU HF,GAO YB,WANG D,et al.Genetic differentiation in eight populations of Leymus chinensis in Inner Mongolia Steppe[J].Acta Ecologica Sinica,2004,24(3):423-431.
 Agricultural Science & Technology2015年1期
- Agricultural Science & Technology的其它文章
- Prokaryotic Expression and Purification of DsMAPK from Dunaliella salina
- Study on the Countermeasures of Drought Control and Disaster Release Based on Humanland Relationship— ——A Case Study in Yunnan Province
- Effect of Direct-seeding with Non-flooding and Wheat Residue Returning Patterns on Greenhouse Gas Emission from Rice Paddy
- Growth and Quality of Chinese Kale Grown Under Different LEDs
- Yield and Quality Performance of Japonica Rice Varieties Grown in the Late Season in a Double Rice Cropping System of China
- Effects of Soaking Seeds with Different Solutions on the Growth and Yield of Rice
