Baotou Becomes Pilot City for Transition & Upgrading of the National Rare Earth Industry
Baotou Becomes Pilot City for Transition & Upgrading of the National Rare Earth Industry
The Ministry of Industry and Information Technology and the Ministry of Finance recently approved transition & upgrading pilot plan for Baotou City rare earth industry, Baotou City has been identified as pilot city for transition & upgrading of the national rare earth industry.
Within 3 years since 2015, Baotou City will receive 33 rare earth projects, plus rare earth transition & upgrading fund support totaling nearly 1 billion yuan, by the end of 2017, efforts will be made to strive to develop Baotou City into the biggest rare earth new material, terminal application technology R&D and industrialization demonstration base in China.
According to requirements in the “Notice on Carrying out Pilot Work for Rare Earth Industry Transition & Upgrading” by the MIIT and the Ministry of Finance, Baotou Municipal Government organized and compiled the “Pilot Implementation Plan for Baotou City Rare Earth Industry Transition & Upgrading” (The “Plan”), currently it is studying and formulating relevant supporting documents and detailed rules for implementation. The Plan proposed to, by focusing on propelling big group construction, accelerating transition & upgrading of key enterprises, and cultivating new application enterprises as key work tasks, continually strengthen organization and leadership, improve guarantee measures such as fund support, and project approval, within 3 years lift the domestic market share of Baotou City’s high-end rare earth magnetic materials, hydrogen storage materials, and special alloy from 10%, 12%, 15% in 2014 to above 30%, 30%, and 40% respectively, fulfill domestic production of high end rare earth polishing solutions, fulfill industrialization of rare earth magnetic refrigeration material and equipment, fulfill large scale production of rare earth eco-friendly pigments, and thermal stabilizers etc, technological indicators of relevant product should reach or surpass domestic advanced levels.
Unit: metric ton
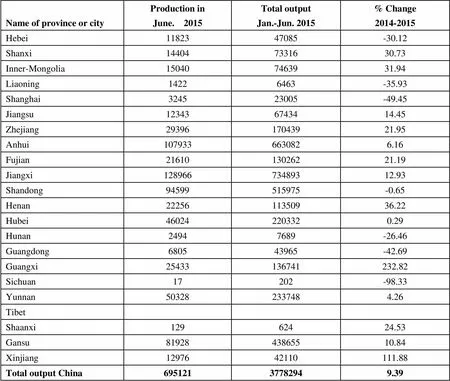
Name of province or cityProduction inJune. 2015Total outputJan.-Jun. 2015% Change2014-2015 Hebei1182347085-30.12 Shanxi144047331630.73 Inner-Mongolia150407463931.94 Liaoning14226463-35.93 Shanghai324523005-49.45 Jiangsu123436743414.45 Zhejiang2939617043921.95 Anhui1079336630826.16 Fujian2161013026221.19 Jiangxi12896673489312.93 Shandong94599515975-0.65 Henan2225611350936.22 Hubei460242203320.29 Hunan24947689-26.46 Guangdong680543965-42.69 Guangxi25433136741232.82 Sichuan17202-98.33 Yunnan503282337484.26 Tibet Shaanxi12962424.53 Gansu8192843865510.84 Xinjiang1297642110111.88 Total output China69512137782949.39
Unit: metric ton

Name of province or cityProduction inJune. 2015Total outputJan.-Jun. 2015% Change2014-2015 Zhejiang185821-16.71 Jiangxi17281310049.91 Hunan327618057-7.07 Guangxi20076257-16.03 Yunnan721539853-6.88 Total output China1454878988-1.54
Unit: metric ton
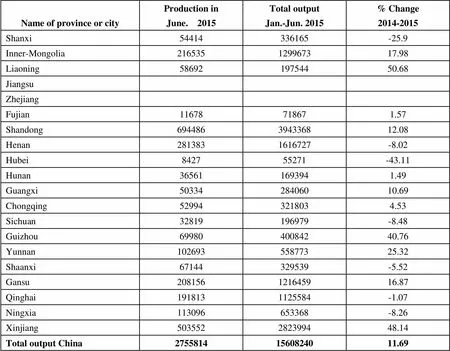
Name of province or cityProduction inJune. 2015Total outputJan.-Jun. 2015% Change2014-2015 Shanxi54414336165-25.9 Inner-Mongolia216535129967317.98 Liaoning5869219754450.68 Jiangsu Zhejiang Fujian11678718671.57 Shandong694486394336812.08 Henan2813831616727-8.02 Hubei842755271-43.11 Hunan365611693941.49 Guangxi5033428406010.69 Chongqing529943218034.53 Sichuan32819196979-8.48 Guizhou6998040084240.76 Yunnan10269355877325.32 Shaanxi67144329539-5.52 Gansu208156121645916.87 Qinghai1918131125584-1.07 Ningxia113096653368-8.26 Xinjiang503552282399448.14 Total output China27558141560824011.69
Unit: metric ton
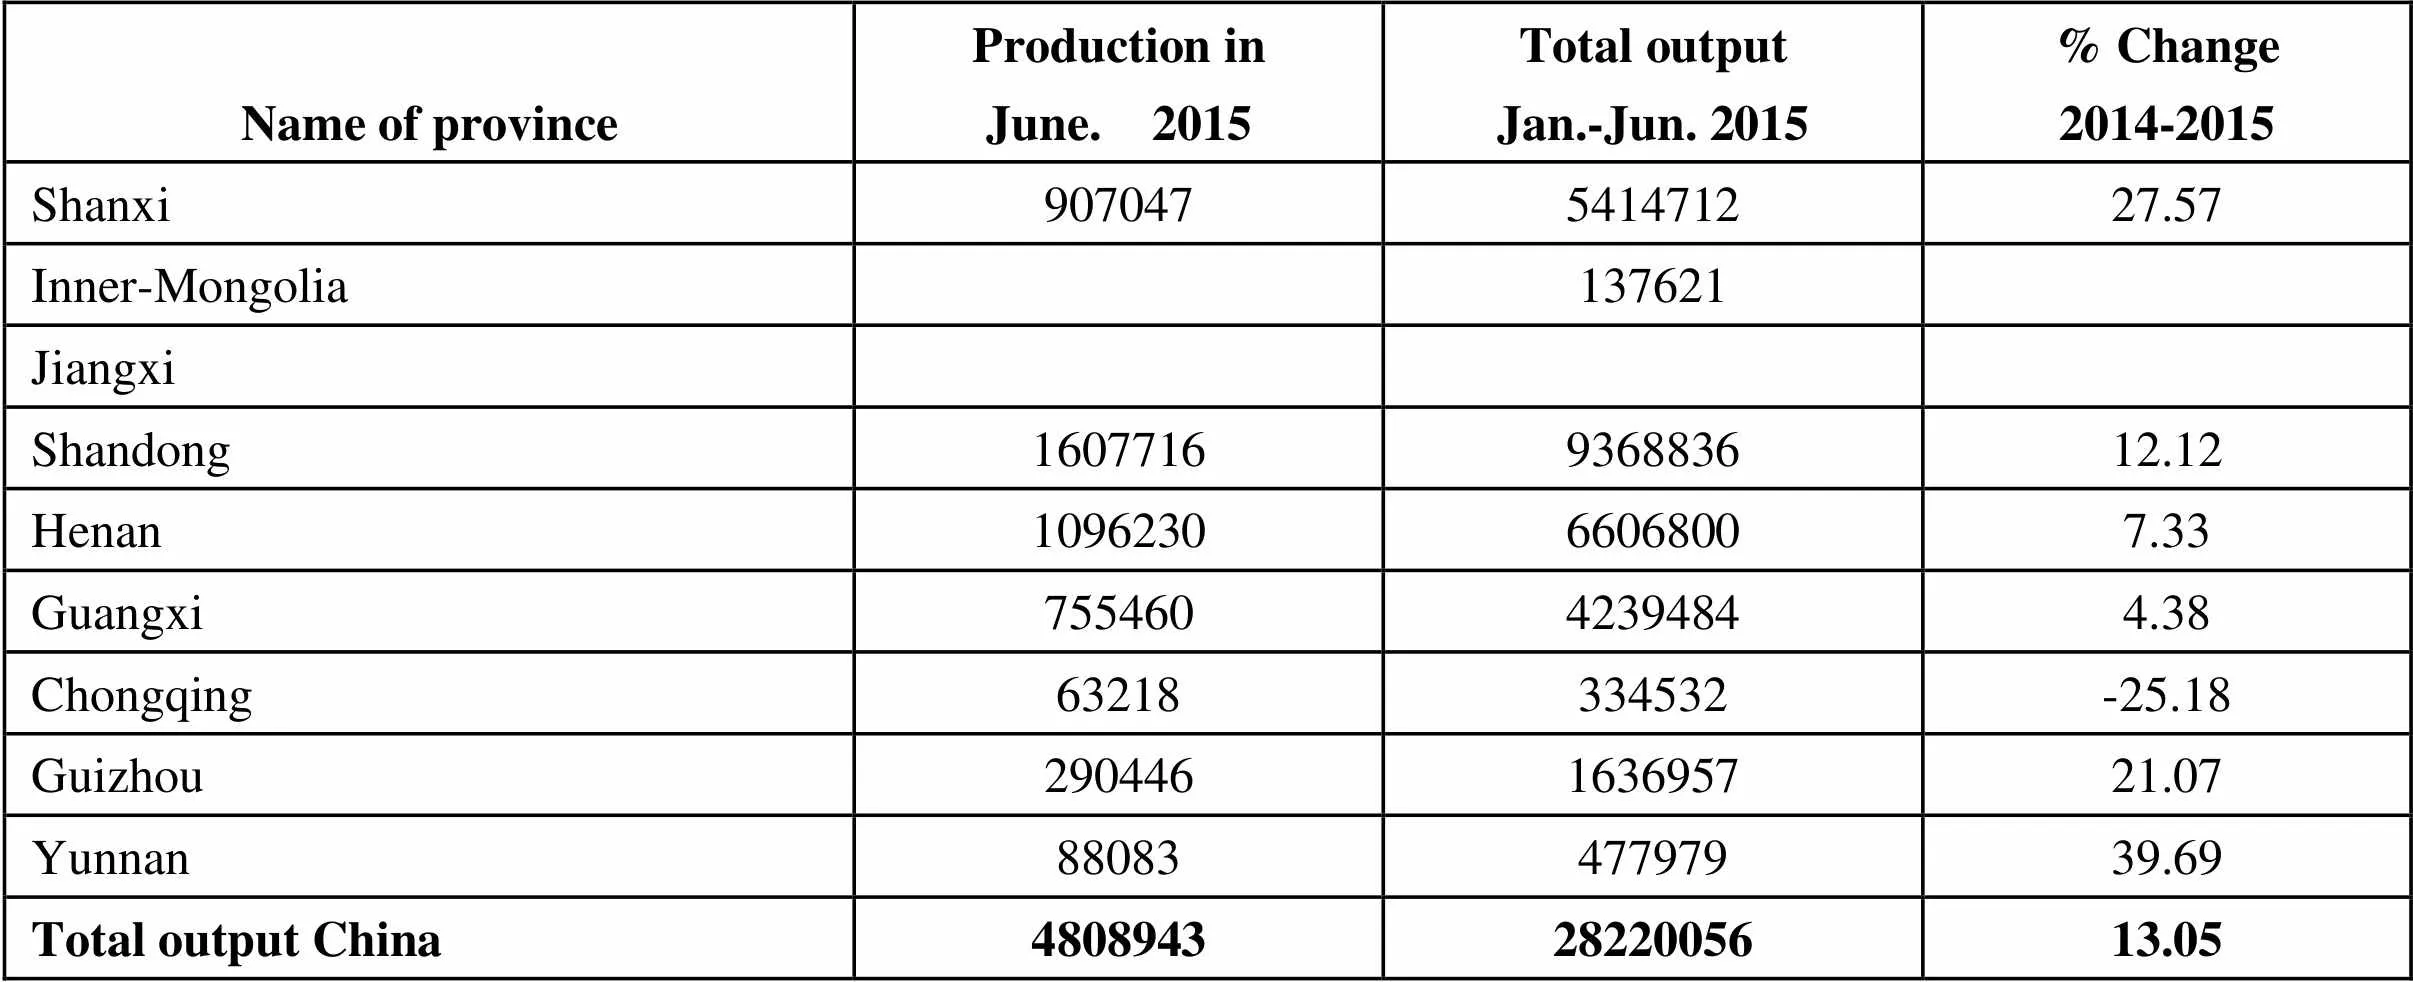
Name of province Production inJune. 2015Total outputJan.-Jun. 2015% Change2014-2015 Shanxi907047541471227.57 Inner-Mongolia137621 Jiangxi Shandong1607716936883612.12 Henan109623066068007.33 Guangxi75546042394844.38 Chongqing63218334532-25.18 Guizhou290446163695721.07 Yunnan8808347797939.69 Total output China48089432822005613.05
Unit: metric ton
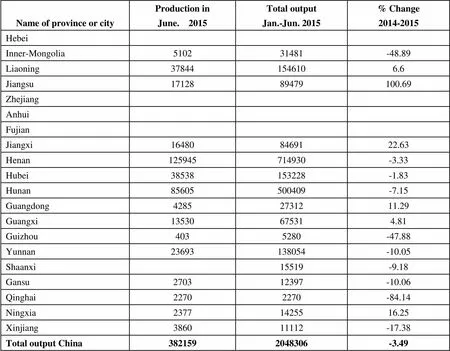
Name of province or cityProduction inJune. 2015Total outputJan.-Jun. 2015% Change2014-2015 Hebei Inner-Mongolia 510231481-48.89 Liaoning378441546106.6 Jiangsu1712889479100.69 Zhejiang Anhui Fujian Jiangxi164808469122.63 Henan125945714930-3.33 Hubei38538153228-1.83 Hunan85605500409-7.15 Guangdong42852731211.29 Guangxi13530675314.81 Guizhou4035280-47.88 Yunnan23693138054-10.05 Shaanxi15519-9.18 Gansu270312397-10.06 Qinghai22702270-84.14 Ningxia23771425516.25 Xinjiang386011112-17.38 Total output China3821592048306-3.49
Unit: metric ton

Name of provinceProduction inJune. 2015Total outputJan.-Jun. 2015% Change2014-2015 Shanxi17196109869-5.76 Liaoning6662664-96.24 Henan535415405-37.67 Shaanxi329361809832.84 Ningxia592531711-38.91 Xingjiang232317047-17.38 Total output China70015374905-20.23
Unit: metric ton
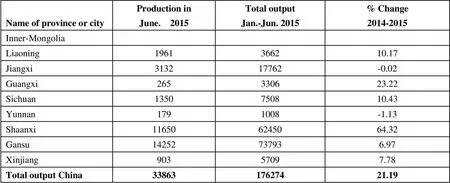
Name of province or cityProduction inJune. 2015Total outputJan.-Jun. 2015% Change2014-2015 Inner-Mongolia Liaoning1961366210.17 Jiangxi313217762-0.02 Guangxi265330623.22 Sichuan1350750810.43 Yunnan1791008-1.13 Shaanxi116506245064.32 Gansu14252737936.97 Xinjiang90357097.78 Total output China3386317627421.19
Unit: metric ton
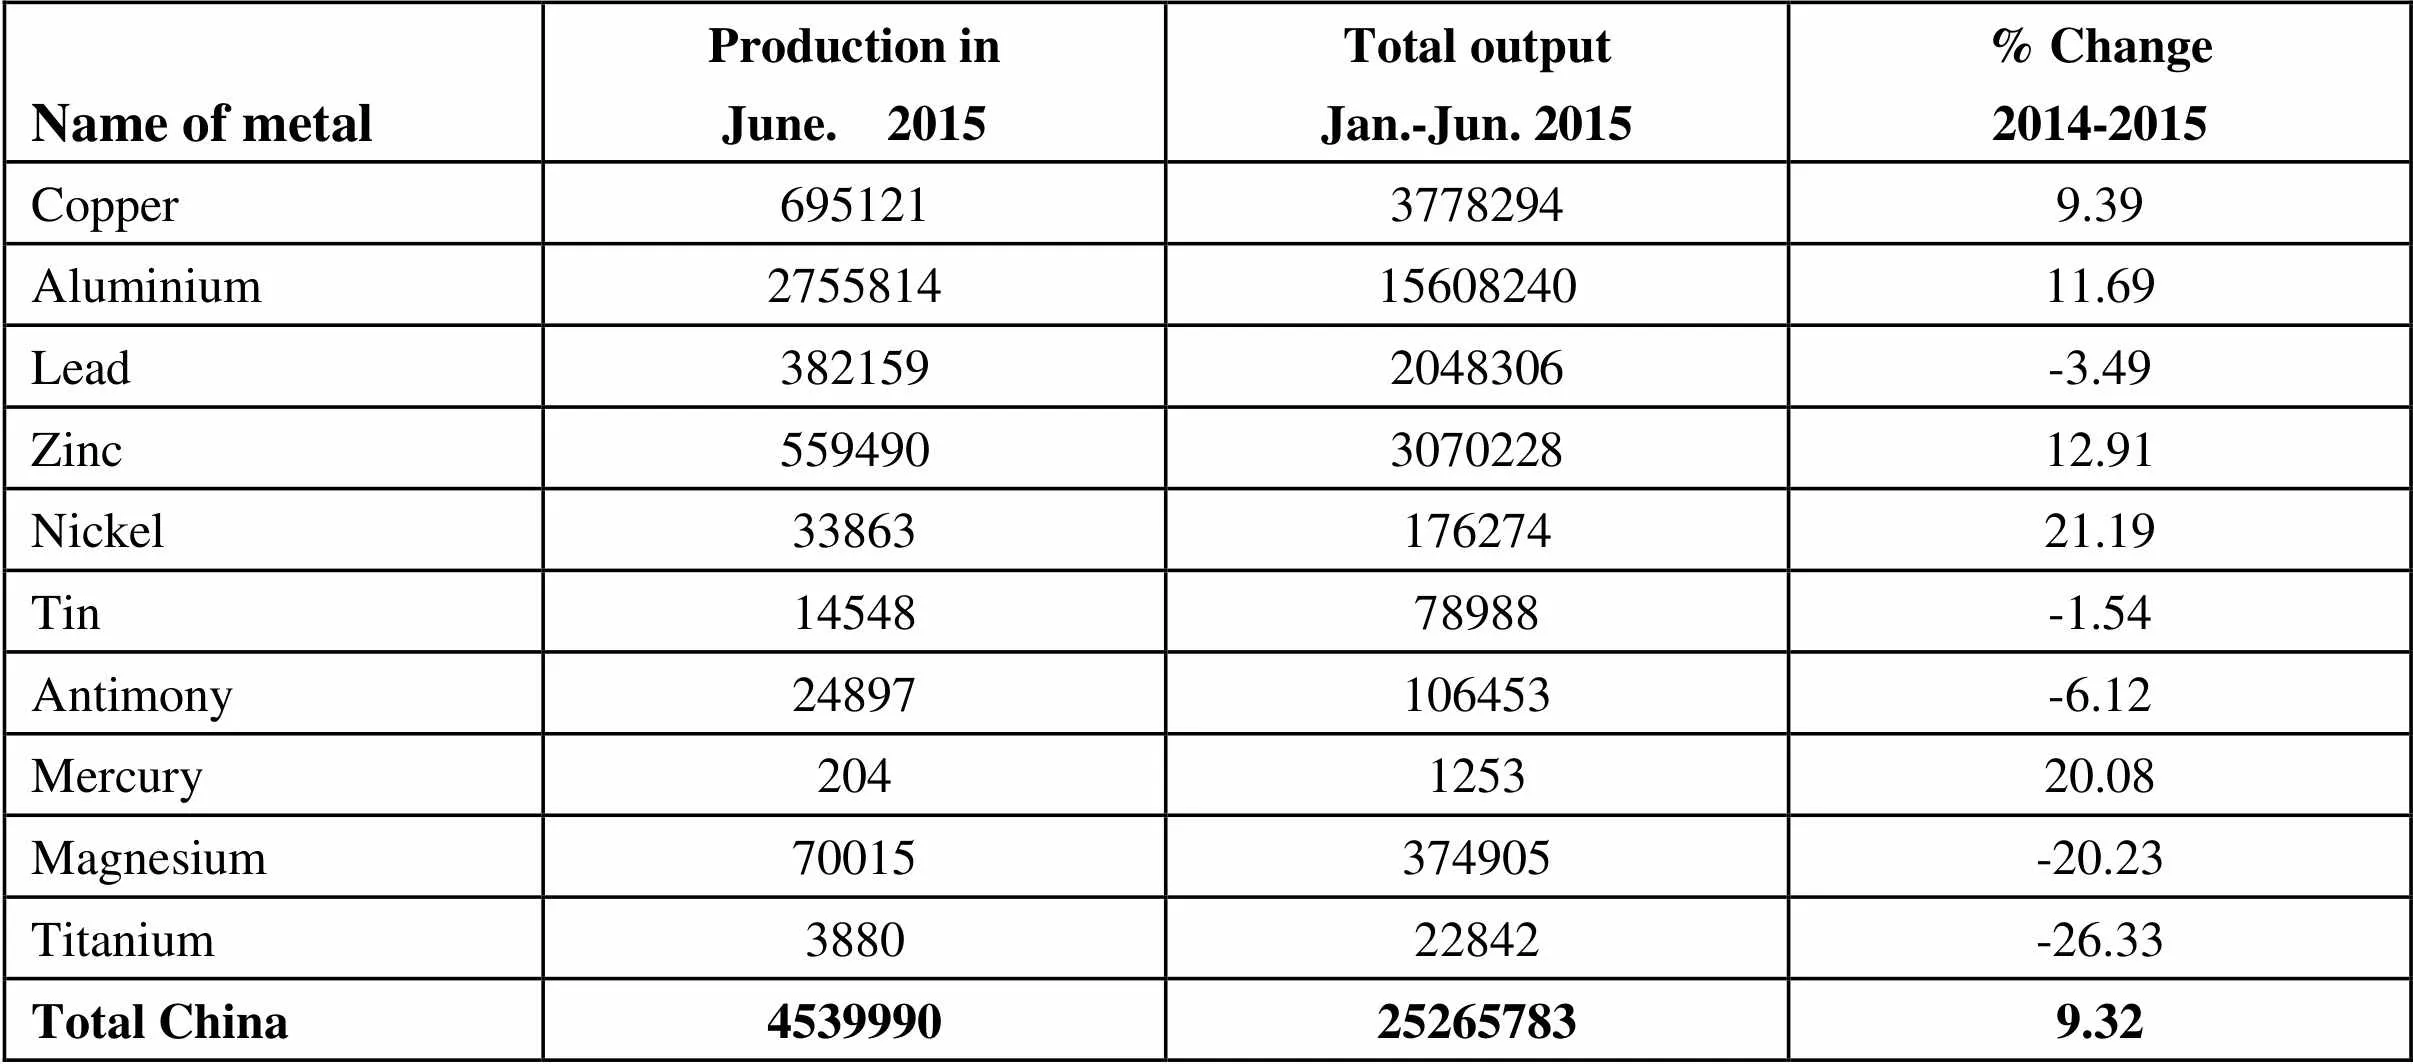
Name of metalProduction inJune. 2015Total outputJan.-Jun. 2015% Change2014-2015 Copper69512137782949.39 Aluminium27558141560824011.69 Lead3821592048306-3.49 Zinc559490307022812.91 Nickel3386317627421.19 Tin1454878988-1.54 Antimony24897106453-6.12 Mercury204125320.08 Magnesium70015374905-20.23 Titanium388022842-26.33 Total China4539990252657839.32
Unit: metric ton
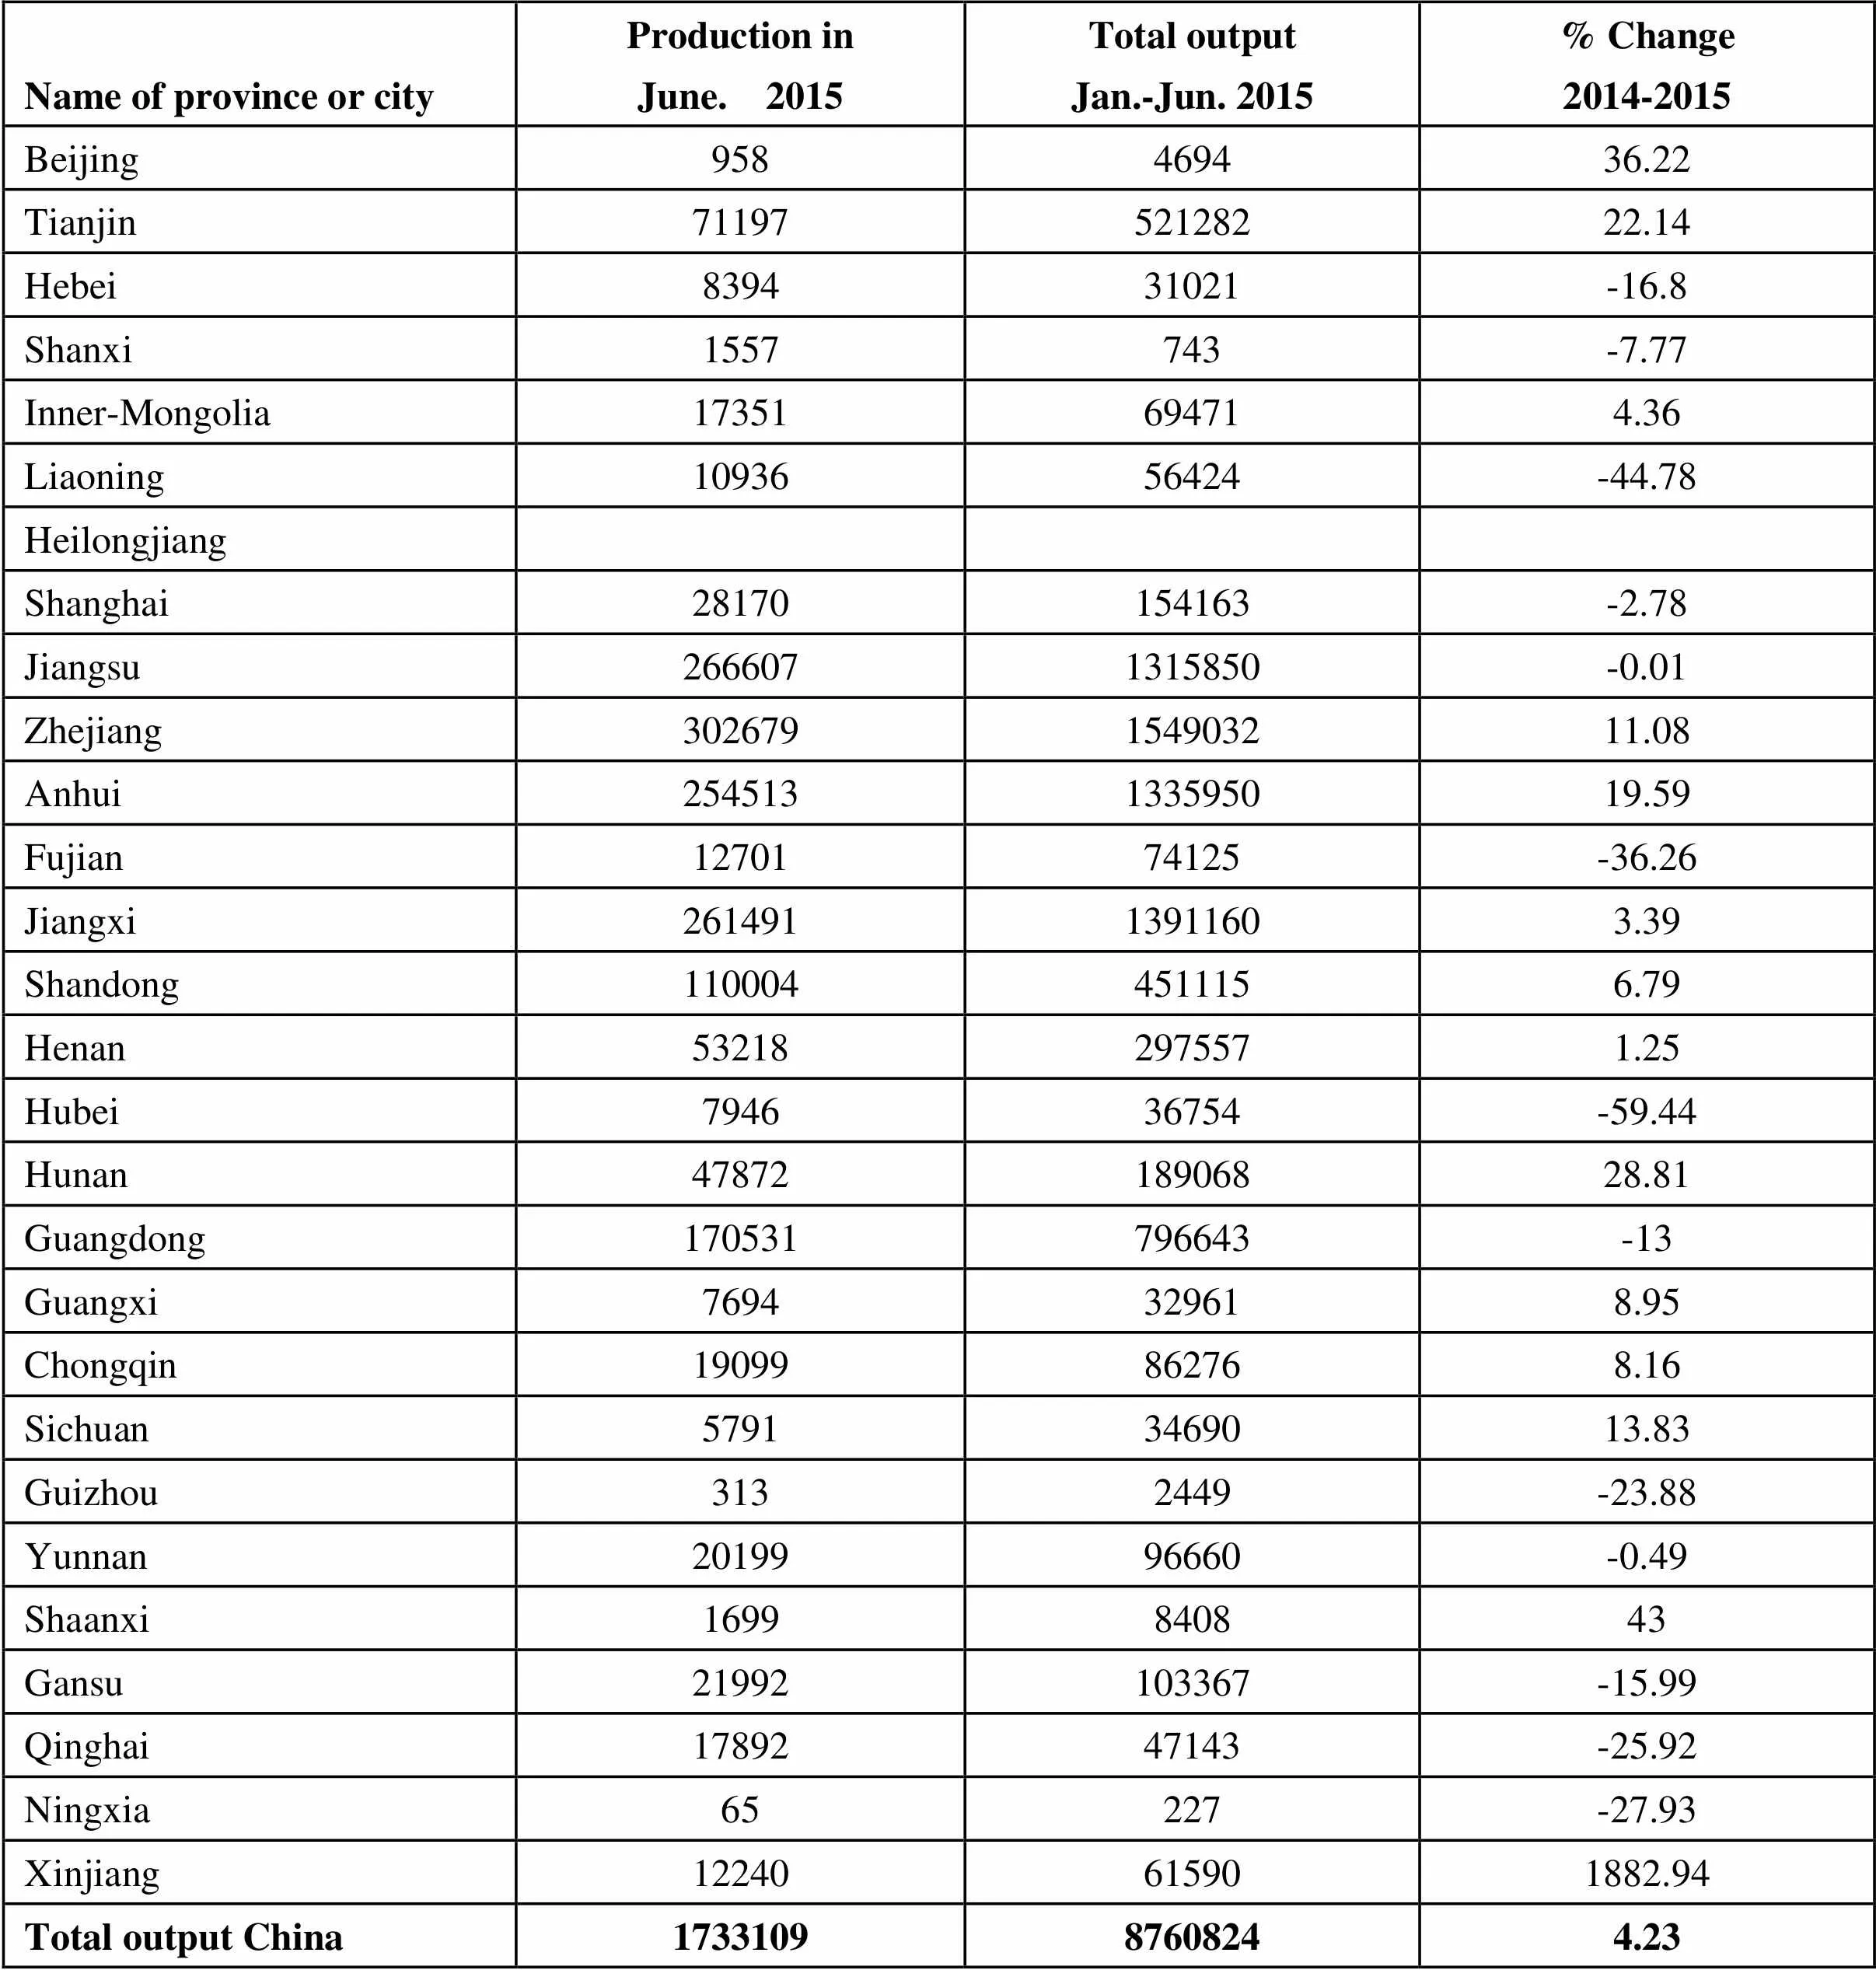
Name of province or cityProduction inJune. 2015Total outputJan.-Jun. 2015% Change2014-2015 Beijing958469436.22 Tianjin7119752128222.14 Hebei839431021-16.8 Shanxi1557743-7.77 Inner-Mongolia17351694714.36 Liaoning1093656424-44.78 Heilongjiang Shanghai28170154163-2.78 Jiangsu2666071315850-0.01 Zhejiang302679154903211.08 Anhui254513133595019.59 Fujian1270174125-36.26 Jiangxi26149113911603.39 Shandong1100044511156.79 Henan532182975571.25 Hubei794636754-59.44 Hunan4787218906828.81 Guangdong170531796643-13 Guangxi7694329618.95 Chongqin19099862768.16 Sichuan57913469013.83 Guizhou3132449-23.88 Yunnan2019996660-0.49 Shaanxi1699840843 Gansu21992103367-15.99 Qinghai1789247143-25.92 Ningxia65227-27.93 Xinjiang12240615901882.94 Total output China173310987608244.23
(End of June. 2015)

Name of commoditiesPeriodImportsExportsQuantity (metric ton)Value (thousand US dollars)% Change (2013-2014)Quantity (metric ton)Value (thousand US dollars)% Change (2013-2014)Copper:Copper concentrate (actual weight)Jan-Jun.5031809792657913.31-4.9513991189052652837875Copper Scrap (actual weight)Jan-Jun.13754063447494-8.06-24.7994350-79.35-82.31Blister copperJan-Jun.2292101386327-15.13-27.494685286796238565Refined copper Jan-Jun.14235788738856-12.42-24.49105180652656-0.02-12.79Copper alloysJan-Jun.1439374934-32.7-37.45109591625377Fabricated copper productsJan-Jun.2284412115417-8.56-15.242055641594841-5.02-12.59Aluminium:AluminaJan-Jun.1589606611268-33.55-29.014557528917-48.09-48.88Aluminium ScrapJan-Jun.8380051199437-9.85-14.874227399.2213.71Primary AluminiumJan-Jun.46723104987-78.01-74.411953144296-64.32-60.63Aluminium alloysJan-Jun.2216054237-39.97-37.0522762748753710.739.02Fabricated Aluminium productsJan-Jun.1934121182505-3.84-0.821842712569188946.0335.32Lead:Lead concentrateJan-Jun.6637717807475.832.6488147-71.71-89Unwrought refined leadJan-Jun.77227-18.83-27.45220564366968.9155.86Unwrought refined lead alloys Jan-Jun.703817498-46.67-43.917562387108.03153.88Fabricated LeadJan-Jun.26596-37.85-6.98992821783-16.9-23.08Zinc:Zinc concentrate (actual weight)Jan-Jun.118588378577151.5545.7886406258160.95127.98Unwrought refined ZincJan-Jun.177648391986-42.87-38.725966013289757926180Unwrought refined Zinc alloysJan-Jun.436211055265.4312.41230581-72.27-63.74Fabricated ZincJan-Jun.513219356-9.64-5.364454318924.6362.32Tin:Unwrought refined tin Jan-Jun.276252872-4.11-20.8624387-91.61-93.7Unwrought refined tin alloysJan-Jun.3407284-1.89-12.37Nickel:Unwrought nickel Jan-Jun.651809434080.92-6.2116910309637-23.98-16.64Unwrought nickel alloysJan-Jun.78311518478.15370.59874412296978.9189.32Fabricated nickelJan-Jun.5880195007-8.18-7.5164144392-6.5-4.65
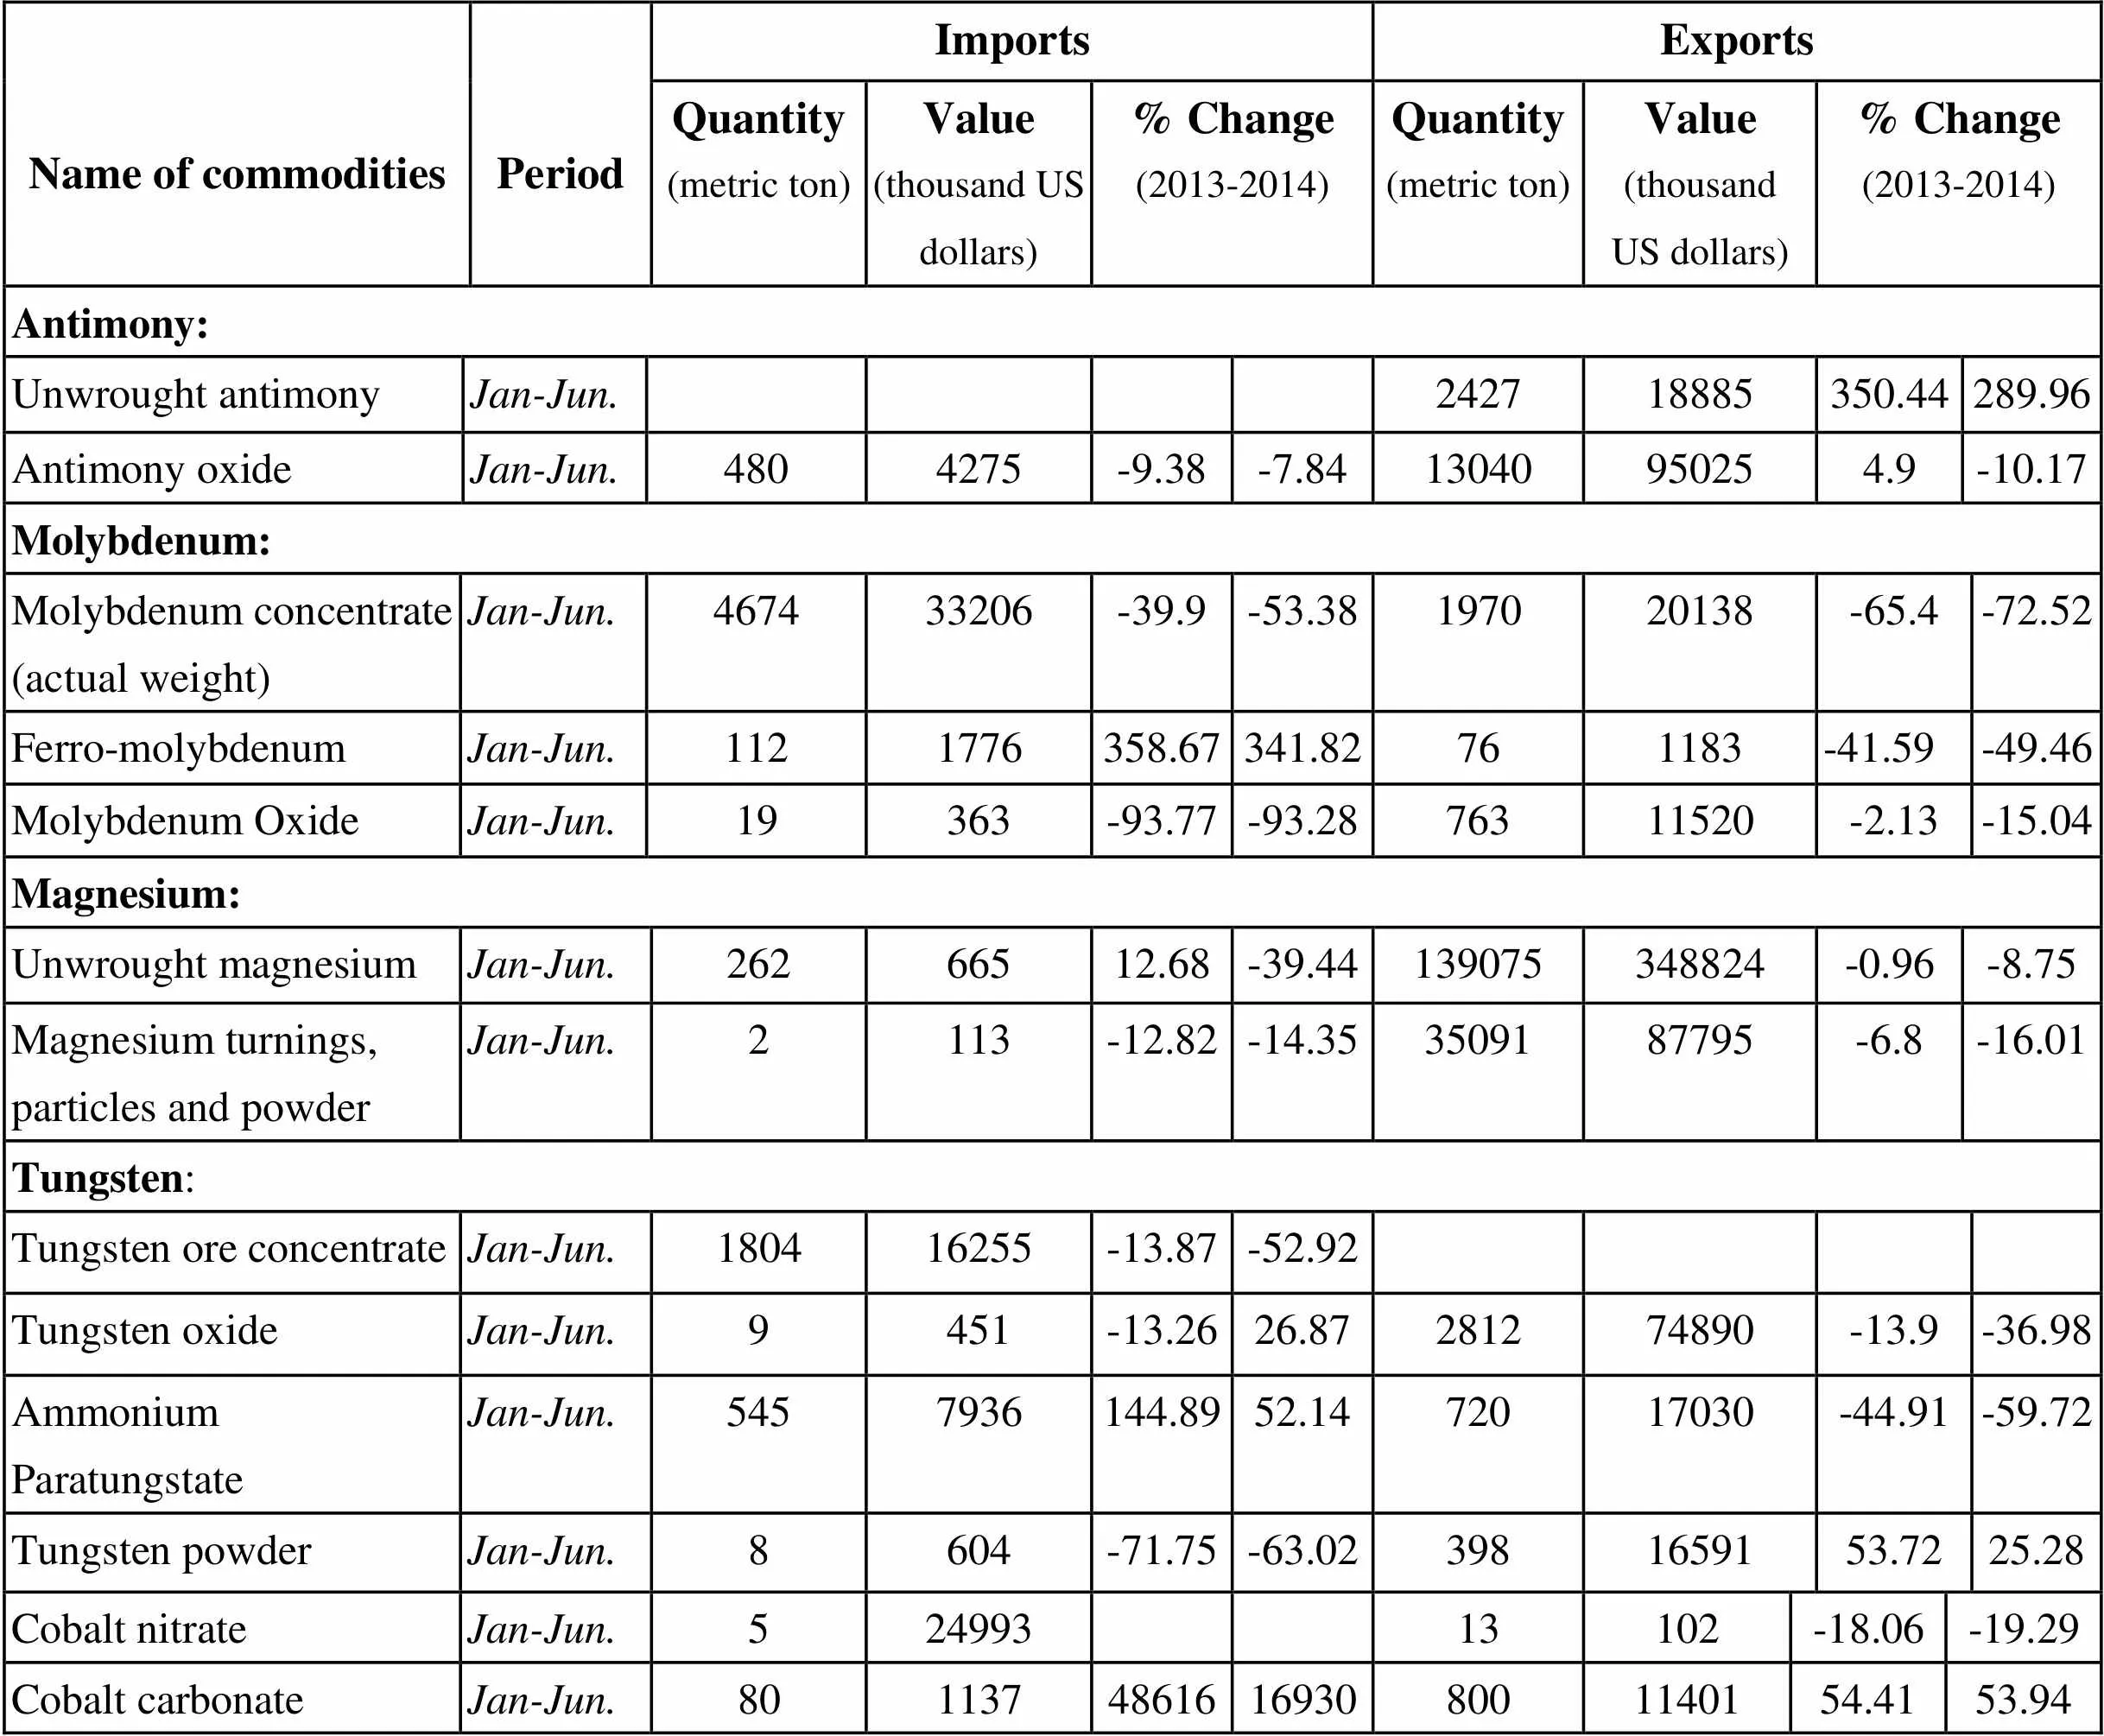
Name of commoditiesPeriodImportsExportsQuantity (metric ton)Value (thousand US dollars)% Change (2013-2014)Quantity (metric ton)Value (thousand US dollars)% Change (2013-2014)Antimony:Unwrought antimony Jan-Jun.242718885350.44289.96Antimony oxideJan-Jun.4804275-9.38-7.8413040950254.9-10.17Molybdenum:Molybdenum concentrate (actual weight)Jan-Jun.467433206-39.9-53.38197020138-65.4-72.52Ferro-molybdenumJan-Jun.1121776358.67341.82761183-41.59-49.46Molybdenum OxideJan-Jun.19363-93.77-93.2876311520-2.13-15.04Magnesium:Unwrought magnesiumJan-Jun.26266512.68-39.44139075348824-0.96-8.75Magnesium turnings, particles and powderJan-Jun.2113-12.82-14.353509187795-6.8-16.01Tungsten:Tungsten ore concentrateJan-Jun.180416255-13.87-52.92Tungsten oxideJan-Jun.9451-13.2626.87281274890-13.9-36.98Ammonium Paratungstate Jan-Jun.5457936144.8952.1472017030-44.91-59.72Tungsten powderJan-Jun.8604-71.75-63.023981659153.7225.28 Tungsten carbide powderJan-Jun.13956-21.88-23.0312064983044.3617.43 Ferro-tungstenJan-Jun.20236-45.42-47.4955215950122.8351.6 Silver: (unit in kg) Unwrought silverJan-Jun.280179144275126.96195.8767519437736359.0724.46 Silver powderJan-Jun.58352769152-20.9-18.227366761977-63.28-49.9 Semi-finished silverJan-Jun.27802836426-5.16-16.2980545241937546325 Silver ornamentsJan-Jun.120622462428.5119.92101456283436-16.03-16.07 Silverware Jan-Jun.68971710.0118.4662291418733.2533.01 Gold: (unit in kg) Gold ornamentsJan-Jun.27771764801.2615.92667173777082-62.32-69.7 Titanium: Fabricated titaniumJan-Jun.239417626126.5527.4247151203050.251.49 Titanium concentratesJan-Jun.730438111906-19.05-42.8578666859-5.15-15.44 Titanium dioxideJan-Jun.810232100640.88-6.322279714303771.17-8.04 Cobalt: Cobalt and Fabricated cobaltJan-Jun.6855136783424.0819.371225384-37.44-41.46 Cobalt concentratesJan-Jun.10320921499853.9265.74 Cobalt oxideJan-Jun.6965502182.187.75352780684-11-12.17 Cobalt nitrateJan-Jun.52499313102-18.06-19.29 Cobalt carbonateJan-Jun.80113748616169308001140154.4153.94
Unit: metric ton
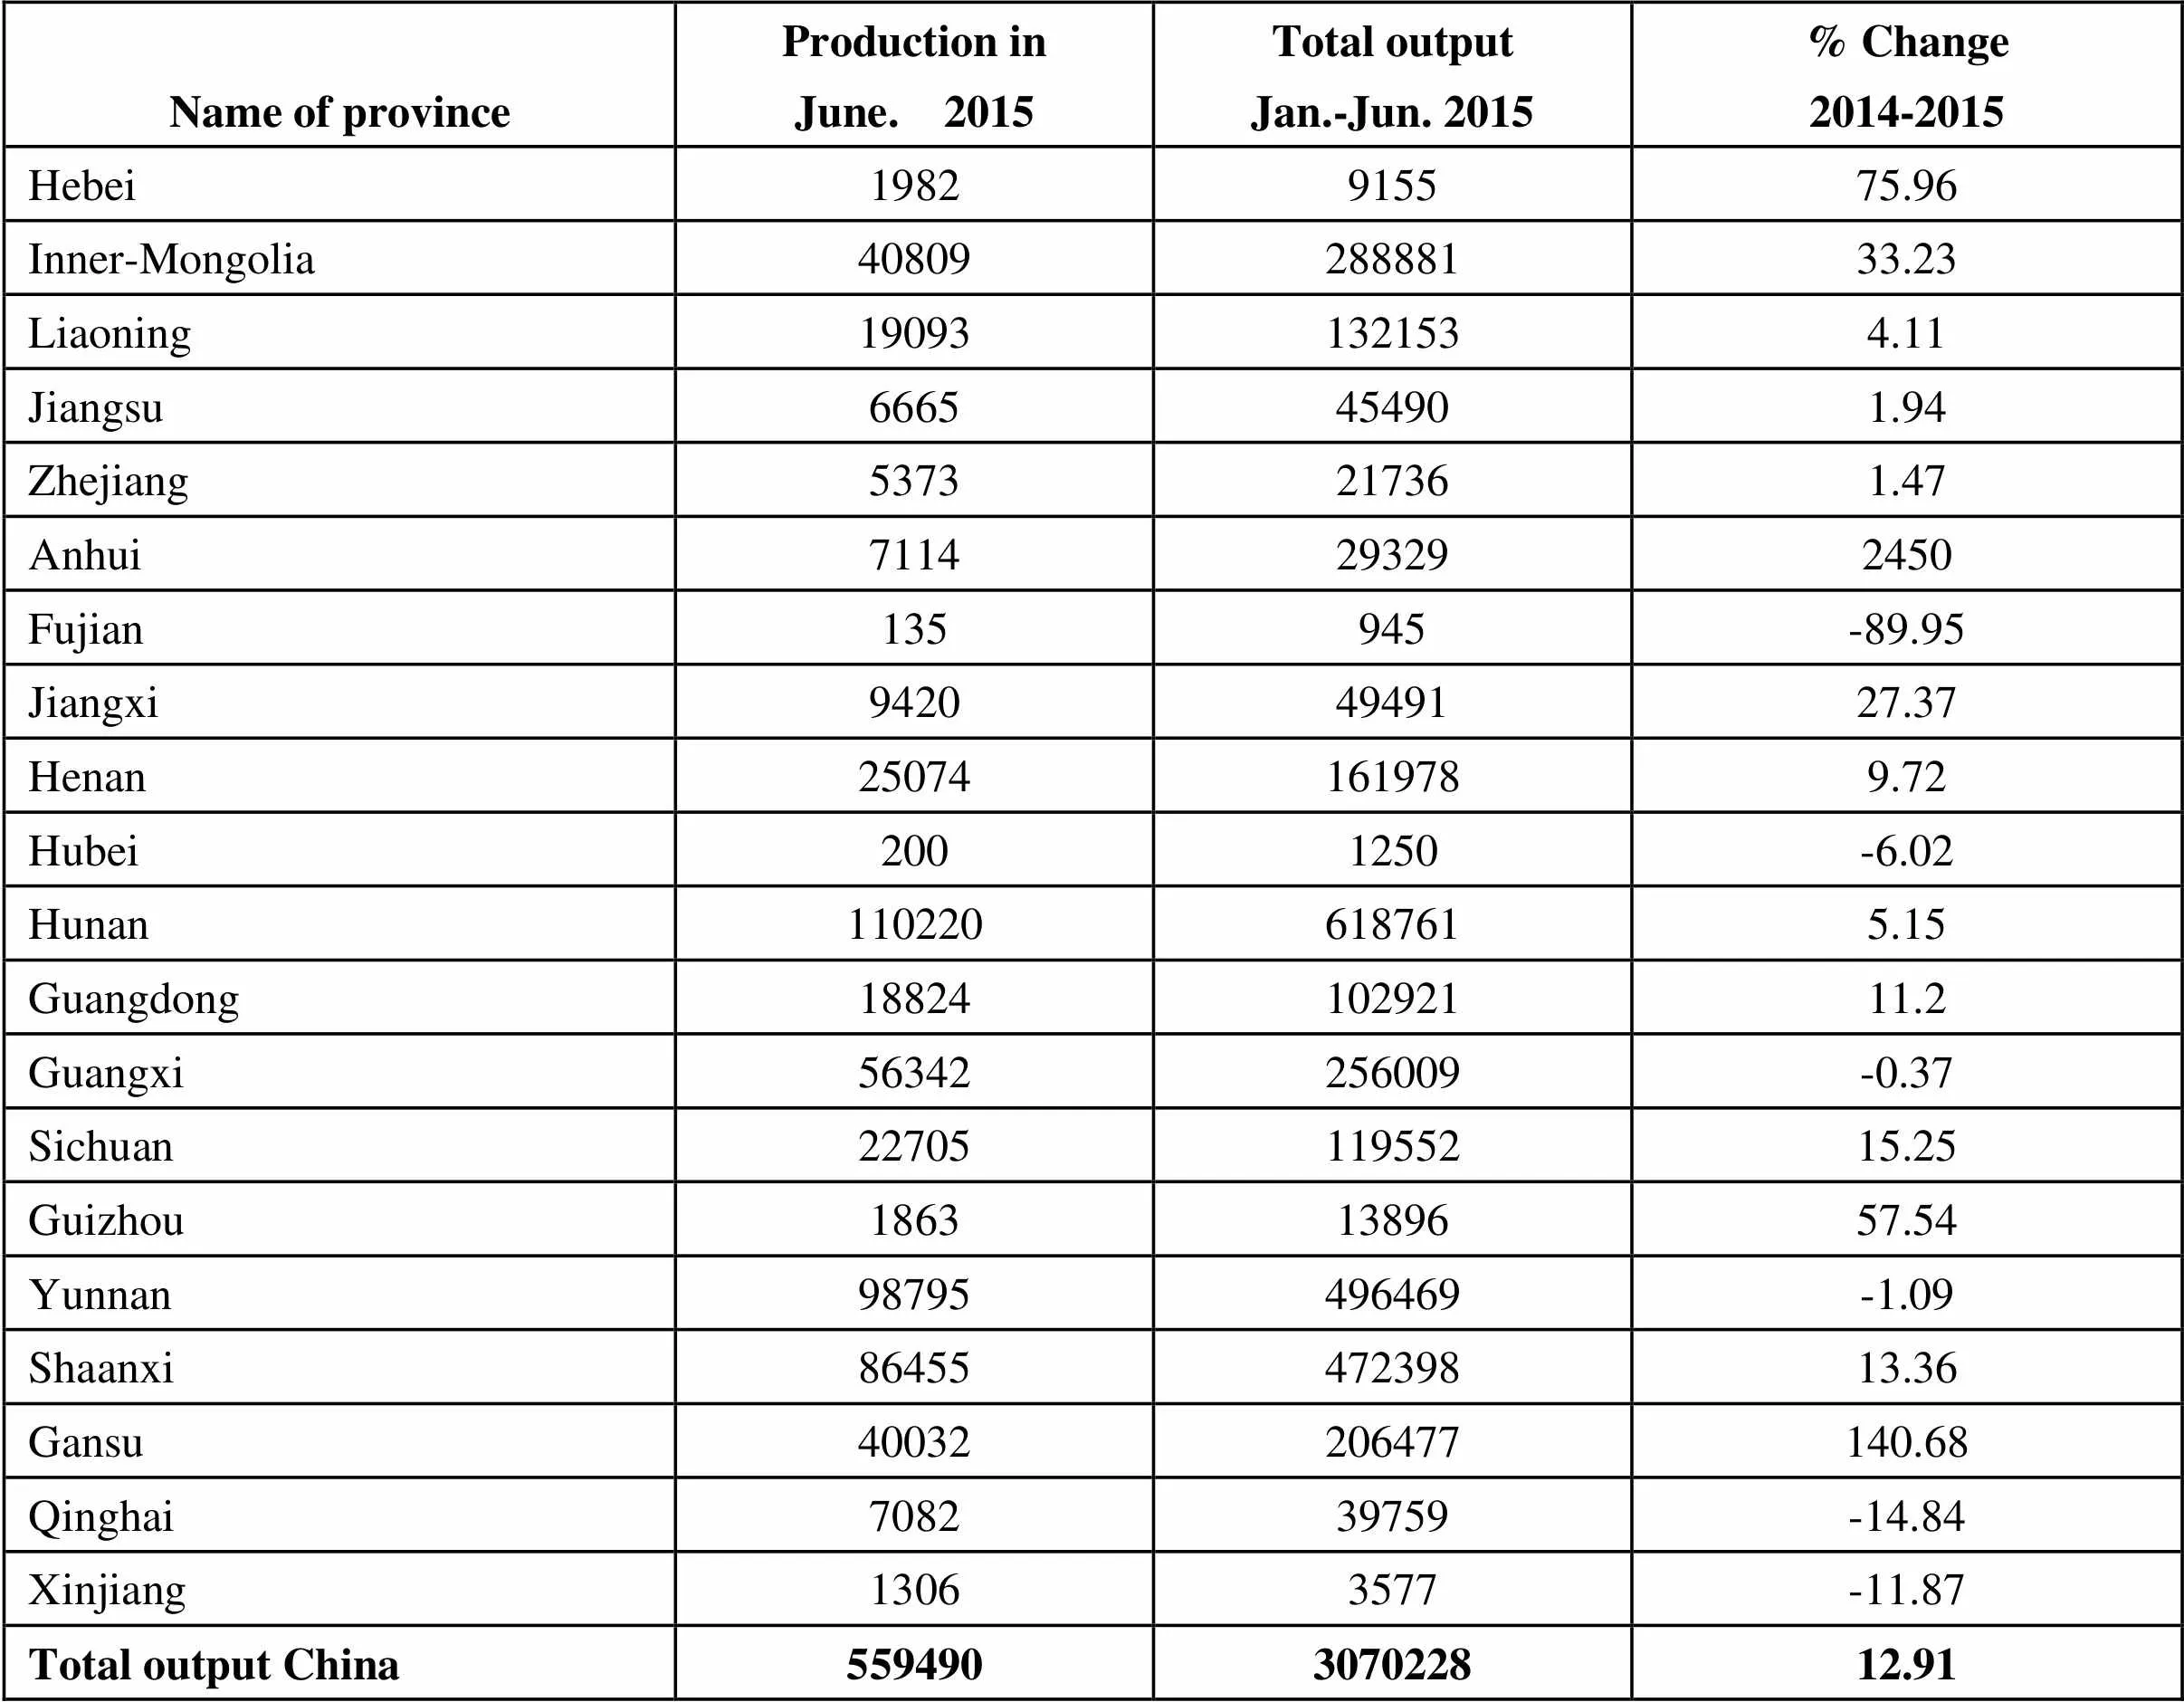
Name of provinceProduction inJune. 2015Total outputJan.-Jun. 2015% Change2014-2015 Hebei1982915575.96 Inner-Mongolia4080928888133.23 Liaoning190931321534.11 Jiangsu6665454901.94 Zhejiang5373217361.47 Anhui7114293292450 Fujian135945-89.95 Jiangxi94204949127.37 Henan250741619789.72 Hubei2001250-6.02 Hunan1102206187615.15 Guangdong1882410292111.2 Guangxi56342256009-0.37 Sichuan2270511955215.25 Guizhou18631389657.54 Yunnan98795496469-1.09 Shaanxi8645547239813.36 Gansu40032206477140.68 Qinghai708239759-14.84 Xinjiang13063577-11.87 Total output China559490307022812.91
 China Nonferrous Metals Monthly2015年8期
- China Nonferrous Metals Monthly的其它文章
- Henan Province Aluminum Enterprises Initially Finalized the Transition Path as “Aluminum +X”
- Chinalco Rare Earth has Surpassed Ganzhou to Become the Biggest Giant in South China Rare Earth
- By Mid July China’s Alumina Industry Completed Construction of a Total of 65.55 Million Tonnes of Capacity
- Qijiang Plans to Build 50 Billion Yuan Industrial Cluster for Transport-use Aluminum
- Hunan Gold Group Completed Asset Restructuring
- Ge Honglin: Expand and Consolidate Chemical Alumina to Create World Top-class Brand
