Component content distribution profile control in rare earth countercurrent extraction process☆
Hui Yang *,Fangping Xu Rongxiu Lu Yongquan Ding
1School of Electrical and Electronic Engineering,East China Jiaotong University,Nanchang 330013,China
2Key Laboratory of Advanced Control&Optimization of Jiangxi Province,Nanchang 330013,China
Keywords:Rare earth cascade extraction Balance model Distribution regulation Pr/Nd
ABSTRACT Considering that the on-line measurement and automatic control of element component content(ECC)are difficult to perform in rare earth cascade extraction process,the ECC distribution profile is dynamically regulated at all stages to assess the effect of product purity control.Focusing on the theory of countercurrent extraction,the technology parameters and pre-setting flow-rates during the extractprocess are designed.Under varying process parameters,a novel step by step model is also proposed for each stage to analyze the impact on the distribution profile change.Combining the mass balance model and ECC changing trend at the monitoring stage,the ECC distribution profile can be automatically regulated by dynamically compensating the related extract or scrubbing liquid flow-rate.To this end,the required product purity at the two outlets is achieved.Based on Wincc and Matlab dynamic simulators,a specific Pr/Nd cascade extraction process is used to illustrate and demonstrate the application of the present approach.
1.Introduction
The automatic control based on-line measurement of element component content(ECC)is very important in the rare earth cascade extraction process,because it ensures the product quality,improves the qualified rate of product and reduces the material cost[1,2].Due to the small separation factors among rare earth elements,the extraction of high purity product demands a large amount of stages to handle the many uncertain factors.For this reason,the countercurrent extraction from the initial equilibrium to new equilibrium state is rather complicated and will last a very long time in general.When it deviates from the equilibrium state,the on-line measurement of ECC and its distribution profile are difficult to realize by manual control[3,4].To implement automatic control of rare earth extraction process,an effective control model should be developed first.
The theory of countercurrent extraction provides a system solution to the extraction process design and commissioning for production[5].With the theory,a dynamic model was applied to explore the static and dynamic behavior of the extraction process[6].To calculate the extraction equilibrium and mass balance in multi-component system,a new-Raphson algorithm was proposed[7].By means of a computer process simulation platform,the dynamic behavior of multicomponent solvent extraction systems has been studied[8].A mathematical model for equilibrium distribution for multicomponent rare earth extraction was developed using neural networks[9].Similarly,artificial neural network was used to modeling the mass transfer of rare earth solvent extraction[10].Through applying system identification on the dynamic experimental data,a reduced-order linear model was proposed to describe process behavior[11].Based on the material balance equations,a multiple model approach was employed to solve the on-line measurement problem for the rare earth extraction process[12].Currently,the majority of rare earth separation companies emphasize on the single loop control of feeding flow-rate,liquid level and so on,which are of limited usefulness for the on-line measurement of ECC distribution and optimal control design[13,14].
To cope up with these issues,the process parameters are first designed and the pre-setting flow-rates using the theory of counter current extraction are determined.Then,a recursive model to predict ECC distribution at all stages is introduced,from which the dynamic monitoring point is derived.The flow-rates of extract and scrubbing liquid are compensated in consideration of ECC distribution and mass balance model.Hence,the dynamic regulation of ECC distribution is satisfied.Combining WinCC and Matlab software,a rare earth extraction process simulation system is built,which can help operators intuitively analyze ECC distribution change under various operating conditions.Finally,the Pr/Nd extraction process is simulated dynamically.
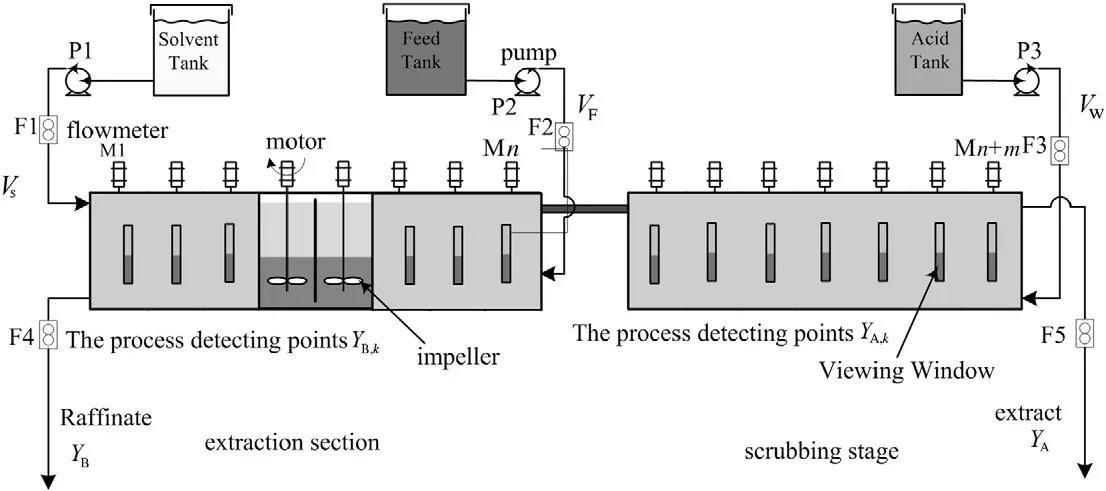
Fig.1.Schematic of rare earth countercurrent extraction.
2.Outline of Rare Earth Extraction Process
Due to the small separation factors between rare earth elements,the extraction of high purity product entails a large amount of mixersettlers connected in cascade.The two component A and B extraction process is depicted in Fig.1,which involves n extraction stages and m scrubbing stages[15,16].
From Fig.1,the hard extracted product YBin aqueous phase and the easy extracted product YAin organic phase are obtained from the 1st stage and the(n+m)-th stage.The extractant liquid is injected into the solvent tank at the 1st stage in extraction segment with a flow rate Vs,which flows from left to right under the action of extractor stirring force.The feed liquid containing the ECC of A and B in terms of VFAand VFBis poured into the n-th stage feed tank at a flow rate VF,whose counter-current flow is from right to left.The scrubbing liquid is added to the acid tank at the(n+m)-th stage with a flow rate VW,which is also in the form of counter-current flow and meets the feed liquid at the n-th stage.In the extract stage,because of the different distribution ratios of ECC in the aqueous and organic phases,the more A and the less B are both extracted to the organic phase.While in the scrubbing stage,the less B in the organic phase can be washed back to the aqueous phase by adjusting the flow-rate of scrubbing liquid.After the exchanging and purifying between many stages of the extraction and scrubbing section,component A and component B can be separated effectively.To improve the efficiency of process control,process detecting points YA,kand YB,k,which are characterized with high sensitivity of ECC distribution change,have been set between five and fifteen stages from outlet.As a result,component content YAand YBcan be measured and controlled to reach the desired value.
3.ECC Distribution Profile Control
In the rare earth extraction process,the optimal parameter design has a direct impact on the available selection of process stages,which may dramatically influence the economic efficiency of rare earth enterprises.In general,the process parameters and pre-setting flow rate are firstly optimized on the basis of the nature of components and the specific feeding mode.
3.1.Process parameter design and flow-rate pre-setting optimization
Given the separation factor β between the rare earth elements,the feeding liquid molar fraction fAand fB,and product purity PAand PB,the process parameters are optimized using the theory of countercurrent extraction.When the feed liquid is poured in the aqueous phase,the outlet molar fraction fA′in the organic phase and fB′in the aqueous phase,the extraction capacity S and the scrubbing capacity W,and the extraction ratio EMand EM′can be stated as[17]:

Meanwhile,the optimal extraction and scrubbing section stages n and m can be determined by the related process parameters,as shown:
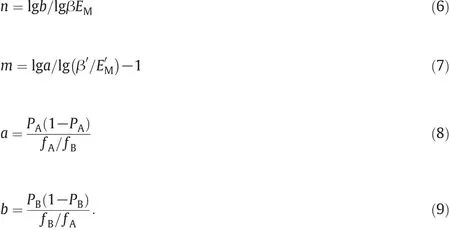
In the actual production process,the theoretical stages n and m are required to be increased so that the product quality can be satisfied[18].
Generally,the parameters are expressed as the functions of the practically controllable variables of inlet volumes,such as the feed liquid,the extractant liquid and the scrubbing liquid.Their pre-setting flow-rates are optimized as:

where MFis the feed capacity;CF,CSand CWdenote the concentration of the feed liquid,the extractant saturation and the acid liquid,respectively.
In addition to the process parameters,ECC distribution at each stage is another key factor to influence product purity at both outlets.With the optimal process parameters and pre-setting flows,a recursive model is introduced to calculate the ECC step by step from both outlets to the feeding stage[19].
3.2.A step by step calculation model for ECC at each stage
The computational procedure of the model is:
(1)In the extraction section,assuming that the component composition X[k,1]in the aqueous phase at the first stage is known,together with the constant relationship of mass and flow rate,the i-th ECC at the k-th stage X[k,i]and Y[k,i]can be acquired step by step from left to right.
If k=1,the corresponding content of each component in the organic phase can be expressed as:

where N is the number of the components,the values of β1/1and βN/Nare both 1,andβ1/irefers to the relative separation factor between the i-th ECC and the 1st one.Similarly,β1/Nrepresents the one between the i-th ECC and the N-th ECC.
When k>1,the content of each component at the k+1 stage is calculated with the following recursion relations:

(2)In the scrubbing section,given component composition Y[n+m,i]at the last stage in the organic phase,the component composition that corresponds to the aqueous phase is computed as:

Then,starting from the last stage k=n+m,the formula of component composition at each stage can be achieved by the recursion procedure from right to left towards the middle feeding stage:

Considering that the process parameters and pre-setting flowrates are designed with the static extraction equilibrium and mass balance,ECC distribution profile at each stage will move forward or backward under the disturbance of process parameters and environmental conditions.When the process approaches the new equilibrium from the initial equilibrium,it is required to monitor ECC at each stage in real time and compensate the flow-rates on-line.Then,product purity control requirements will be achieved.
3.3.ECC distribution profile regulation
According to the theory of counter current extraction,the mass dynamic balance model is developed as:

where ε refers to the saponification degree of extractant,and the main influencing factors of ECC distribution forms an interrelated system.A small change in any one parameter may lead to impossible extraction equilibrium,along with the changing ECC distribution profile.According to the case of profile moving forward or backward,the dynamic compensation strategies are:
a)In the case of the profile moving forward
1.When the ECC profile in the extraction and scrubbing section both move forward,it is only required to increase the capacity of the extractant liquid.
2.If the ECC profile in the extraction section moves forward and that at the scrubbing section is normal,the capacity of the extractant liquid needs to be increased and the feed should be decreased.
b)In the case of the profile moving backward
1.When the ECC profile in the extraction and scrubbing section both move backward,the capacity of the scrubbing liquid is only required to be increased.
2.While the ECC profile in the extraction section is normal and that in the scrubbing section moves backward,the capacity of the feed needs to be reduced.
Based on these conditional rules,the required flow-rates are obtained using model(19),which can be adjusted automatically with a PID controller.To control the complex rare earth extraction process,Fig.2 shows a novel ECC distribution profile regulation framework.In which,V0=[]stands for the pre-setting flow-rates of extract,feeding and scrubbing liquid,ΔVS,ΔVWare the compensation flow-rate value for extract and scrubbing liquid,respectively,and VS,VF,and VWrefer to the dynamic setting value for the flow loop.
To avoid the blindness of typical control modes(off-line analysis,empirical control and manual adjustment)applied in the rare earth extraction process,the step by step calculation model and a visual ECC distribution regulation using the field process parameters are adopted.In the extraction process from the initial equilibrium to the new equilibrium state,the ECC changing trend ateach stage can be displayed dynamically.Then,the adjustment effect may be intuitively observed and whether the required product purity at the two outlets is achieved can be analyzed.To this end,the control strategies can be performed in time.
4.Case Study
In this section,the powerful engineering computing of Matlab and the virtual interface of Wincc are combined to build the simulation platform of ECC distribution control[20].Industrial experiments are conducted on a Pr/Nd extraction production using P507-HCL extraction system,whose feed liquid contains 40%of Pr and 60%of Nd,PAand PBare both set at 0.9999,β is 1.55,MFis considered as 1 mol·min−1,and fAand fBare initialized as 0.6 and 0.4,respectively.
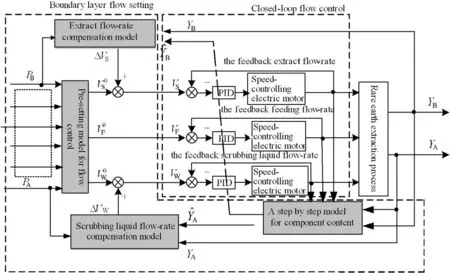
Fig.2.ECC distribution profile regulation for the extraction process.
According to the field process parameters and formulas(6)to(12),the optimal parameters for the simulated system can be obtained.For example,fAand fBare reset to fA′0.6027 and fB′0.3973,the optimal S and W are 2.2 mol·min−1and 2.5973 mol·min−1,the best n and m are computed as 31 and 33,the pre-setting VF,VSand VWare 6.25 L·min−1,12.2222 L·min−1and 3.896 L·min−1,respectively.Following Eqs.(13)-(18),the optimal monitoring points are the 17-th stage at the extract section together with the 57-th stage at the scrubbing section.
Taking the composition of the feed liquid for example.When the molar fraction fAis 0.6,ECC distribution profiles in the initial equilibrium state are shown in Figs.3 and 4.According to the step by step calculation model for ECC at each stage,the target value of Pr at the 17-th stage is 0.9032 and Nd at the 57-th stage is 0.9932.In the control process,if the ECC of monitoring stages is lower than the expected value,the required product purity at the two outlets will not be achieved.As fAchanges,the profile of ECC distribution moves either forward or backward as shown in Figs.3 and 4,where the grey one represents the distribution in the new equilibrium state and the black line is the feed stage at the 31th stage in the extraction section.
4.1.Influence of ECC distribution profile moving
As observed in Fig.3,if fAincreases,the distribution profile of ECC at each stage will move forward compared with the distribution in the initial equilibrium state,and the purity of the product Pr in the outlet of the aqueous phase cannot meet the technical requirements.While fAdecreases,the distribution profile of ECC in the new equilibrium state moves backward,then the purity of Nd at the organic phase fails to achieve the requirements.Fig.4 shows the dynamic process.
4.2.ECC distribution control in case of parameter disturbance
Assuming the molar fraction fA=0.6±0.1,ECC distribution control can be implemented with Fig.2.

Fig.3.Profile of ECC distribution moving forward.
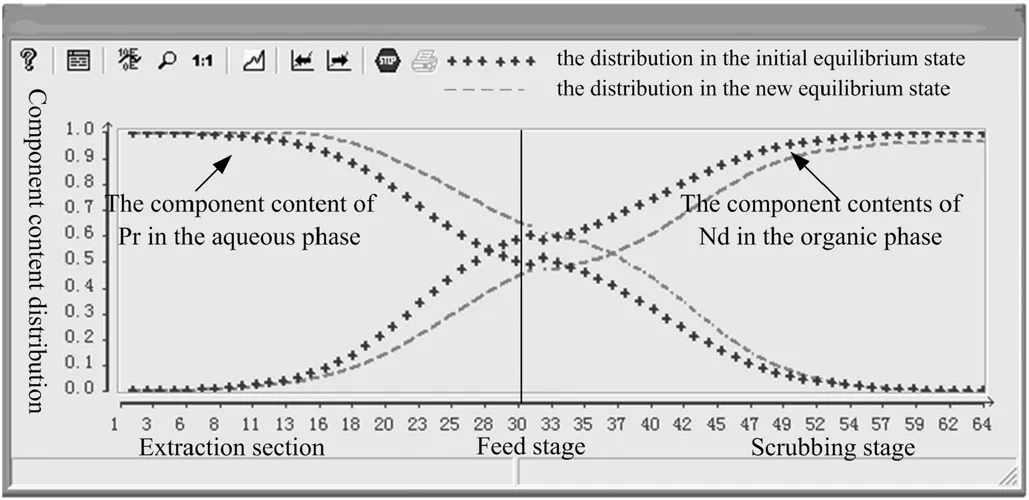
Fig.4.Profile of ECC distribution moving backward.
(1)When f A changes from the given value of 0.6 to the upper bound of 0.7,ECC distribution profile in the new equilibrium state moves forward.Combined with the ECC changing trend in Fig.3 and the step by step calculation model for ECC at each stage,the component content of Pr at the monitoring point in the aqueous phase is 0.8194,which is lower than the expected value of 0.9032.To keep the extraction process at the steady status,the total capacity or the flow-rate of the organic extractant liquid may be enhanced using the dynamic compensation strategies.According to the mass balance model[Eq.(19)],the actual component content YBand the component content^YBinferred by the step by step model for ECC,the compensation value ΔVSof 2.0463 L·min−1can be obtained.That is,the extract flow-rate is required to be regulated from VS012.2222 L·min−1to VS14.2685 L·min−1,as shown in Fig.5 at time T1.Meanwhile,it is observed that the extract flow-rate returns to the pre-setting state at time T2.

Fig.5.ECC distribution profile control with moving forward.
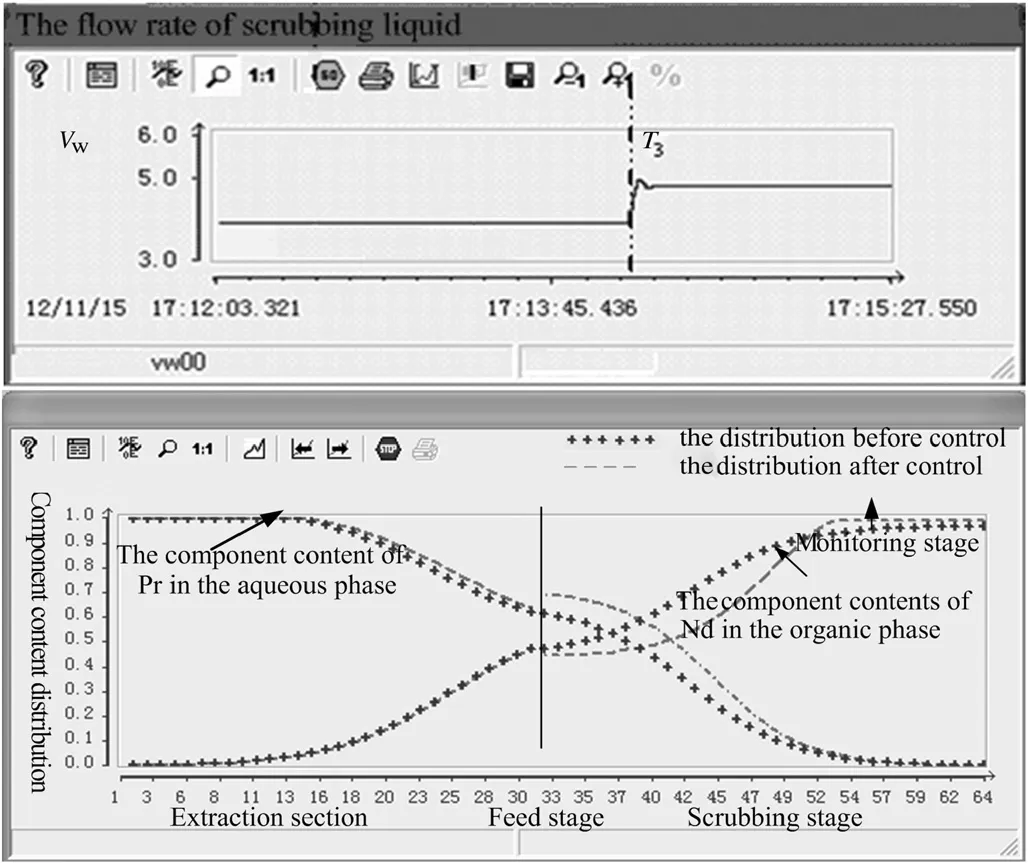
Fig.6.ECC distribution profile control with moving backward.
(2)Given that the composition of the feed liquid decreases from the original value of 0.6 to the lower bound of 0.5,ECC distribution profile at all stages moves backward.Combined with the ECC changing trend in Fig.4 and the step by step calculation model for ECC at each stage,the component content of Nd at the monitoring stage in the organic phase is 0.9592,which is lower than the expected value of0.9922.To satisfy the control requirements,the scrubbing capacity should be increased.In the same way,the scrubbing liquid flow-rate compensation valueΔVWof 0.9070 L·min−1is obtained.The flow-rate of the scrubbing liquid is adjusted from VW03.8960 L·min−1to VW4.8030 L·min−1at T3in Fig.6.Through regulating the flow-rates of exact and scrubbing liquid,ECC distribution control is realized and the product purity at both outlets satisfies the demands of 99.99%.
5.Conclusions
Due to the increasing random disturbance and inadequate prior knowledge of rare earth extraction process,the on-line measuring and automatic control are becoming more and more difficult.In this paper,the theory of counter current extraction is used to design the process parameters,and then a step by step model for ECC distribution at each stage is developed.Based on ECC changing trend of the monitoring stage and the mass balance model,the real-time adjusting of the parameters is employed to dynamically regulate ECC distribution.With the application of Pr/Nd extraction simulated process using the P507-HCL extraction system,the ECC distribution moving at all stages is measured in real time,and extract or scrubbing liquid flow-rate is dynamically compensated to control the product purity at both outlets.
Nomenclature
A the easy extracted component
a the purification factor of component A
B the hard-extracted component
b the purification factor of component B
CFthe concentration of the feed liquid,mol·L−1
CSthe concentration of the extractant saturation,mol·L−1
CWthe concentration of the acid liquid,mol·L−1
EMthe theoretical extraction ratio in extraction segment
EM′ the theoretical extraction ratio in scrubbing section
fAthe feeding liquid molar fraction of A
fBthe feeding liquid molar fraction of B
fA′ the outlet molar fraction of A in the organic phase
fB′ the outlet molar fraction of B in the aqueous phase
MFthe feed capacity,mol·min−1
m the number of the scrubbing stages
n the number of the extraction stages
PAthe easy extraction product purity of A
PBthe hard extraction product purity of B
S the extraction capacity,mol·min−1
VFthe flow rate of feed liquid,L·min−1
VF0the pre-setting flow rate of extractant liquid,L·min−1
VSthe flow rate of extractant liquid,L·min−1
VS0the pre-setting flow rate of feed,L·min−1
VWthe flow rate of scrubbing liquid,L·min−1
VW0the pre-setting flow rate of scrubbing liquid,L·min−1
W the scrubbing capacity,mol·min−1
YAthe component content of A in organic phase
YBthe component content of B in aqueous phase
YA,Kthe component content of A at the monitoring point at the time of K
YB,Kthe component content of B at the monitoring point at the time of K
ΔVSthe compensated flow rate of extractant liquid,L·min−1
ΔVWthe compensated flow rate of scrubbing liquid,L·min−1
β the separation factor between rare earth elements
ε the saponification degree of extractant
 Chinese Journal of Chemical Engineering2015年1期
- Chinese Journal of Chemical Engineering的其它文章
- Power consumption and flow field characteristics of a coaxial mixer with a double inner impeller☆
- Drag-induced breakup mechanism for droplet generation in dripping within flow focusing microfluidics☆
- Lattice Boltzmann simulation of double diffusive natural convection in a square cavity with a hot square obstacle
- Numerical simulation of steady flow past a liquid sphere immersed in simple shear flow at low and moderate Re☆
- Effect of sol size on nanofiltration performance of a sol-gel derived microporous zirconia membrane☆
- Mass transfer performance of structured packings in a CO2 absorption tower☆
