Characterizing the influence of stress-induced microcracks on the laboratory strength and fracture development in brittle rocks using a finite-discrete element method-micro discrete fracture network FDEM-μDFN approach
Pooy Hmdi,Doug Sted,Dvide Elmo
aSimon Fraser University,8888 University Drive,Burnaby,British Columbia,Canada
bNBK Institute of Mining Engineering,University of British Columbia,Vancouver,Canada
Characterizing the influence of stress-induced microcracks on the laboratory strength and fracture development in brittle rocks using a finite-discrete element method-micro discrete fracture network FDEM-μDFN approach
Pooya Hamdia,*,Doug Steada,Davide Elmob
aSimon Fraser University,8888 University Drive,Burnaby,British Columbia,Canada
bNBK Institute of Mining Engineering,University of British Columbia,Vancouver,Canada
A R T I C L E I N F O
Article history:
in revised form
9 July 2015
Accepted 22 July 2015
Available online 21 September 2015
Finite-discrete element method(FDEM)
Micro discrete fracture network(μDFN)
Brittle fracture
A B S T R A C T
Heterogeneity is an inherent component of rock and may be present in different forms including mineral heterogeneity,geometrical heterogeneity,weak grain boundaries and micro-defects.Microcracks are usually observed in crystalline rocks in two forms:natural and stress-induced;the amount of stressinduced microcracking increases with depth and in-situ stress.Laboratory results indicate that the physical properties of rocks such as strength,deformability,P-wave velocity and permeability are influenced by increase in microcrack intensity.In this study,the finite-discrete element method(FDEM)is used to model microcrack heterogeneity by introducing into a model sample sets of microcracks using the proposed micro discrete fracture network(μDFN)approach.The characteristics of the microcracks required to createμDFN models are obtained through image analyses of thin sections of Lac du Bonnet granite adopted from published literature.A suite of two-dimensional laboratory tests including uniaxial, triaxial compression and Brazilian tests is simulated and the results are compared with laboratory data. The FDEM-μDFN models indicate that micro-heterogeneity has a profound influence on both the mechanical behavior and resultant fracture pattern.An increase in the microcrack intensity leads to a reduction in the strength of the sample and changes the character of the rock strength envelope.Spalling and axial splitting dominate the failure mode at low confinement while shear failure is the dominant failure mode at high confinement.Numerical results from simulated compression tests show that microcracking reduces the cohesive component of strength alone,and the frictional strength component remains unaffected.Results from simulated Brazilian tests show that the tensile strength is influenced by the presence of microcracks,with a reduction in tensile strength as microcrack intensity increases.The importance of microcrack heterogeneity in reproducing a bi-linear or S-shape failure envelope and its effects on the mechanisms leading to spalling damage near an underground opening are also discussed.
©2015 Institute of Rock and Soil Mechanics,Chinese Academy of Sciences.Production and hosting by
Elsevier B.V.All rights reserved.
1.Introduction
Heterogeneity is an inherent component of rock and has a major influence on both the overall rock strength and the stress-induced fracture pattern at both the small(laboratory)and large(field)scales.Material heterogeneity is evident at varied scales from the microscale,e.g.grain scale heterogeneity,to the large scale,i.e. faults of several hundred meters length within a rock mass.The microscopic behavior of rock is governed by several parameters including the variation in grain size,shape and mineral composition as well as the presence of micro-defects,i.e.microcracks(Lan et al.,2010).For example,it has been reported that the compressive strength of a fine-grained granite(with an average grain size of 1 mm)can be nearly 10-20%greater than that of medium-grained granite(4 mm)(Martin and Stimpson,1994).
Stress-induced damage is a well-known phenomenon for samples extracted from deep boreholes,and the intensity of microcracking increases with depth.As more stress-induced microcracks are produced in the sample core,disking may occur(Fig.1).Martin and Stimpson(1994)concluded that stress-induced damage begins to affect the laboratory properties of Lac du Bonnet granite when the maximum in-situ stress exceeds about 10%of the unconfined compressive strength.Lim and Martin(2010)also demonstratedthat core disking initiates when the ratio of major principal stressto the tensile strength is around 6.5.Laboratory testing of samples taken at depths ranging from near-surface to 1000 m at the Underground Research Laboratory(URL)experiment in Pinawa, Manitoba,Canada showed that the physical properties of rocks such as strength,deformability,P-wave velocity and permeability are all influenced by an increase in microcrack intensity(Martin and Stimpson,1994).
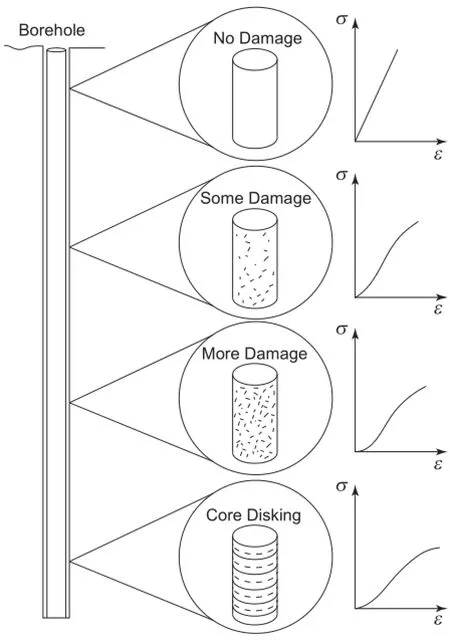
Fig.1.Relationship between stress-induced microcracking and depth.The stressstrain plots illustrate the change in behavior as microcrack intensity increases(after Martin and Stimpson,1994).
Although the importance of micro-structures,i.e.microcracks, on the mechanical behavior of rock samples has been long recognized,relatively little research has been carried out to quantify the effect of micro-structures on brittle rocks such as granite(Martin and Stimpson,1994).It has been shown that several stages of brittle fracturing process including crack closure,crack initiation, crack damage and peak strength are influenced by the presence of microcracks(Chernis,1984;Martin and Stimpson,1994;Diederichs, 2007).In this study,the effects of stress-induced microcracks on the mechanical behavior and fracture pattern of Lac du Bonnet granite are investigated numerically using a combined finitediscrete element method(FDEM)code,ELFEN(Rockfield,2012). The data from image analysis of thin sections illustrated by Lim and Martin(2010)are used to establish a micro discrete fracture network(μDFN)model which is then incorporated into the geomechanical model.The influence of microcracks is investigated by simulating a series of conventional laboratory tests including uniaxial,triaxial compression and Brazilian tests incorporating varied microcrack intensity,reflecting the increase in stress-induced microcracks with depth.Numerical results are compared with URL data presented in the literature(Martin and Stimpson,1994; Eberhardt,1998).Finally,the importance of microcracking on fracture mechanisms leading to spalling damage near an underground opening is briefly discussed.
2.The influence of microcrack heterogeneity on the brittle fracture process
Microcracks in crystalline rocks are formed when the localized stress concentrations exceed the local rock strength and can be classified into two groups:(1)natural microcracks,which are produced by natural processes including pressure or temperature over geological time or(2)stress-induced(mechanically-induced)microcracks associated with changes in stresses and stress concentrations during the coring process or excavation(Nur and Simmons,1970).According to Nadan and Engelder(2009),natural microcracks can be classified into three types:(1)healed microcracks often associated with fluid inclusion planes that formed during isobaric cooling,(2)filled microcracks containing foreign minerals,and(3)open microcracks produced during the isothermal decompression process and tectonic activities.Stress-induced microcracks due to the drilling process are common in rock cores taken from depth.Research has shown that drilling of a borehole results in stressconcentrations and redistribution of initial stresses;when the magnitude of stress concentrations exceeds the stress required to initiate a microcrack,a stress-induced microcrack may nucleate(Obert and Stephenson,1965;Stacey,1982;Lim and Martin,2010).There is a general correlation between the mean in-situ stress and the microcrack intensity(Carlson and Wang, 1986).Chernis(1984)examined microcrack intensity in Lac du Bonnet granite with respect to depth and concluded that the intensity of stress-induced microcracking in the samples extracted from 800 m depth is nearly twice that of samples from a depth of 480 m.
Natural and stress-induced microcracks can be differentiated by their surface morphology and orientation characteristics.Natural microcracks often have rough or irregular walls containing limited infill.Stress-induced microcracks are characterized by smooth and parallel walls,lack of infill or bridging material and an orientation usually parallel to the major principal stress,reflecting their extensional nature(Tapponnier and Brace,1976;Chernis,1984). With reference to the shape,microcracks can be classified,as shown in Fig.2,into three types(Lim et al.,2012):(1)Grain boundary cracks:microcracks formed on the boundary of grains;(2)Intragranular cracks:microcracks which are enclosed within mineral grains;and(3)Transgranular cracks:microcracks that cut across several mineral grains and grain boundaries.
Several experimental studies have been conducted in the past to analyze the modes of crack initiation and coalescence in laboratory samples containing one or several artificial flaws(Bobet and Einstein,1998;Wong and Einstein,2006,2007).Bobet and Einstein(1998)performed a series of laboratory uniaxial and biaxial compression tests to study the influence of confining pressure on the fracture coalescence of rock samples containing two pre-existing flaws.They suggested three principal modes of crack coalescence:the shear mode(S),the tensile(wing)mode(W)and the mixed shear/tensile mode(M),and concluded that formation of each crack coalescence is influenced by the flaw location,confining pressure,friction angle and heterogeneity.Several researchers have also attempted to simulate the crack coalescence in rock samples containingpre-existingflawsusingdifferentnumericalapproaches.Using a finite element code RFPA,Tang et al.(2001)studied the final fracture pattern in a rock sample with three preexisting flaws and concluded that crack coalescence follows a“weakest coalescence path”which is controlled by the geometrical location of crack with respect to each other.Yan(2008)simulatedthe crack coalescence of a rock sample with two pre-existing fractures using several numerical approaches:continuum method using Phase2(Rocscience Inc,2010),discontinuum method UDEC(Itasca,2010)and the hybrid method ELFEN(Rockfield,2012),and compared the results from these simulations.
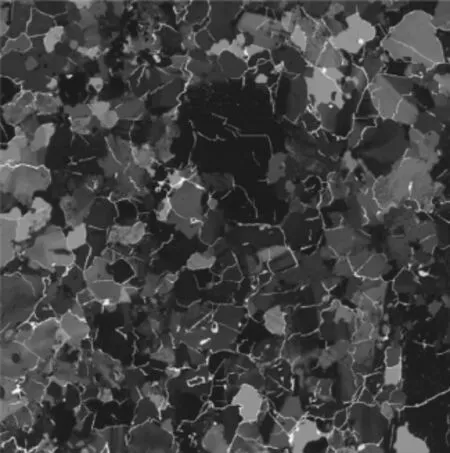
Fig.2.An example of a thin section of Lac du Bonnet granite showing the presence of microcracks.Image size is 8.3 mm×8.3 mm(Lim et al.,2012).
Regardless of the origin of the microcracks,the main role of microcrack heterogeneity is to act as stress concentrating mechanism that can produce local stress concentrations causing local failures which may ultimately result in failure(Dyskin,1999). Another role of microcracks in the fracturing process,noted by Dyskin(1999),is to promote stress fluctuations which can induce high local tensile stresses,and initiate local fracture even if the magnitude of external load is less than the material strength.Fig.3 illustrates an example of a simulated uniaxial compression test with pre-existing cracks using the hybrid FDEM code ELFEN,clearly showing the influence of pre-existing microcracks on the resulting stress fields.Due to microcrack heterogeneity,the tensile stress is concentered at the tips of microcracks.Wing cracks are formed as a result of tensile stress concentration when the local stresses exceed the local strength.By increasing the applied stress,additional wing cracks are formed and coalesce tocreatea largercrack(macrocrack)which eventually results in the ultimate failure of the sample.
3.Micro discrete fracture network(μDFN)
The discrete fracture network(DFN)method is being increasingly used to realistically consider the influence of discontinuity geometries within in-situ rock masses encountered in rock engineering projects.The general approach adopted in the DFN method is to treat fractures as discrete features whose properties,e.g.locations,sizes,orientations,are defined by random variables with inferred probability distributions(Xu and Dowd,2010).Dershowitz and Herda(1992)proposed a method of fracture intensity measures in one(linear),two(areal)and three(volume)dimensions that allow the quantification of fracture frequency.The fracture intensity measures proposed by Dershowitz and Herda(1992)have been proved as a useful quantifier for characterizing fractures and significantly improves discrete fracture analysis and modeling for mechanical applications.Fracture intensity measures are classified based upon the dimension of the sampling region and the dimension of the feature.In this study,the(areal)fracture intensity P21, which is the ratio of the sum of total fracture traces to the sampling area is used to quantify the microcrack intensity(Fig.4).
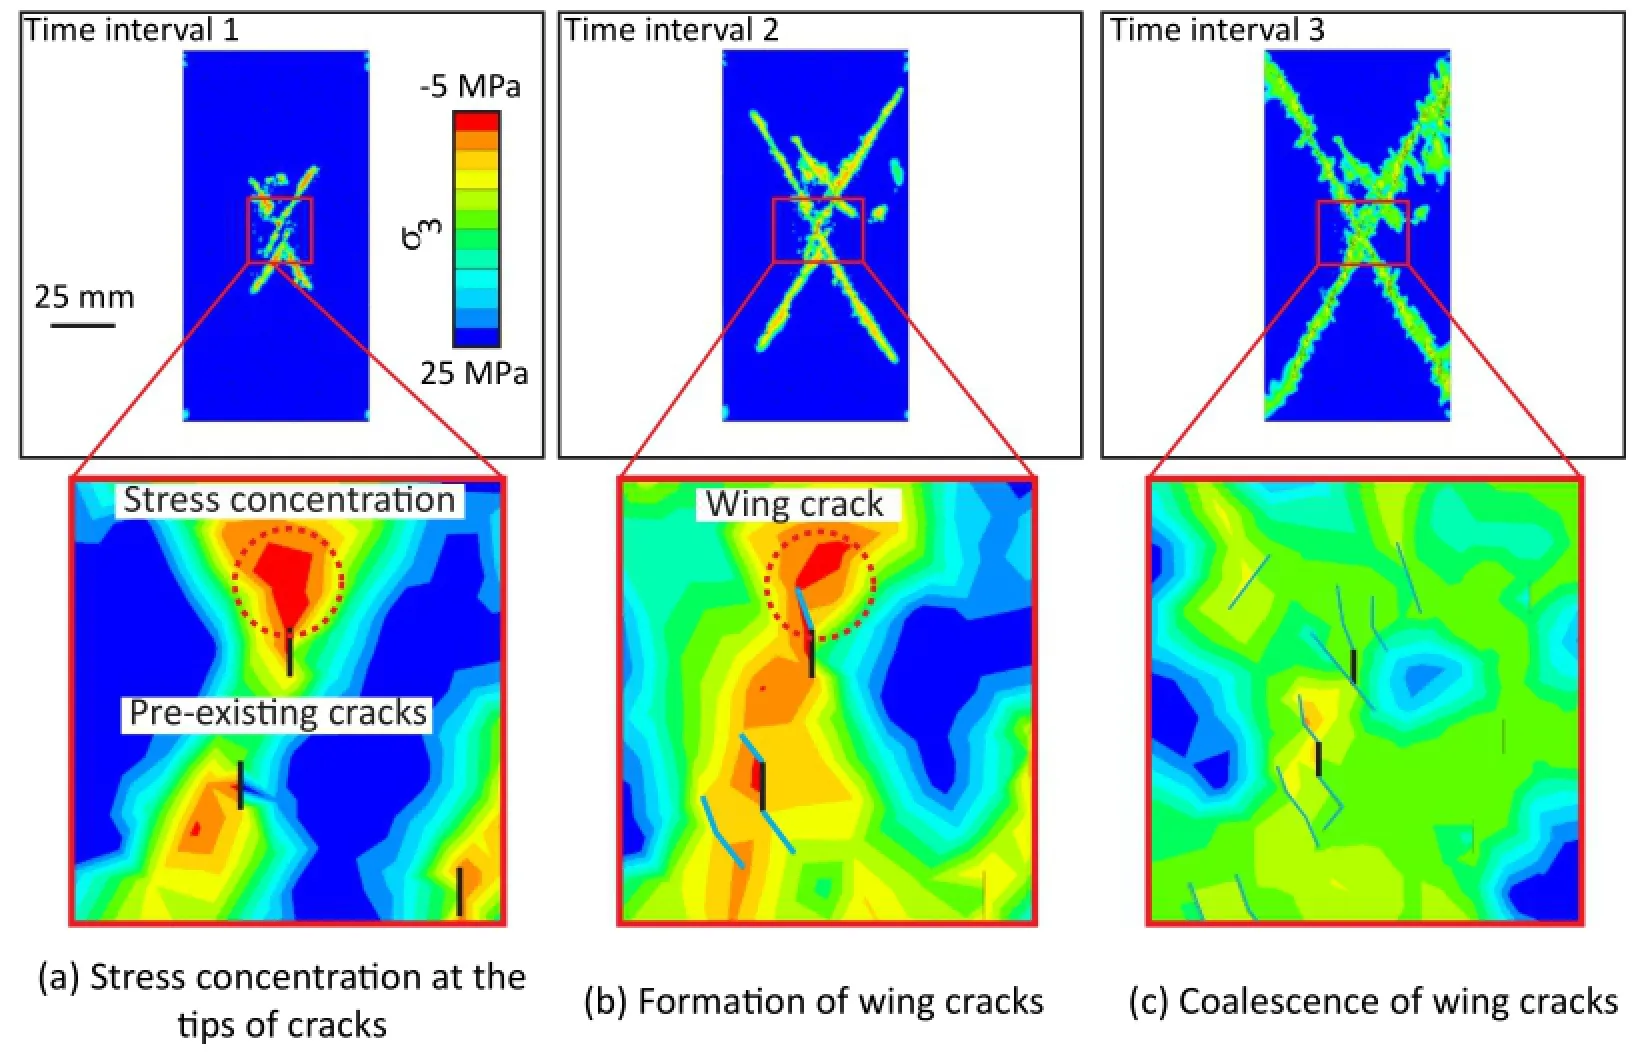
Fig.3.Uniaxial compression test of a sample with pre-existing microcracks simulated in ELFEN.(a)Stress concentration around tips of pre-existing microcracks,(b)wing cracks formation and(c)coalescence of wing cracks as the sample is further stressed.Red color denotes tensile regime.
The first stage in the process of creating DFN models at large scale is to collect discontinuity data using conventional discontinuity mapping techniques such as scanlines or window mapping of outcrops or remote sensing methods such as photogrammetry orlaser scanning.A new class of DFN is proposed here,referred to as μDFN,to differentiate the stochastic nature of microscale cracks from large scale discontinuities.At microscale(laboratory scale), data collected from image analysis of thin sections are used to build appropriateμDFN models.Input parameters then include microcrack size,orientation and intensity.
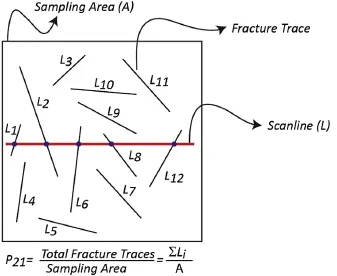
Fig.4.Concept of areal fracture intensity,P21,adopted in the FDEM modeling.
In this study,a DFN generatordeveloped byMayeret al.(2014)is used which by considering the geomechanical model mesh generation requirements allows seamless integration between the DF N and geomechanical simulation.An enhancement to the general Baecher disk model algorithm(Baecher et al.,1977)is implemented in the proposed algorithm with three added constraints including(1)a minimum overlapping/separation distance to prevent the development of unnecessarily small elements which would slow down overall numerical simulation run-times,(2)intersection distance to ensure that the intersection points between generated microcracks are spaced at a distance greater than the specified overlap/separation distance,and(3)intersection angle to ensure generated microcracks intersect at angles greater than the minimum internal angle used in the unstructured mesh generation. These three enhancements avoid the development of unacceptable microcrack configurations which cannot be incorporated into the numerical codes using standard meshing algorithms and free the user from the need to manually modify the generatedμDFN models prior to incorporation within numerical models.More details on the modified DFN algorithm and its application in different numerical codes can be found in Mayer et al.(2014)and Mayer(2015).
4.Lac du Bonnet granite
Considerable research has been done on Lac du Bonnet granite as part of AECL's URL experiment in Manitoba,Canada.Extensive laboratory testing has been carried out by numerous researchers(Chernis,1984;Martin and Stimpson,1994;Eberhardt,1998;Eberhardt et al.,1998;Lim et al.,2012)focusing on the effect of microcrack intensity on the physical properties of samples that were taken from different depths,ranging from the ground surface to 1000 m.Chernis(1984)examined several Lac du Bonnet granite samples obtained from different depths to study the characteristics of stress-induced and natural microcracks.Martin and Stimpson(1994)found that the laboratory P-wave velocity of Lac du Bonnet granite samples decreases continuously from ground surface to 1000 m depth.They attributed this continuous velocity reduction to an increase in microcrack intensity as the magnitude of in-situ stress increases with depth.Recent laboratory research by Lim et al.(2012)indicated that the volume of stress-induced microcracks increases linearly with sampling depth.The main characteristics of induced microcracks in Lac du Bonnet granite including microcrack origin,orientation,length and intensity were identified byLim et al.(2012)byanalyzing severalthin sectionsobtained from different depths.Grain size distribution plots from image analysis showed that the average grain size was 1 mm.The primary types of microcracks were classified as:(1)grain boundary microcracks,(2)intragranular microcracks,and(3)transgranular microcracks. Overall,it was observed that the intensity of all types of microcracks increases with depth.Lim et al.(2012)concluded that the microcrack length was very similar for each microcrack type regardless of the magnitude of stress-induced damage in the sample.The average length was reported to be 0.2-0.4 mm for intragranular microcracks and 1-2 mm for transgranular microcracks.The orientation of natural and stress-induced microcracks depends on the stress history and the current state of in-situ stress. Lim et al.(2012)compiled the results of microcrack orientation from each thin section and presented the data as rosette plots,as shown in Fig.5.They concluded that while the intragranular microcracks are fairly uniformly distributed,transgranular microcracks tend to be aligned perpendicular to the core axis with a very shallow dipping(sub-horizontal)orientation.Fig.5 presents the distribution of length and orientation of the transgranular and intragranular microcracks in Lac du Bonnet granite obtained from the URL 420-level.These data are used to create theμDFN models for importing into the FDEM models.
5.Modeling methodology
In this study,the influence of microcrack heterogeneity on the behavior of brittle rock is investigated using the combined FDEM code ELFEN(Rockfield,2012).This code can readily simulate the complete brittle fracture processes including crack initiation, propagation and coalescence.Due to the hybrid nature of the code, the transition from a continuum to a discontinuum state as the rock is loaded can be seamlessly modeled.The algorithm is such that if the failure criterionwithin the intact rock(initially represented as a finite element domain)is met,then a crack is initiated(Cai and Kaiser,2004),and the model evolves into a discrete element geometry.
Applicability of the combined FDEM to brittle fracture modeling has been demonstrated both at small and large scales by many researchers.Klerck(2000)carried out a series of two-dimensional(2D)uniaxial/triaxial compression and borehole breakout tests and illustrated the suitability of the FDEM for simulating both loaddisplacement response and the observed evolution of discrete fracturing.The mechanical behavior of anisotropic laboratory rock samples has been recently studied with the combined FDEM by Cai and Kaiser(2004)and by Lisjak et al.(2014)using Y-Geo code(Mahabadi et al.,2012a).Elmo and Stead(2010)used this method along with DFN to study the failure mechanism of fractured rock pillars.The application of the combined FDEM to large scale problems such as block cave mining was illustrated by Vyazmensky et al.(2010).
Here,2D uniaxial and triaxial compression tests are simulated on samples with a height of 100 mm and width of 50 mm.A 50 mm radius circular disc is modeled for the Brazilian test.TheμDFN models are incorporated into the intact rock medium to study the effect of micro-heterogeneity.SeveralμDFN models with increasing values of intensity(P21)are created to simulate an increased degree of sample disturbancewith depth.The material properties of Lac du Bonnetgraniteobtainedfromthepublishedliterature(Hajiabdolmajid et al.,2002),as listed in Table 1,are assumed.Inthis study,fracture energy(Gf)is estimated based upon the empirical relation presented by Zhang(2002),in which the mode I fracture toughness KICis related to the tensile strength by σt=6.88KICand fracture energy is then calculated as KI2c/E.Mechanical properties assigned to theμDFN models are also presented in Table 2.Zero tensile strength and cohesion are assumed for all microcracks and a friction angle of 26°.
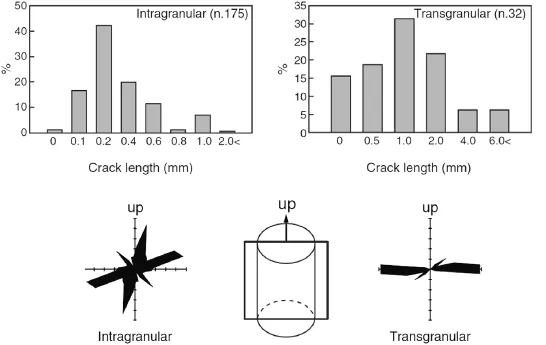
Fig.5.Distribution of length and orientation for intragranular and transgranular microcracks in Lac du Bonnet granite obtained from the URL 420-level(Lim et al.,2012).
Loading is simulated by a constant velocity of 0.5 mm/s applied on the upper platen and the reaction and displacement of the platen are continuously monitored.A sensitivity analysis has been carried out to ensure that the assumed loading rate has no significant effect on the simulation results.Triangular elements with an average size of 0.5 mm,corresponding to the average grain size observed from image analysis,are selected for this study.This results in approximately 35,000 unstructured elements for the simulations of uniaxial and triaxial compression tests and 55,000 elements for the Brazilian test.To capture a more realistic fracture pattern,an intra-element fracturing scheme is used,allowing new fractures to cut across the existing meshed elements(Fig.6).
The geometrical properties of the microcracks used to create the μDFN models are listed in Table 3.Two sets ofμDFNs are assumed, one representing the intragranular and the other the transgranular microcracks.The spatial location of the microcracks is modeled assuming a homogeneous(Poisson)algorithm.Since DFN models are based on stochastic distribution,each creation of a model will result in a different realization.In this study,three realizations for each data set are generated.The intensity of microcracks is measured by the microcrack intensity P21and the distribution of orientations identified using the crack rosette plot(Fig.7).The conventional method todeterminethe microcrack intensity parameter at the laboratory sample scale is to consider the whole sample area as the sampling area.This approach is appropriate for uniaxial and triaxial compression tests in which the whole sample is loaded.In the Brazilian test,however,only a narrow region along the sample diameter is significantly influenced by loading,hence the characteristics of microcracks in this area determine the overall behavior of the test.Two methods of identifying the microcrack intensity are proposed which are referred to as:(1)distributed microcrack intensity and(2)focused microcrack intensity.In determination of distributed microcrack intensity,the whole area of sample is considered while for focused microcrack intensity,only the particular sample area influenced by loading is considered. Since the testing configuration is taken into account in the determination of sampling area in the focused microcrack intensity approach,a better understandingof influence of microcracks can be achieved.In this study,the distributed microcrack intensity parameter is considered for simulations of uniaxial and triaxial compression tests and focused microcrack intensity for Brazilian tests.The concept of focused microcrack intensity is discussed in more detail in Section 7.1.

Table 1 The assumed intact rock properties of Lac du Bonnet granite(Hajiabdolmajid et al., 2002).

Table 2 Assumed properties of pre-existing and newly generated microcracks considered in this study.
6.Modeling of uniaxial and triaxial compression tests
A series of uniaxial/triaxial compression tests with varied microcrack intensities is modeled to account for an increase in stress-induced microcracks with depth.Fig.8 shows the simulated models and their associated microcrack rosette plots.As mentioned above,threeμDFN realizations are created for each data set.A wide range of triaxial compression tests from low(2 MPa)to high(50 MPa)confinement is simulated for each model to investigatethe influence of confining pressure on the behavior of the rock sample.

Fig.6.Crack insertion procedure in ELFEN showing(a)actual failure direction defined by a weighted-average configuration,(b)intra-element fracturing,and(c)inter-element fracturing(Rockfield,2012).

Table 3 Characteristics of microcracks used in this study.
6.1.Influence of microcrack intensity on the uniaxial compression test
The influence of sample size on rock strength has been widely discussed in the geotechnical literature,and it is generally accepted that there is a significant strength reductionwith increasing sample size.Hoek and Brown(1980)suggested an empirical relationship σcd=σc50(50/d)0.18that relates the uniaxial compressive strength(UCS)σcdof a rock specimen with a diameter d(in mm)to the UCS σc50of a 50 mm diameter sample.They concluded that the strength reduction is attributed to the greater opportunity for failure through and around grains and pre-existing microcracks.As the sample size increases,more defects can be included in the test sample contributing to a strength reduction.This relationship also suggests that when a sufficiently large number of defects are included in the sample,the strength may reach a constant value. This corresponds to the representative elementary volume(REV)which by definition is the minimum sample size at which the test results become independent of size.
Complete simulated stress-strain curves for an intact rock sample and samples with microcrack intensity of P21=0.063 mm/ mm2and 0.21 mm/mm2are presented in Fig.9.The plot shows that the modeled peak strength of the rock sample decreases with increase in microcrack intensity.Wawersik and Fairhurst(1970)classified the post-peak behavior of rocks under uniaxial conditions into two classes:Class I and Class II.According to Fig.9,the post-peak behavior for all model simulations can be classified as Class I,implying that fracture propagation is stable such that work must be done on the specimen for an incremental decrease in loadcarrying ability.All three models exhibit a brittle post-peak behavior.Fig.10 shows the fracture evolution at selected stress levels for the models presented in Fig.8,indicating stages of crack initiation,propagation and coalescencewith increasing load.Due to lack of confining pressure,fractures parallel to the direction of the major principal stress(vertical in this case)are formed.More details concerning the influence of microcracks on the simulated fracture pattern is presented in Section 6.4.
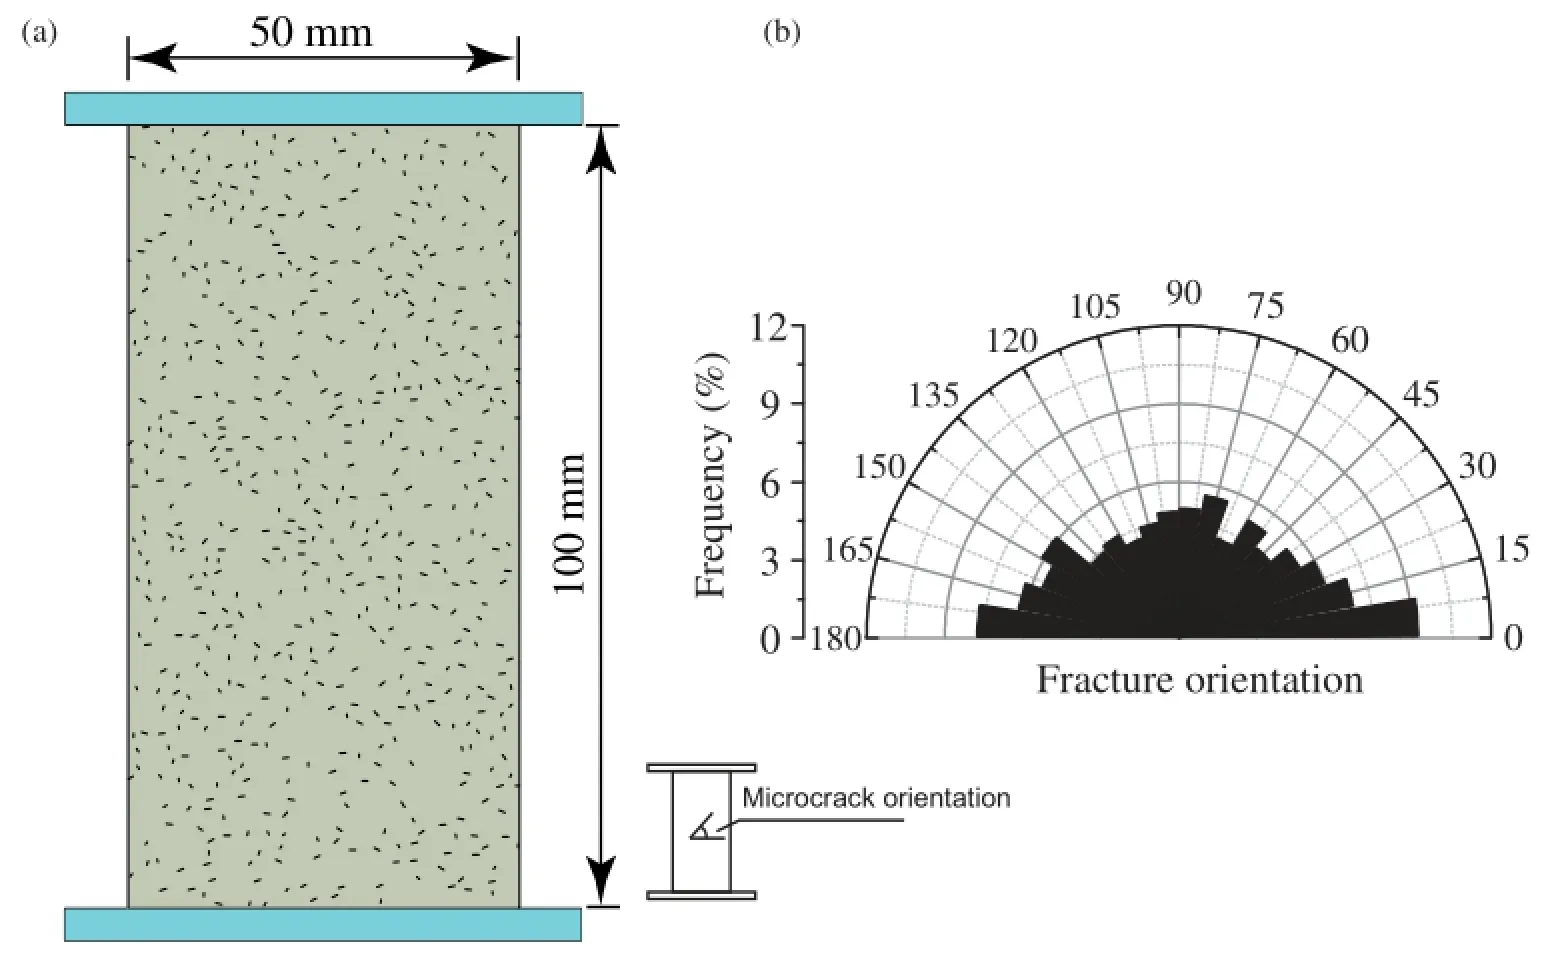
Fig.7.An example of simulated sample with microcracks.(a)2D sample with microcracks for uniaxial and triaxial compression tests.(b)Corresponding rosette plot showing the frequency of generated microcracks with respect to horizontal.Fracture orientation is in degree.

Fig.8.Modeled samples with varied microcrack intensities for uniaxial and triaxial compression tests.Three realizations are generated for each microcrack intensity.The diagrams show the associated rosette plot for each model.Fracture orientation is in degree.
Fig.11 shows the UCS of all simulated models as a function of microcrack intensity,P21,indicating a substantial reduction in strength with an increase in microcrack intensity.The UCS decreases from approximately 190 MPa to as low as 100 MPa with an increase in microcrack intensity from 0 mm/mm2to 0.2 mm/mm2. This agrees well with the laboratory results of the URL experiment in which the UCS of samples obtained from the 420-level was roughly 30%less than that from surface.The graph also suggests that the strength reduction continues up to a certain P21and then levels off.The best-fit curvetothe data points,as shownin Eq.(1),is an exponential decay function agreeing with the experimental observations proposed by Hoek and Brown(1980).The results clearly show the importance of microcrack heterogeneity particularly at zero confinement which is often the case at the boundary of unsupported underground excavations.

Martin and Stimpson(1994)complied the results of laboratory uniaxial compression tests as a function of depth(Fig.12)and concluded that despite some scatter in the strength response,the UCS of Lac du Bonnet granite decreases steadily with depth.In the same plot,the results of the FDEM-μDFN numerical simulations for the uniaxial compression tests are superimposed to show therelationship between the UCS and fracture intensity.Although no direct correlation can be found between depth and microcrack intensity,a reasonable agreement between the experimental observations and the numerical results can be observed from this figure. 6.2.Influence of microcrack intensity on the triaxial compression test
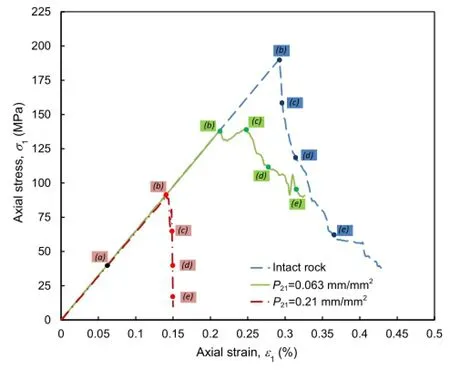
Fig.9.Stress-strain curves for simulated rock samples with P21=0 mm/mm2, 0.063 mm/mm2and 0.21 mm/mm2.The letters a-e correspond to the fracture evolution presented in Fig.10.
The simulated results of uniaxial and triaxial compression tests are compiled and the strength envelopes in terms of major and minor principal stresses are illustrated in Fig.13.It is clear from this figure that the strength reduces as microcrack intensity,P21,increases.The UCS of the most disturbed samples with P21=0.2 mm/ mm2is approximately 50%less than that of the intact rock,showing the importance of microcrack heterogeneity at zero confinement. The strength difference between samples with microcracks and the intact rock sample decreases with increase in confining pressure(Fig.14).Thestrengthdifferencebetweensampleswith P21=0.2 mm/mm2and intact rock decreases to only 10%at a confining pressure of 50 MPa.This is due to the fact that at high confinement,the influence of pre-existing microcracks is suppressed and cracks cannot propagate easily.Lower stress concentrations are produced at the tips of pre-existing microcracks as confinement increases,contributing to an increase in the strength.
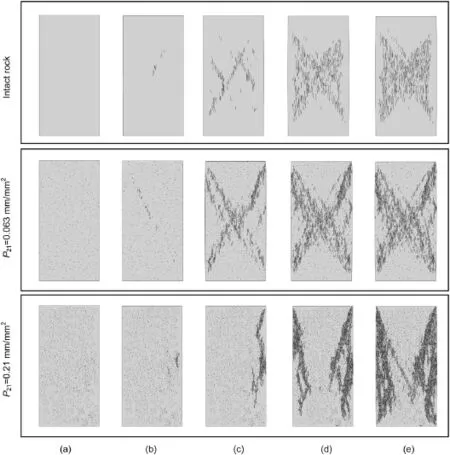
Fig.10.Fracture evolution in the simulated uniaxial compression test on intact rock and samples with microcrack intensities of P21=0.063 mm/mm2and 0.21 mm/mm2.Letters ae correspond to the different stress levels indicated in Fig.9.
Recent studies(Martin,1997;Hajiabdolmajid and Kaiser,2003;Diederichs,2007)have shown that,contrary to the fundamental Mohr-Coulomb criterion assumption that the cohesive and frictional components of strength are mobilized simultaneously,in brittle failure,the frictional strength is only mobilized after a significant amount of the rock's cohesive strength is lost.Kaiser et al.(2000)concluded that a bi-linear or S-shape criterion is required to properly describe the entire failure envelope from lowconfinementsplitting/spalling to high confinement shear failure.The preliminary results show the role of microcrack heterogeneity in reproducing a bi-linear strength envelope.Similar behavior was also observed by Lisjak et al.(2014)over laboratory simulations of Opalinus Clay.While samples without microcracks exhibit a linear failure envelope,the strength envelope tends to increasingly become bi-linear as more microcracks are incorporated into the sample.This can be clearly observed in the sample with a microcrack intensity P21=0.2 mm/mm2as the strength curve has a bilinear trend.
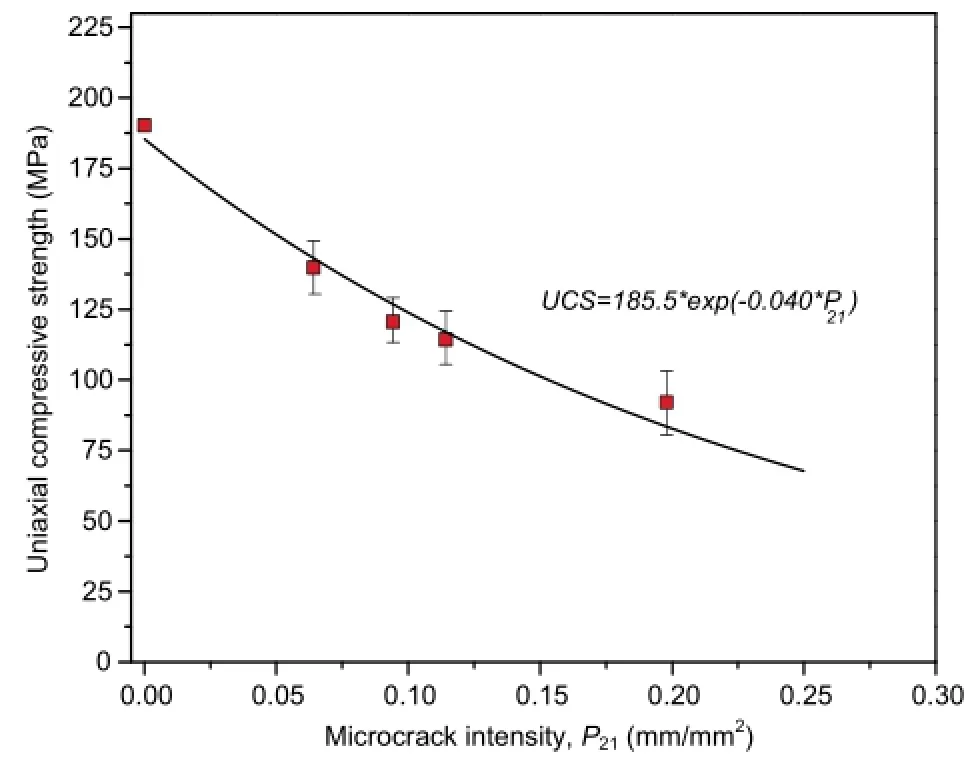
Fig.11.The influence of increasing microcrack intensity on the UCS.
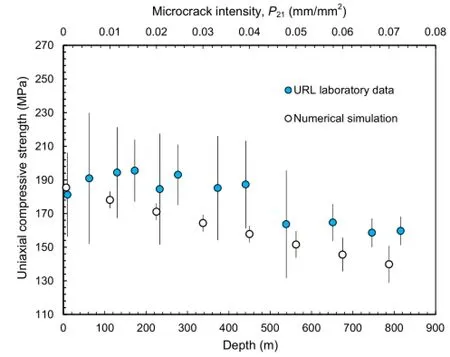
Fig.12.Comparison between the UCS obtained from the URL laboratory testing and numerical simulations.The laboratory results are plotted against depth and numerical results as a function of the microcrack intensity,P21.
6.3.Estimation of cohesion and friction angle
Uniaxial and triaxial results for all simulated models together with URL 420-level laboratory data were analyzed using the Hoek-Brown failure criterion(Hoek and Brown,1980).The Hoek-Brown criterion is expressed in terms ofσ1andσ3as whereσciis the UCS of the intact rock material;m,s and a are the empirical constants.

Hoek-Brown parameters for the simulated models and the URL laboratory data are listed in Table 4 and the resulting strength envelopes are presented in Fig.15.As shown in Fig.15,the failure envelope of the URL 420-level laboratory tests falls between the modeled strength envelope for sample with P21=0.063 mm/mm2and 0.12 mm/mm2indicating the possible magnitude of microcrack intensity at the 420-level.
Laboratory results of uniaxial and triaxial compression tests, conducted by Martin and Stimpson(1994)on samples taken at different depths,revealed that the stress-induced microcracks only reduce the cohesive component of the strength alone,and the friction angle is essentially unaffected by microcracking.This phenomenon has also been reported for other rock types,e.g.marble(Gerogiannopoulos,1979;Hoek,1983).
To investigate if such behavior can also be reproduced numerically,the equivalent Mohr-Coulomb parameters,cohesion and friction angle,from the nonlinear Hoek-Brown failure criterion for each simulated sample are determined and the results are presented in Fig.16.This analysis is carried out using the RocData(Rocscience Inc,2007)program.As described by Hoek et al.(2002), the equivalent Mohr-Coulomb parameters are obtained by fitting an average linear relationship to the Hoek-Brown strength curve forarangeofminorprincipalstressvaluedefinedby σt<σ3<σ3max,whereσ3maxis the upper limit of confining stress over which the relationship between Hoek-Brown and Mohr-Coulomb criteria is considered.The numerical results show that the presence of increased microcracking reduces the cohesive component of strength,and the frictional component remains essentially unaffected.The cohesion of the sample with P21=0.2 mm/mm2is roughly 26 MPa which is approximately 25%less than that of the intact rock.In contrast,for the same samples the frictional component remained constant at 51.2°.
6.4.Influence of microcrack intensity on the fracture development in laboratory compression
It is well-recognized that heterogeneity plays an important role in the formation of local tensile stress concentrations.Crack growth(crack initiation and propagation)depends significantly on the material heterogeneity(Dyskin,1998).The fracture process in heterogeneous materials under compression comprises three stages:(1)accumulation of wing cracks formed under compression at tips of pre-existing defects/cracks,(2)formation of larger cracks also termed“mesocracks”,and(3)development of unstable macrocracks which eventuallylead to failure of the sample(Fig.17).The final failure mode observed at the end of a compression test is a product of the accumulation of microcracks that coalesce to form a macro-failure surface.
The failure mode of heterogeneous rocks under compressive loads can be divided into three main types:axial splitting,shear(oblique)failure and spalling(Dyskin,1998).Axial splitting is,when the rock sample breaks into a number of columns,parallel to the direction of compression.Shear/oblique failure occurs when one or two inclined macrocracks split the sample into two and finally spalling occurs at where small rock pieces eject from the surface of specimens making the sample thinner and eventually leading to ultimate failure.Axial splitting and spalling are two common modes of brittle rock failure at low confinement in highly stressed environments.Axial splitting is a common failure mode in the laboratory unconfined compression tests on brittle rocks.Spalling damage is often observed near excavation boundaries in unsupported tunnels where the confinement is low.These two modes of failure,however,are suppressed by increased confining pressuresas reported experimentally by Paterson and Wong(2005).As suggested by Martin(1997),spalling is the development of visible extension fractures under compressive loading,and the direction of spalling fractures or axial splitting is normally parallel to the direction of the major principal stress.Formation of a particular type of failure is controlled by the loading conditions as well as the material microstructure(Paul,1968).
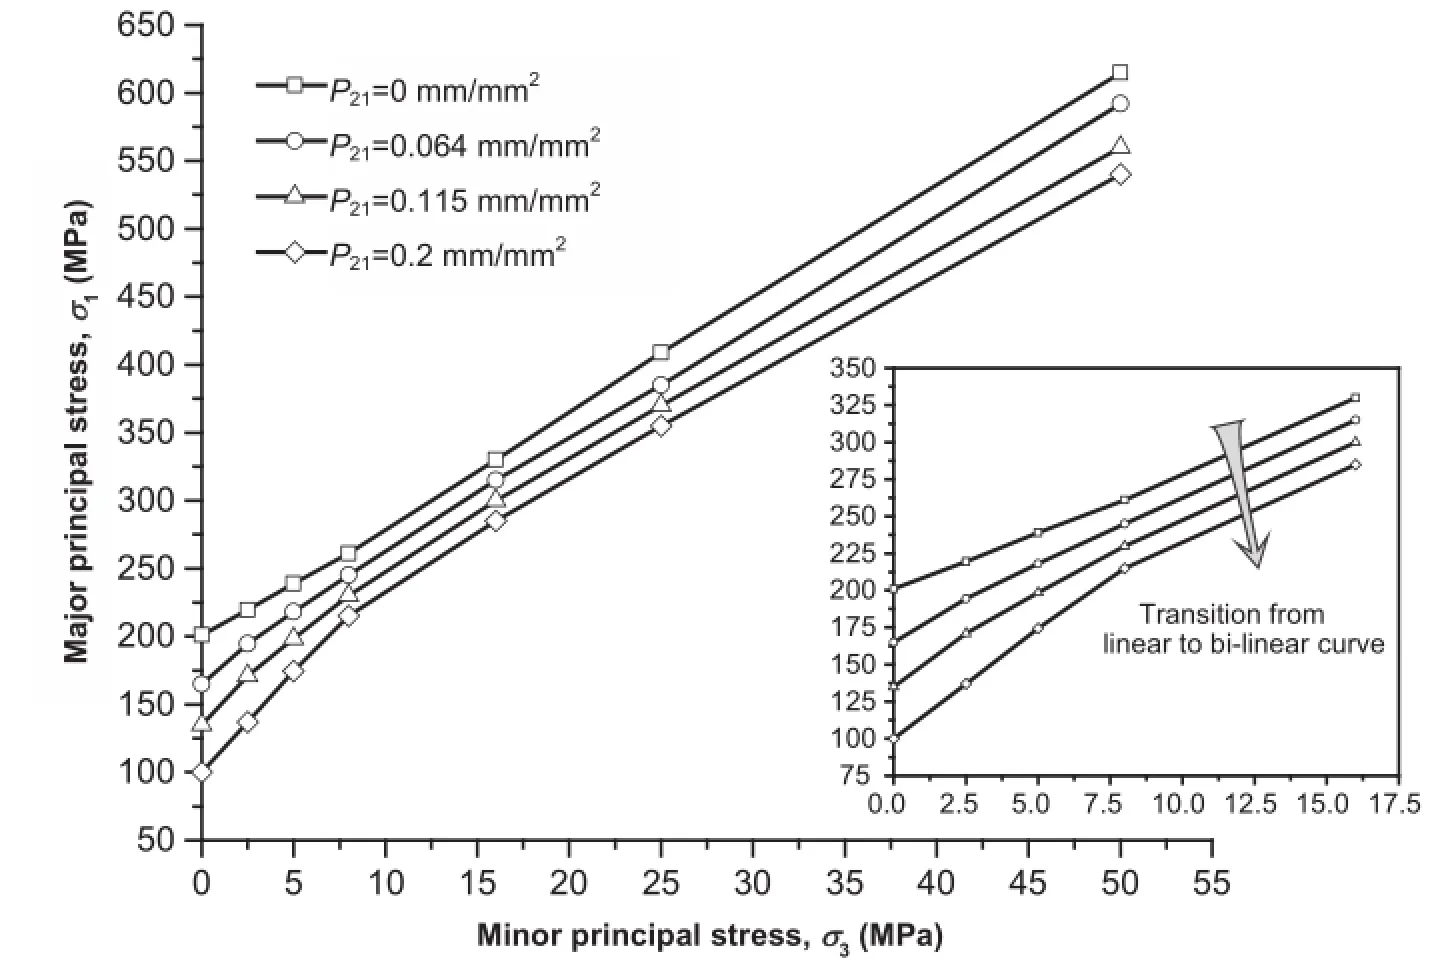
Fig.13.The results of uniaxial and triaxial compression tests carried out using ELFEN on samples with various microcrack intensities.This figure clearly shows the effect of preexisting cracks on the strength of the rock samples.

Fig.14.The percentage of strength reduction for each data set compared to the strength of intact rock at the same confinement level.Note that the strength differences decrease with increasing confining pressure.
Selected plots of the final fracture patterns obtained from the ELFEN simulations as a function of confinement and microcrack intensity are shown in Fig.18,indicating that at unconfined or low confinement,the fracture pattern is dominated by axial splitting or spalling failure.Formation of axial splitting or spalling failure in the model depends upon the intensity of microcracks within the rock sample.Axial splitting is evident for the intact rock sample underunconfined conditions.As microcrack intensity in the sample increases(the population of microcracks increases),wing cracks are formed at the tips of existing microcracks particularly near the surface of the sample where the confinement is low.This progressive crack formation eventually causes failure in the form of spalling.As the confinement increases for the intact rock sample, longitudinal fractures tend to be suppressed in favor of a welldefined shear band.Similar behavior can also be observed for heterogeneous samples with increasing confinement.In both cases, the formation of a primary and secondary shear band is apparent under confined conditions.A transition from an axial splitting or spalling to localized shear band with increasing confinement is clearly observed in Fig.19 which shows the direction of stressinduced fractures with respect to horizontal.The relative frequency of fractures oriented in a vertical direction for simulated intact samples decreasesfrom60%toas lowas 20%with an increase in confinement from 0 MPa to 25 MPa.Such a change in response corresponds well with the experimental results of uniaxial and triaxial compression tests on brittle rocks reported by Diederichs(2007),in which shear failure becomes the primary mode of failure with increasing confinement.

Table 4 Hoek-Brown parameters for the simulated models and the URL laboratory data.
7.Influence of microcrack intensity on the Brazilian test
The Brazilian test was developed to overcome the difficulties associated with sample preparation and performing a direct tension test.The Brazilian test consists of compressing a circular rock disc diametrically to failure.The compression load induces tensile stresses normal to the vertical loading diameter.The maximum tensile stressobtained is taken as theindirecttensile strength of the rock.
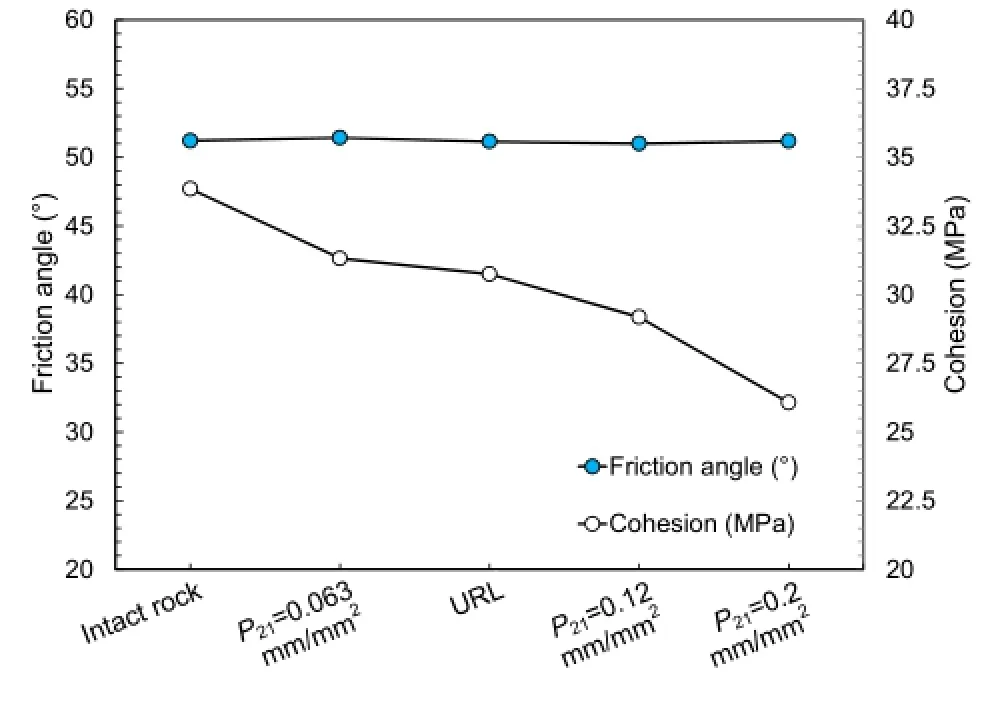
Fig.16.Cohesion and friction angle of simulated numerical models and the URL 420-level laboratory results.The graph shows a reduction in cohesion as microcrack intensity increases.Note the friction angle is essentially unaffected.
Hondros(1959)proposed a set of relationships to determine the complete stress distribution within a Brazilian disc.These equations showed that the maximum tensile stress occurs under the loading diameter and the indirect tensile strength can then be calculated by the following formula:

where P is the failure load(N);r and t are the radius and thickness(mm)of the rock disc,respectively.
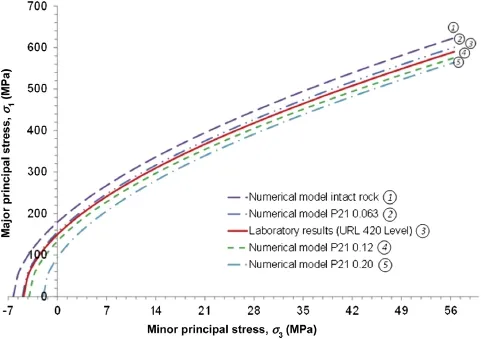
Fig.15.Theσ1vs.σ3strength envelope obtained from laboratory testing of the URL experiment at the 420-level and from numerical modeling assuming varied microcrack intensities.
According to the Griffith criterion,the center of Brazilian disc is the point of crack initiation at which the conditions for tensile failure are first met.Heterogeneity is found to play an important role in the overall behavior of rock disc during Brazilian testing.Numerically,the influence of heterogeneity on Brazilian testing can be studied considering various types of heterogeneities including:(1)geometrical heterogeneity associated with different grain sizes,(2)mineral heterogeneity due to different grain mineralogies,(3)heterogeneity associated with anisotropy and planes of weakness, and(4)microcrack heterogeneity due to existence of natural/ stress-induced microcracks.
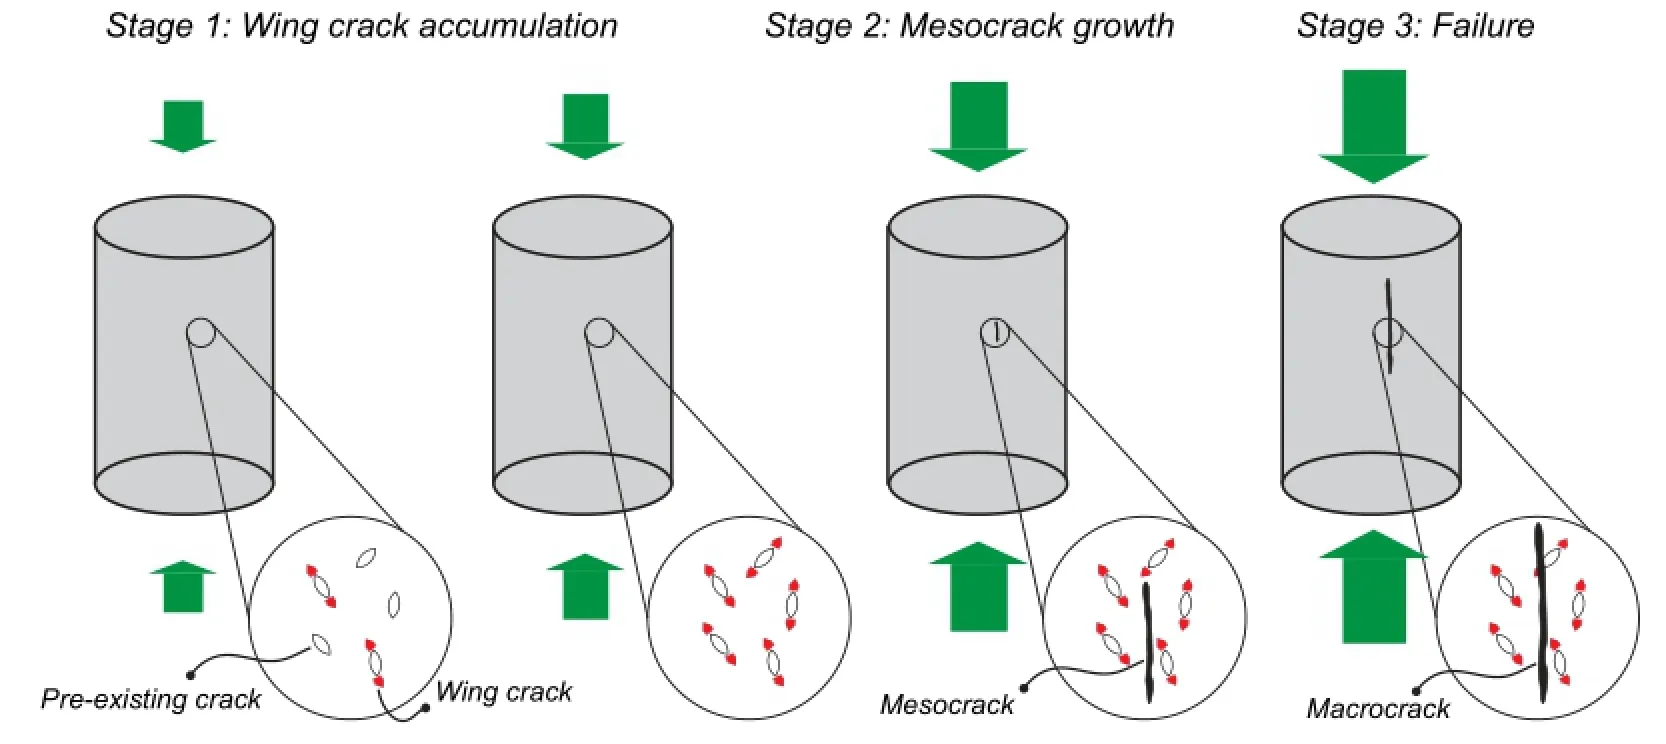
Fig.17.Three stages in the fracturing process in brittle rocks subject to compression(after Dyskin,1998).
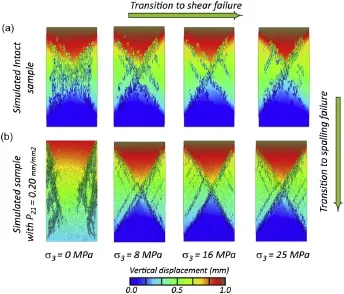
Fig.18.Final fracture patterns as a function of increasing confining pressure,σ3,for(a)intact rock sample,and(b)rock sample with P21=0.2 mm/mm2.
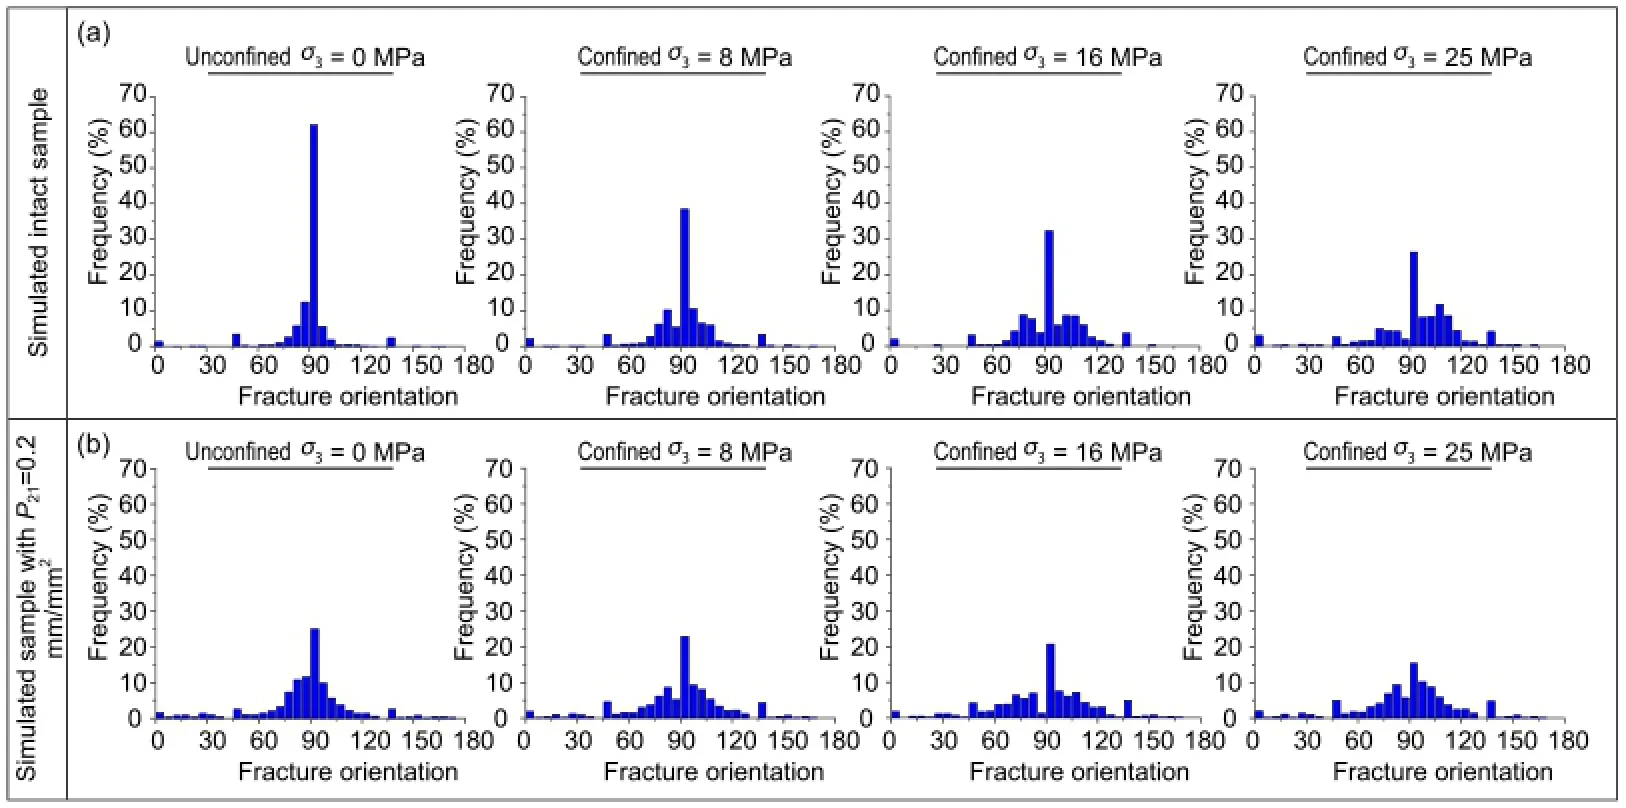
Fig.19.Orientation of stress-induced fractures with respect to horizontal for(a)intact rock and(b)rock sample with P21=0.2 mm/mm2for different confining pressures.
Several numerical studies have been conducted in recent years focusing on the effect of heterogeneity on the strength and fracture development in Brazilian tests.The influence of layering due to weakness planes on the response of a Brazilian disc was studied by Cai and Kaiser(2004)and Mahabadi et al.(2009).It was shown that rock anisotropy affects the fracture initiation and propagation,and hence the overall tensile strength of the rock.Orientation of weakness planes with respect to the loading direction appears to determine the shape and direction of the fracture pattern.Using YGeo code,Mahabadi et al.(2012b)investigated the influence of mineral and geometrical heterogeneity on the Brazilian test considering the actual size and mineral properties of the Brazilian disc and showed the importance of mineral size and composition in replicating laboratory results.The influence of pre-existing cracks on the response of Brazilian tests has been investigated bothexperimentally by Awaji and Sato(1978),Atkinson et al.(1982), Shetty et al.(1987)and Malan et al.(1994)and numerically by Tang et al.(2001)and Cai(2013).Most of these studies focused on the influence of one or more pre-existing fractures often in the center of a Brazilian disc.The main objectives of these tests were often to determine the Mode I and Mode II fracture toughness.In practice,however,rocks contain abundant microcracks which can have both different sizes and orientations,affecting both fracture development and the strength response.A full understanding of laboratory behavior therefore depends on recognizing the influence of these microcracks.In this section,the influence of stressinduced microcracks on the behavior of Brazilian discs is investigated using the FDEM code ELFEN.Data from image analysis of thin sections are used to establish theμDFN models.The influence of microcracks on the Brazilian test results is studied by simulating a series of numerical models with varying microcrack intensities.
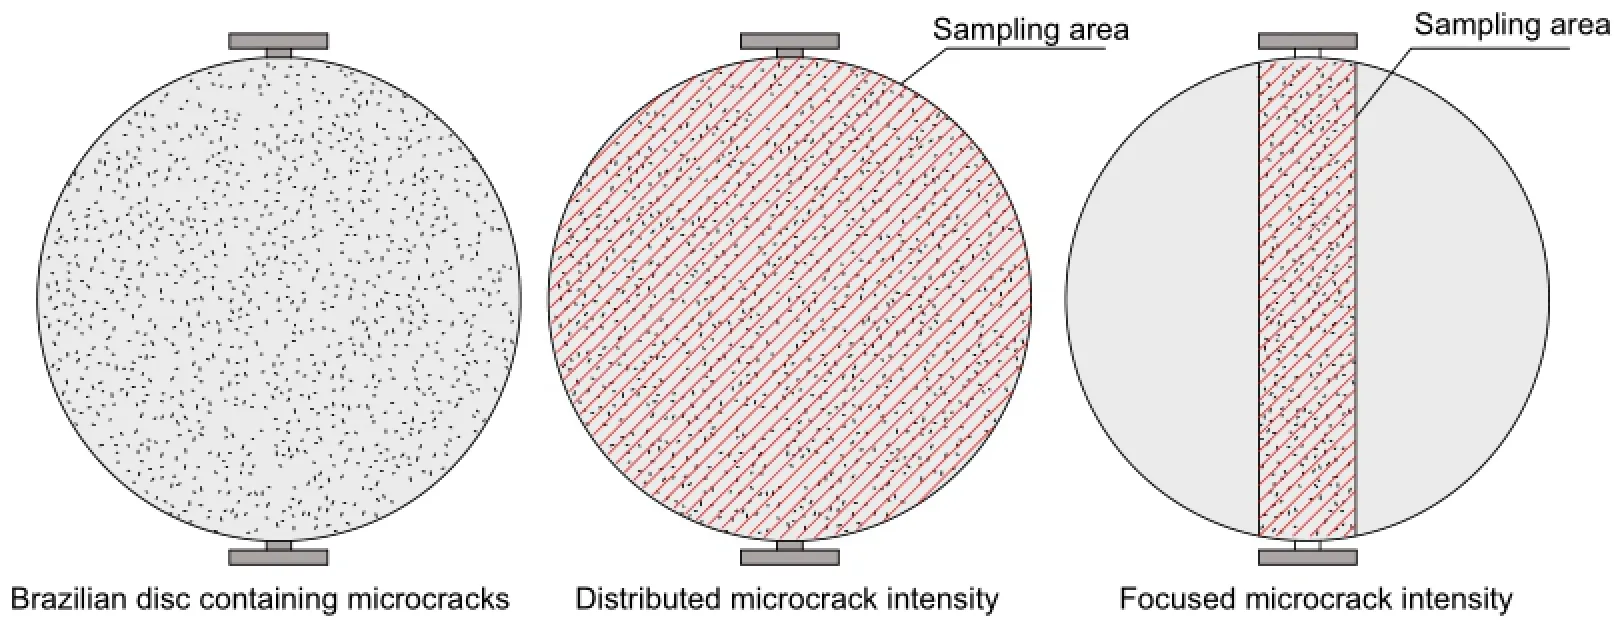
Fig.20.Two methods of characterizing microcrack intensity in Brazilian test.Concepts of distributed and focused microcrack intensities used in this study.
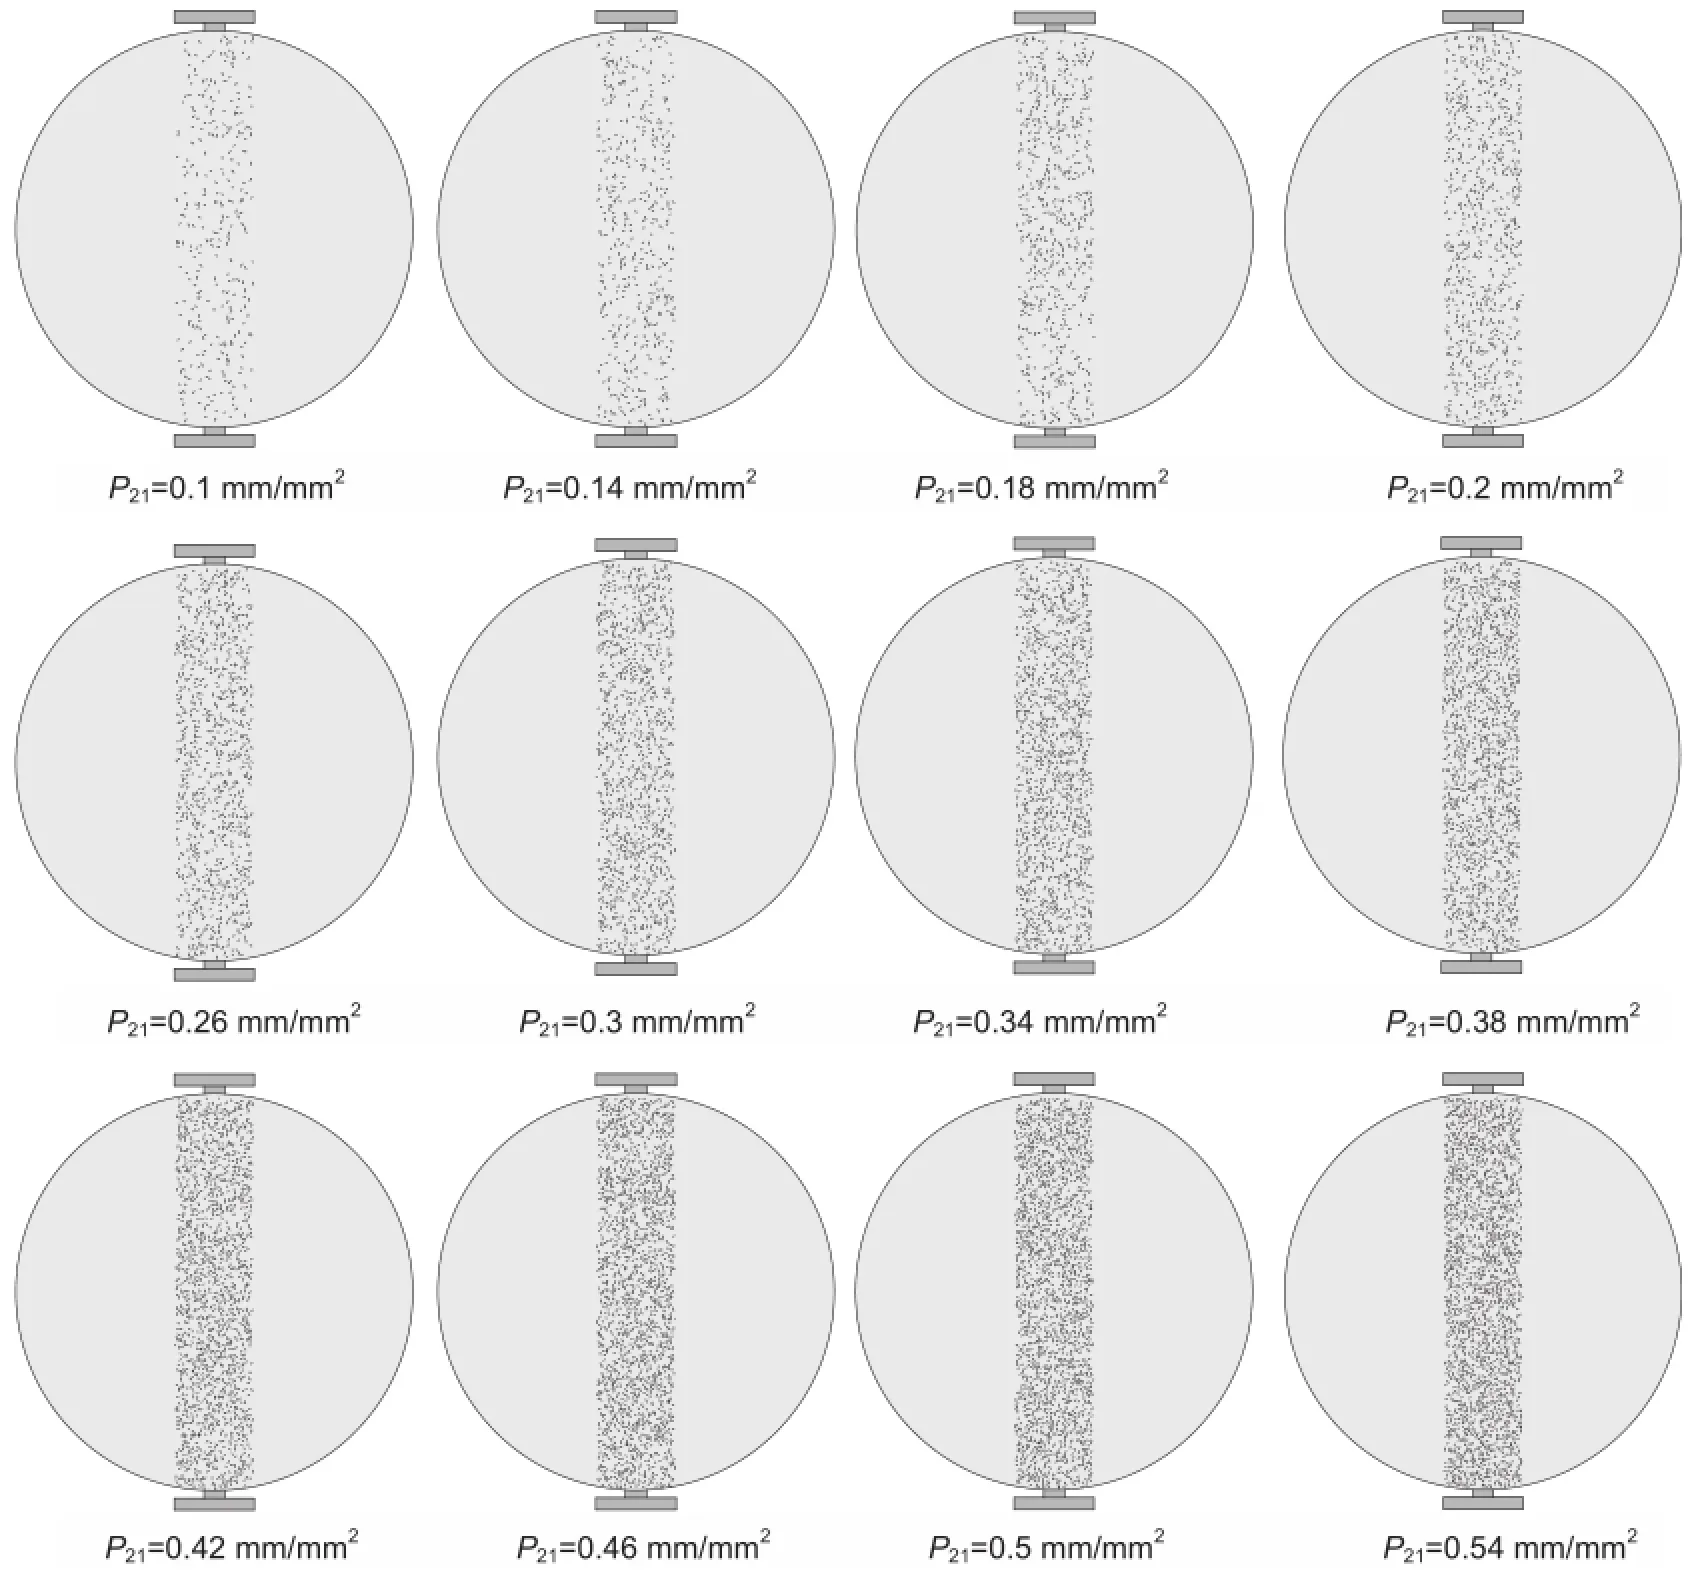
Fig.21.Simulated Brazilian discs with varying microcrack intensities.The area under the loading diameter is used in determining the focused microcrack intensity,P21.
7.1.Overall and focused microcrack intensity
Unlike uniaxial/triaxial compression tests in which the whole sample is loaded,in the Brazilian test,only a narrow region along the loaded diameter is influenced by loading and hence the rock condition in this area determines the overall tensile strength and fracture pattern.The conventional method to determine the microcrack intensity parameter in small laboratory scale samples is to consider the whole sample area which in the case of Brazilian test is the area of the circular disc.The microcrack intensity parameter calculated in this approach is referred here to as the distributed microcrack intensity.A focused microcrack intensity parameter is suggested in which both test and loading configurations are taken into account in the determination of the sampling area.The concept of distributed and focused microcrack intensities is illustrated in Fig.20.
The distributed microcrack intensity used in uniaxial/triaxial tests is found to be inappropriate in characterizing microcrack intensity for a Brazilian test.To improve our understanding of the effect of microcracking in a Brazilian test,we need to consider the characteristics of microcracking under the loading diameter.A series of Brazilian tests containing varying degrees of microcracking is modeled with only the area under the loading axis considered in determining the microcrack intensity.The simulated models and the associated focused microcrack intensity values are presented in Fig.21.
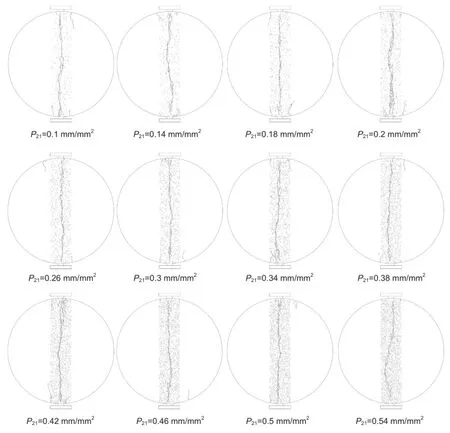
Fig.22.Fracture pattern for the twelve simulated models shown in Fig.21.
7.2.Influence of microcrack intensity on fracture development in the Brazilian test
In the Brazilian test,failure is usually through an extension fracture along the loaded diameter induced by tensile stresses acting normal to the loading direction.In addition to primary extensional fractures,subsidiary fractures forming wedges near the contacts with the platens have also been observed experimentally(Malan et al.,1994).Tests carried out by Jaeger and Cook(1979)indicated that the failure in the Brazilian tests initiates from the center of the disc and propagates towards the platens to form the primary failure and the wedges are only formed after the complete progression of primary fractures.
Fig.22 shows the final fracture pattern of the models presented in Fig.21.The results indicate that the fracture pattern is affected by the microcrack intensity.In all models,failure initiates at the center of the disc and propagates toward the platens.The final fracture pattern deviates from the vertical direction along the loading axiswith change in assumed microcrack intensity.It is noted that secondary and tertiary fractures are also observed in most of models.
7.3.Influence of microcrack intensity on the indirect tensile strength response
The URL direct tension tests showed that the tensile strength of the Lac du Bonnet granite is influenced considerably by stressinduced microcracks,with samples from the 420-level reported to have a tensile strength approximately 42%less than samples taken from the 240-level(Martin and Stimpson,1994).It should also be noted that in addition to the microcrack intensity,P21, additional characteristics such as connectivity of the microcracks, orientation and rock bridges also contribute to the ultimate strength of the Brazilian test.In this study,the focus is only on the effect of microcrack intensity on the overall tensile strength of the rock sample.
The tensile strength obtained from numerical simulations,as shown in Fig.23,illustrates that the indirect tensile strength decreases with an increase in microcrack intensity.The simulated indirect tensile strength decreases from 6.5 MPa to around 5.75 MPa with an increase in microcrack intensity from 0.1 mm/ mm2to 0.6 mm/mm2.The dispersion in the results clearly demonstrates the influence of microcrack location on the strength response and the need for multiple realization ofμDFN models.
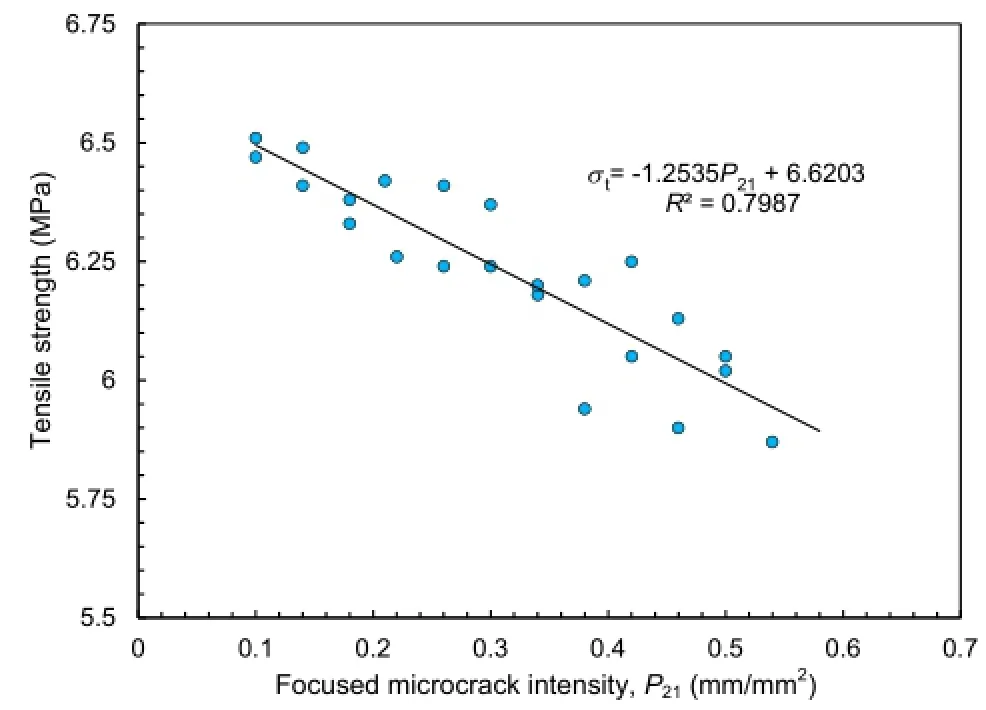
Fig.23.Tensile strength as a function of focused microcrack intensity for models presented in Fig.22.
8.Importance of microcrack heterogeneity on brittle failure at low confinement
Spalling damage is the accumulation of extensile cracks(Mode I)occurring in the absence of confining pressure and is a common failure mode at the boundary of underground excavations in brittle rock under high stress.Acoustic emission monitoring during laboratory uniaxial compression testing on brittle rock has revealed that crack initiation starts tooccurat a stress level between 30%and 50%of the UCS.It has also been found that spalling damage initiates adjacent to the tunnel boundary when the maximum inducedstress(σmax=3σ1-σ3)exceeds the crack initiation stress level determined in the laboratory(Martin et al.,1999).Diederichs(2007)described a number of mechanisms acting together to create this strength reduction under lowconfinement conditions in the vicinity of an excavation including(1)existence of pre-existing crack damage,(2)stress rotation and damage,(3)crack propagation and crack interaction,and(4)internal stress heterogeneity.The influence of pre-existing defects,i.e.microcracks and macrocracks, are acknowledged in most of these mechanisms and it is shown that the pre-existing cracks near the surface of an opening play an important role in the creation of tensile(splitting)fractures propagating sub-parallel to the free surface in the form of spalling damage(Germanovich and Dyskin,2000).The propagation of wing cracks at the tip of pre-existing cracks is highly sensitive to the confinement(Dyskin,1999;Diederichs,2007).The stress state that results in spalling damage is in the region of low confinement where the laboratory rock strength is typically defined by tensile strength and UCS(Fig.24),it is therefore important to recognize parameters affecting the UCS and tensile strength of brittle rocks to allow improved understanding of spalling damage mechanisms.
The FDEM-μDFN numerical results clearly show the importance of microcrack intensity on the strength response of brittle rocks such as Lac du Bonnet granite particularly in low confinement and tensile stress region.The presence of micro-defects results in(1)a reduction in the rock strength,(2)a change in the fracture pattern, and(3)a transition to bi-linear strength envelope.Fig.25 illustrates the complete strength envelope obtained from numerical modeling ofintactrockandrocksamplewithmicrocrackintensity P21=0.2 mm/mm2.The strength reduction and a change of failure mode are evident in the unconfined and tensile environment;consequently,a complete understanding of spalling damage depends on consideration of the influence of micro-defects,particularly microcracks.
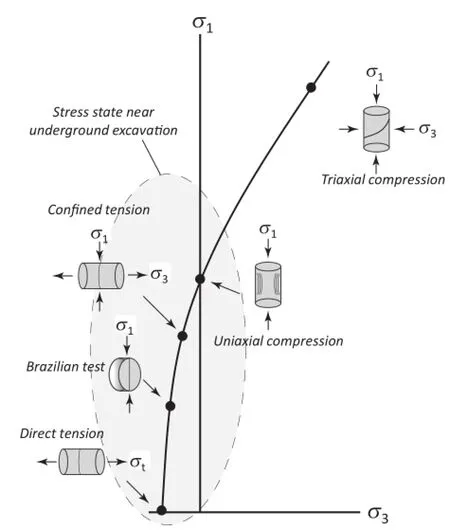
Fig.24.Conventional laboratory testing used to establish the failure envelope.The shaded area is the stress state near underground excavation.
9.Summary and conclusions
Stress-induced damage is commonly observed in samples extracted from deep boreholes and it has been shown that the microcrack intensity increases with depth.In this study,the influence of stress-induced microcrack on the failure of Lac du Bonnet granite samples is investigated using the combined FDEM code ELFEN(Rockfield,2012).A series of conventional laboratory testingincluding uniaxial,triaxial compression and Brazilian tests with varying microcrack intensities was simulated.Data collected from image analysis of thin sections including microcrack size,orientation and intensity were used to build appropriateμDFN models which were then incorporated into geomechanical models.A series of 2D uniaxial and triaxial compression tests with different confinements was simulated to derive the complete strength envelope. Two approaches for calculating the microcrack intensity are proposed:(1)distributed microcrack intensity and(2)focused microcrack intensity.The focused microcrack intensity,in which loading configuration is taken into account in the determination of the sampling area,is used for Brazilian test.
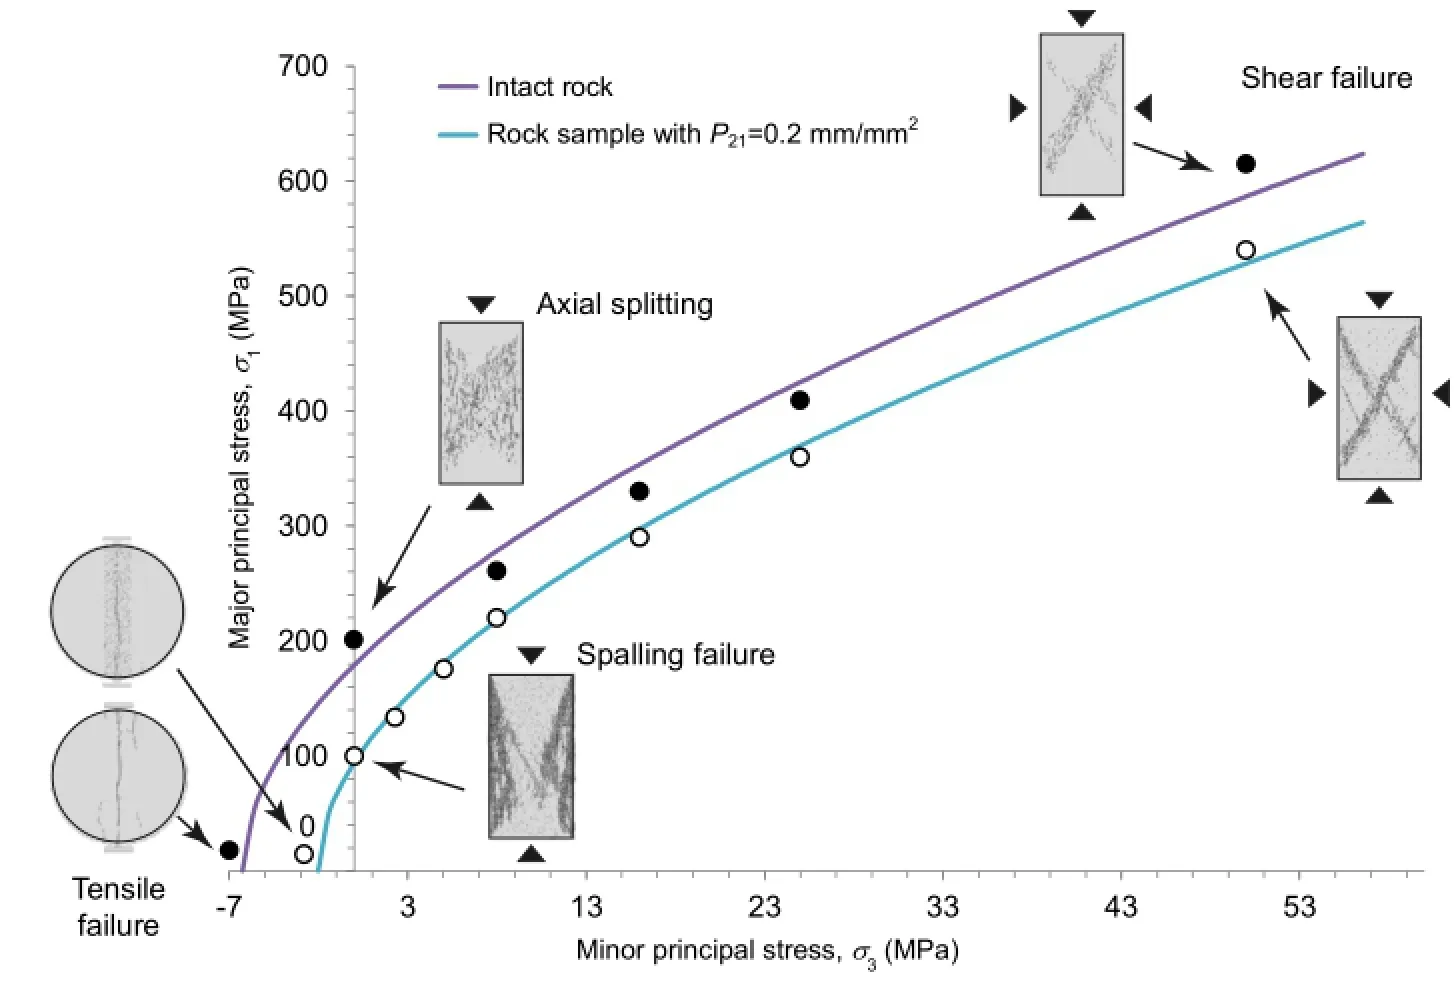
Fig.25.Complete strength envelope for intact and fractured rock samples from FDEM-μDFN numerical simulations.
Simulated results of uniaxial and triaxial compression tests show that the strength of the models decreases with an increase in microcrack intensity,P21.The simulated UCS decreases from approximately 190 MPa to as low as 100 MPa with an increase in microcrack intensity from 0 mm/mm2to 0.2 mm/mm2.This significant reduction at low confinement decreases with increase in confining pressure.An approximate 50%strength reduction between intact rock and a model with P21=0.2 mm/mm2reduces to only 10%with an increase in confining pressure from 0 MPa to 50 MPa.In addition to strength,the microcrack intensity also changes the failure mode of the samples.At unconfined or low confinement,the fracture pattern is dominated by axial splitting or spalling.Formation of axial splitting or spalling failure in the model depends upon the intensity of microcracks within the rock sample. Axial splitting is evident for intact rock samples under unconfined compression conditions.As the microcrack intensity increases, spalling damage becomes the dominant failure mode.With increasing confinement in both the intact and disturbed rock samples,longitudinal fractures tend to be suppressed in favor of a well-defined shear band.The numerical results from compression tests emphasize the role of microcracking in reproducing a bi-linear strength envelope,showing a transition from a linear to bi-linear strength envelope with increase in microcrack intensity.The numerical results also show that microcracking reduces only the cohesive component of strength with the frictional component remaining essentially unaffected,agreeing closely with laboratory observations.For the Brazilian test,a focused microcrack intensity approach was used to determine the microcrack intensity.FDEM-μDFN Brazilian simulations show that an increase in microcrack intensity from 0.1 mm/mm2to 0.6 mm/mm2reduces the overall tensile strength by 15%.
Finally,the implications of microcrack intensity on the mechanisms leading to spalling damage near an underground opening werebriefly introduced.Since the propagation of wing cracks at the tip of pre-existing cracks is highly sensitive to the confinement and the stress state that results in spalling damage is under low confinement,it is important to recognize the parameters affecting the UCS and tensile strength of brittle rocks.The FDEM-μDFN results show the significance of micro-defects on the strength reduction and spalling damage in Lac du Bonnet granite and emphasize that a better understanding of spalling failure depends upon fully considering the influence of microcracks.
Conflict of interest
The authors confirm that there are no known conflicts of interest associated with this publication and there has been no significant financial support for this work that could have influenced its outcome.
References
Atkinson C,Smelser R,Sanchez J.Combined mode fracture via the cracked Brazilian disk test.International Journal of Fracture 1982;18(4):279-91.
Awaji H,Sato S.Combined mode fracture toughness measurement by the disk test. Journal of Engineering Materials and Technology 1978;100(2):175-82.
Baecher GB,Lanney NA,Einstein HH.Statistical description of rock properties and sampling.In:Proceedings of the 18th US Symposium on Rock Mechanics;1977. 5C1-5C8.
Bobet A,Einstein HH.Fracture coalescence in rock-type materials under uniaxial and biaxial compression.International Journal of Rock Mechanics and Mining Sciences 1998;35(7):863-88.
Cai M.Fracture initiation and propagation in a Brazilian disc with a plane interface:a numerical study.Rock Mechanics and Rock Engineering 2013;46(2):289-302.
Cai M,Kaiser PK.Numerical simulation of the Brazilian test and the tensile strength of anisotropic rocks and rocks with pre-existing cracks.International Journal of Rock Mechanics and Mining Sciences 2004;41(Supp.1):450-1.
Carlson SR,Wang HF.Microcrack porosity and in situ stress in Illinois Borehole UPH 3.Journal of Geophysical Research Atmospheres 1986;91(B10):10421-8.
Chernis PJ.Comparison of the pore-microstructure of shallow and deep samples of the Lac du Bonnet granite.Technical Record 223.Ontario,Canada:Atomic Energy of Canada Limited;1984.
Dershowitz WS,Herda H.Interpretation of fracture spacing and intensity.In:Proceedings of the 33rd US Symposium on Rock Mechanics;1992.p.757.
Diederichs MS.The 2003 Canadian Geotechnical Colloquium:mechanistic interpretation and practical application of damage and spalling prediction criteria for deep tunnelling.Canadian Geotechnical Journal 2007;44(9):1082-116.
Dyskin AV.On the role of stress fluctuations in brittle fracture.International Journal of Fracture 1999;100(1):29-53.
Dyskin AV.Stress fluctuation mechanism of mesocrack growth,dilatancy and failure of heterogeneous materials in uniaxial compression.HERON 1998;43(3):137-58.
Eberhardt E.Brittle rock fracture and progressive damage in uniaxial compression. PhD Thesis.Saskatoon,Canada:Department of Geological Sciences,University of Saskatchewan;1998.
Eberhardt E,Stead D,Stimpson B,Read RS.Identifying crack initiation and propagation thresholds in brittle rock.Canadian Geotechnical Journal 1998;35(2):222-33.
Elmo D,Stead D.An integrated numerical modelling-discrete fracture network approach applied to the characterisation of rock mass strength of naturally fractured pillars.Rock Mechanics and Rock Engineering 2010;43(1):3-19.
Germanovich LN,Dyskin AV.Fracture mechanisms and instability of openings in compression.International Journal of Rock Mechanics and Mining Sciences 2000;37(1-2):263-84.
Gerogiannopoulos NGA.A critical state approach to rock mechanics.PhD Thesis. London,UK:Imperial College;1979.
Hajiabdolmajid V,Kaiser P.Brittleness of rock and stability assessment in hard rock tunneling.Tunnelling and Underground Space Technology 2003;18(1):35-48. Hajiabdolmajid V,Kaiser PK,Martin CD.Modelling brittle failure of rock.International Journal of Rock Mechanics and Mining Sciences 2002;39(6):731-41.
Hoek E.Strength of jointed rock masses.Géotechnique 1983;33(3):187-223.
Hoek E,Brown ET.Underground excavations in rock.London,UK:Institution of Mining and Metallurgy;1980.
Hoek E,Carranza-Torres C,Corkum B.Hoek-Brown failure criterion-2002 edition. In:Proceedings of NARMS-TAC Conference,Toronto;2002.p.267-73.
Hondros G.The evaluation of Poisson's ratio and the modulus of materials of a low tensile resistance by the Brazilian(indirect tensile)test with particular reference to concrete.Australian Journal of Applied Sciences 1959;10(3):243-68.
Itasca.UDEC v.5.0 user's manual.Minneapolis,USA:Itasca Consulting Group;2010. Jaeger JC,Cook NGW.Fundamentals of rock mechanics.3rd ed.London,UK:Chapman&Hall;1979.
Kaiser P,Diederichs M,Martin C,Sharp J,Steiner W.Underground works in hard rock tunneling and mining.In:Geo-Eng2000,An International Conference on Geotechnical and Geological Engineering;2000.p.841-926.
Klerck PA.The finite element modelling of discrete fracture in quasi-brittle materials.PhD Thesis.Swansea,UK:University of Wales Swansea;2000.
Lan H,Martin CD,Hu B.Effect of heterogeneity of brittle rock on micromechanical extensilebehaviorduringcompressionloading.JournalofGeophysical Research:Solid Earth 2010;115(B1).http://dx.doi.org/10.1029/2009JB006496.
Lim SS,Martin CD.Core disking and its relationship with stress magnitude for Lac du Bonnet granite.International Journal of Rock Mechanics and Mining Sciences 2010;47(2):254-64.
Lim SS,Martin CD,Åkesson U.In-situ stress and microcracking in granite cores with depth.Engineering Geology 2012;147-148:1-13.
Lisjak A,Tatone BSA,Grasselli G,Vietor T.Numerical modelling of the anisotropic mechanical behavior of Opalinus clay at the laboratory-scale using FEM/DEM. Rock Mechanics and Rock Engineering 2014;47(1):187-206.
Mahabadi OK,Grasselli G,Munjiza A.Numerical modelling of a Brazilian disc test of layered rocks using the combined finite-discrete element method.In:Proceedings of the 3rd Canada-US Rock Mechanics Symposium,Toronto,Canada;2009.Paper 4148.
Mahabadi O,Lisjak A,Munjiza A,Grasselli G.Y-geo:new combined finite-discrete element numerical code for geomechanical applications.International Journal of Geomechanics 2012a;12(6):676-88.
Mahabadi O,Randall NX,Zong Z,Grasselli G.A novel approach for microscale characterization and modeling of geomaterials incorporating actual material heterogeneity.GeophysicalResearchLetters2012b;39(1):L01303.http:// dx.doi.org/10.1029/2011GL050411.
Malan DF,Napier JAL,Watson BP.Propagation of fractures from an interface in a Brazilian test specimen.International Journal of Rock Mechanics and Mining Sciences and Geomechanics Abstracts 1994;31(6):581-96.
Martin CD.Seventeenth Canadian Geotechnical Colloquium:the effect of cohesion loss and stress path on brittle rock strength.Canadian Geotechnical Journal 1997;34(5):698-725.
Martin CD,Kaiser PK,McCreath D.Hoek-Brown parameters for predicting the depthofbrittlefailurearoundtunnels.CanadianGeotechnicalJournal 1999;36(1):136-51.
Martin CD,Stimpson B.The effect of sample disturbance on laboratory properties of Lac du Bonnet granite.Canadian Geotechnical Journal 1994;31(5):692-702.
Mayer J.Applications of uncertainty theory to rock mechanics and geotechnical mine design.MS Thesis.Burnaby,Canada:Simon Fraser University;2015.
Mayer JM,Hamdi P,Stead D.A modified discrete fracture network approach for geomechanical simulation.In:Proceedings of the 1st International Conference on Discrete Fracture Network Engineering,Vancouver,Canada;2014.p.12.
Nadan BJ,Engelder T.Microcracks in New England granitoids:a record of thermoelastic relaxation during exhumation of intracontinental crust.Geological Society of America Bulletin 2009;121(1-2):80-99.
Nur A,Simmons G.The origin of small cracks in igneous rocks.International Journal of Rock Mechanics and Mining Sciences and Geomechanics Abstracts 1970;7(3):307-14.
Obert L,Stephenson D.Stress condition under which core discing occurs.SME Transaction 1965;238:227-35.
Paterson MS,Wong T.Experimental rock deformation-the brittle field.New York, USA:Springer;2005.
PaulB.Macroscopiccriteriaforplasticflowandbrittlefracture.In:LiebowitzH,editor. Fracture.An advanced treatise,vol.2.New York,USA:Academic Press;1968.
Rockfield.ELFEN:a combined finite/discrete element code.Swansea,UK:Rockfield Software Ltd.;2012.http://www.rockfield.co.uk.
Rocscience Inc.Phase2 v.8 user's manual.Toronto,Canada:Rocscience Inc;2010. http://www.rocscience.com.
Rocscience Inc.RocData user's manual.Toronto,Canada:Rocscience Inc;2007. http://www.rocscience.com.
Shetty DK,Rosenfield AR,Duckworth WH.Mixed-mode fracture in biaxial stress state:application of the diametral-compression(Brazilian disk)test.Engineering Fracture Mechanics 1987;26(6):825-40.
Stacey T.Contribution to the mechanism of core discing.Journal of the Southern African Institute of Mining and Metallurgy 1982;82:269-76.
Tang CA,Lin P,Wong RHC,Chau KT.Analysis of crack coalescence in rock-like materials containing three flaws-Part II:numerical approach.International Journal of Rock Mechanics and Mining Sciences 2001;38(7):925-39.
Tapponnier P,Brace W.Development of stress-induced microcracks in Westerly granite.International Journal of Rock Mechanics and Mining Sciences and Geomechanics Abstracts 1976;13(4):103-12.
Vyazmensky A,Stead D,Elmo D,Moss A.Numerical analysis of block cavinginduced instability in large open pit slopes:a finite element/discrete element approach.Rock Mechanics and Rock Engineering 2010;43(1):21-39.
Wawersik WR,Fairhurst C.A study of brittle rock fracture in laboratory compression experiments.International Journal of Rock Mechanics and Mining Sciences 1970;7(5):561-75.
Wong L,Einstein H.Comparison of coalescence behavior between natural outcrops and laboratory testing specimens.In:Proceedings of the Geological Society of America Annual Meeting,Philadelphia,US;2006.
Wong LN,Einstein H.Coalescence behavior in Carrara marble and molded gypsum containing artificial flaw pairs under uniaxial compression.In:Proceedings of the 1st Canada-US Rock Mechanics Symposium,Vancouver;2007.p.581-90.
Xu C,Dowd P.A new computer code for discrete fracture network modelling. Computers and Geosciences 2010;36(3):292-301.
Yan M.Numerical modellingof brittle fracture and step-pathfailure:from laboratory to rock slope scale.PhD Thesis.Burnaby,Canada:Simon Fraser University;2008.
Zhang Z.An empirical relation between mode I fracture toughness and the tensile strength of rock.International Journal of Rock Mechanics and Mining Sciences 2002;39(3):401-6.

Pooya Hamdi holds a Ph.D.degree in Geological Engineering from Simon Fraser University,Vancouver,Canada. His Ph.D.thesis focused on characterization of brittle damage atvariousscalesusingadvancednumerical modeling based on combined finite-discrete element method integrated with the field of discrete fracture network.Using this approach,he investigated the influence of pre-existing and stress-induced fractures on different stages of brittle fracturing.
9 April 2015
*Corresponding author.Tel.:+1 604 9167175.
E-mail address:phamdi@sfu.ca(P.Hamdi).
Peer review under responsibility of Institute of Rock and Soil Mechanics, Chinese Academy of Sciences.
1674-7755©2015 Institute of Rock and Soil Mechanics,Chinese Academy of Sciences.Production and hosting by Elsevier B.V.All rights reserved.
http://dx.doi.org/10.1016/j.jrmge.2015.07.005
 Journal of Rock Mechanics and Geotechnical Engineering2015年6期
- Journal of Rock Mechanics and Geotechnical Engineering的其它文章
- Effects of fracture distribution and length scale on the equivalent continuum elastic compliance of fractured rock masses
- Shear strength behavior of geotextile/geomembrane interfaces Belén M.Bacasa,*,Jorge Cañizalb,Heinz Konietzkyc
- Engineering properties for high kitchen waste content municipal solid waste
- Effects of spatial variation in cohesion over the concrete-rock interface on dam sliding stability
- Evaluation of the effect of sodium silicate addition to mine backfill, Gelfill-Part 2:Effects of mixing time and curing temperature
- Studies on the key parameters in segmental lining design
