
Automatic defect detection in ultrasonic TOFD D-scan data using image processing m ethods*
2015-09-05 00:49:47ChiDazhaoandGangTie迟大钊
China Welding 2015年1期
Chi Dazhao and Gang Tie迟大钊,刚 铁**
Automatic defect detection in ultrasonic TOFD D-scan data using image processing m ethods*
Chi Dazhao and Gang Tie
迟大钊,刚 铁**
In ultrasonic time of flight diffraction(TOFD)D-scan image,only a small fraction representsdefects,whereas the majority is redundant.Because of the low contrast between defect and background image,it is difficult tomanually interpret TOFD image.In addition,due to the nature of the weak amplitude of ultrasonic diffracted signals,the human factor introduces inconsistency into the interpretation.In order to automatically distinguish weld defects from the D-scan image,a defect detectionmethod based on image processing technique is proposed.First,image pre-processing including clutter and noise suppression is conducted.Second,information entropy based image segmentation technique isemployed to extract defects in the pre-processed image.At last,mathematicalmorphology based post-processing is carried out.The experimental results show that with the proposed method,TOFD can be used for automatic weld defect detection with satisfactory level of reliability.
ultrasonic TOFD,defect detection,image segmentation
0 Introduction
Though ultrasonic time of flight diffraction(TOFD)is an advanced non-destructive testingmethod,ithassome technological shortcomings[1-3].One of these drawbacks is data interpretation.Currently,data interpretation for TOFD image is carried out manually,requiring operator experience,time and with low reliability.The trend of modern industry is to partially or fully automate the inspection and data interpretation processes.Themodern computational tools and information processing technology are helpful to automatically discriminate the variations between defect and non-defect region in TOFD images.However,very little work has been reported on the automatic identification of TOFD D-scan image.Using an artificial neural network,Zahran et al.presented a novel time-frequency analysis technique to characterize TOFD signals and extract distinguishable features to be used for the detection,classification and sizing of rail-track defects[4].The results show that TOFD can be used for a comprehensive automatic inspection with high levels of accuracy.Al-Ataby et al.presented techniques for the automatic sizing and positioning ofweld flaws in TOFD data[5].In their study,datamanipulation and post-processing techniqueswere developed for the automatic detection and sizing ofweld defects in TOFD data.In another study,using a support vector machines classifier,Al-Ataby et al.presented a method for automatic detection and classification of weld flaws in TOFD data[6].The study presented severalmultiresolution approaches employing the wavelet transform and texture analysis for de-noising and enhancing the quality of data to help in the automatic detection and classification of defects.
This paper presents a digital image process(DIP)based method developed for the automatically distinguish defect from TOFD D-scan background image.Aluminum butt weldments were made.The collected D-scan images were processed using the proposed method.The experimental results are presented and discussed.
1 Ultrasonic TOFD D-scan image
The buttweldments used in this study are 20 mm in thickness and 200 mm in length.The pitch-catch mode probes selected are well matched with 6 mm in diameter and 5MHz in nominal frequency.Coupled with water,the probes generate and receive longitudinalwave in the weldment atan angle of 60 degree.The TOFD D-scan images were collected with probe centre separation(PCS)34mm and scanning step 0.2 mm.TOFD D-scan data were collected using an ultrasonic C-scan system.The D-scan image presents as a series of A-scan lines digitized directly from the receiver probe during the scanning operation,showing the details of the weld along its length.Fig.1 shows a raw D-scan image with weld defects.

Fig.1 Raw D-scan image
It can be seen,the lateralwave shows up as a continuous global component in TOFD D-scan image.The defect with bigger size along the weld shows the signature of significant length.The defectwith smaller size shows the signature of little length and through wall extent.Due to the nature of the weak diffracted ultrasonic signals,TOFD has the drawback that it could not often collect clear image. Besides,in TOFD D-scan image,only a small fraction actually represents defects,whereas the majority is redundant.Therefore,defect detection by naked eyes is often tedious.And the testing result is often with low reliability. However,the positioning and sizing of defects in TOFD image is almost entirelymanual process at present.In order to recognize defect in D-scan images automatically,a DIP based method is presented.It includes the following three steps:First,clutter and noise wave suppression are conducted as image pre-processing.Then information entropy based image segmentation processing is employed to extract defects in the pre-processed image.At last,a mathematical morphology based post-processing technique is carried out on the segmented image to automatically distinguish defect from the background.
2 Image pre-processing
Lateralwave is important for sizing of defect,but it is non-defect component in the image.Lateralwave definitely increases the amountof calculation in the course of image processing.In addition,the tip diffracted signals for defects close to the surfacewill be superimposed above the lateral wave.An adaptive filter technique is used to remove the redundant data from the raw D-scan image(as shown in Fig.1).The processed result is shown in Fig.2.
Noise is another factor that affects defect detection in D-scan image.Wavelet is widely used technique for noise suppression.An improved non-linear wavelet shrinkage based method was employed to suppress noise component in TOFD D-scan image[7].“Sym8”mother wavelet,“Soft”threshold and“Rigrsure”estimation were selected.The noise suppression was carried out on the clutter removed D-scan image(as shown in Fig.2),and the denoised image is shown in Fig.3.It can be seen that the background image shows up as uniform region,though there is still a small fraction of noise speckle unsuppressed.Besides,the moustache signature that small defects show up in the raw image can be eliminated.This can significantly reduce defect positioning and sizing errors.The clutter and noise suppressions decrease the amount of calculation for image segmentation and lay a foundation for automatic defect detection.

Fig.3 Noise suppressed image
3 Image segmentation
Image segmentation is to distinguish the objects from the background.Among the popular image segmentation approaches,threshold techniques,which make decisions based on pixel information,are effectivewhen the intensity levels of the objects fall squarely outside the range of levels in the background.In this paper,information entropies based image segmentation method was applied to identify defects in the pre-processed D-scan image.
The clutter and noise suppressed D-scan image,whose grey level is0-l,is defined as F=f(x,y).A dot matrix of 3×3 is used to smooth the image F,and the processed image can be described as F′=f′(x,y).Then image F and F′construct a generalized image that can be defined as

fijis the total amountof element(i,j)in the generalized image,and it can be defined as

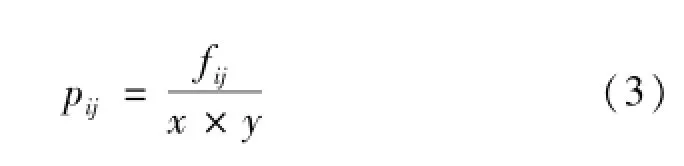
The occurrence frequency of(i,j)is given by
The relationship between the defect,background image and noise can be represented using a two-dimension grey histogram,as shown in Fig.4.
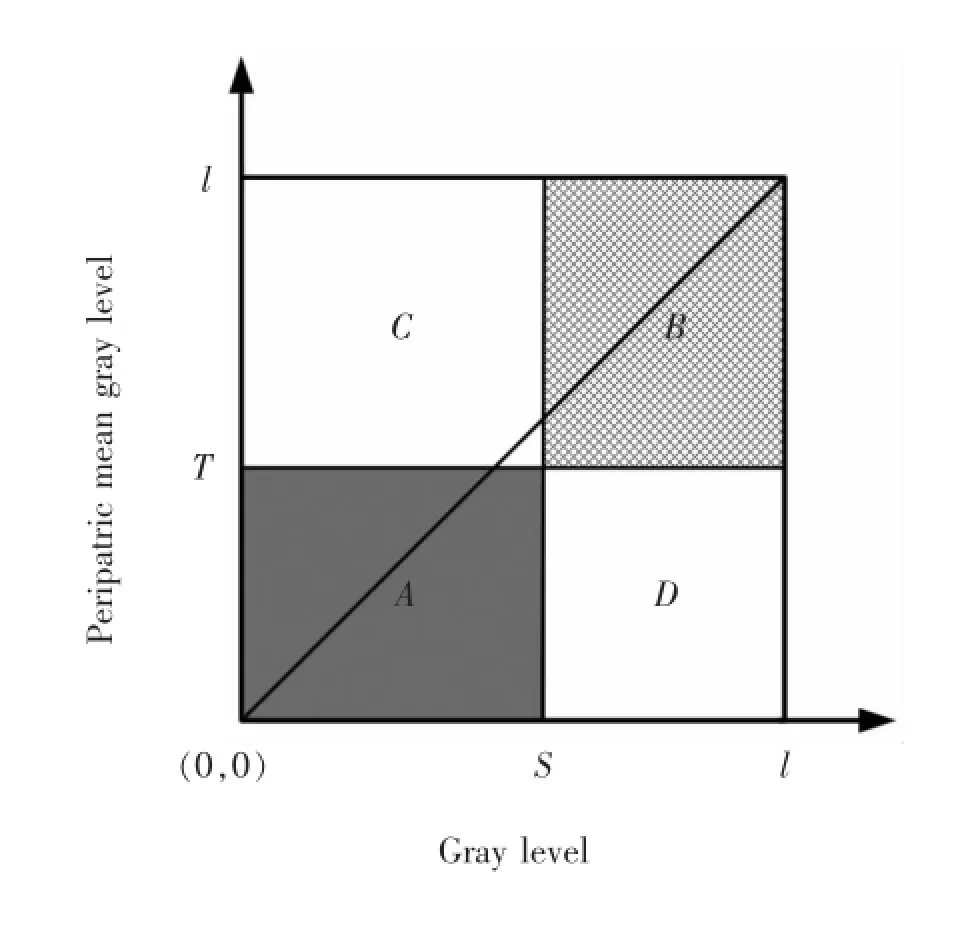
Fig.4 Schematic of two-dimension grey histogram
In the histogram,block A,B,C and D represent the targets,background,noise and boundary,respectively. PAis the sum probability of the pixels in block A,and PBfor block B.For image segmentation,if the threshold values are set as(S,T),then PAand PBare given by

and
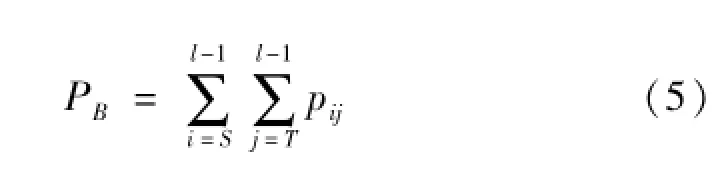
respectively.
The two-dimension information entropies H(A)and H(B)are given by


and respectively.
The discriminant function is defined by

So,the key to segment the image is to find the vector [S*,T*]tomeet

S*and T*are the calculated threshold values,with which the maximum value of two-dimension information entropy can be obtained.
The pre-processed D-scan image(as shown in Fig.3)is segmented using the calculated threshold S*and T*.The result is shown in Fig.5.In the raw and pre-processed D-scan images,small defects are often lower contrast to the background.So,it is difficult to distinguish small defect from the background by naked eyes.In the segmented image,defect can be detected easily even for those composed by fewer pixels and with lower grey value.

4 Image post-process
Mathematicalmorphology involves geometric analysis of shapes and textures in images.Morphological operators work with two images.The image being processed is referred to as the active image.The other image,being a kernel,is referred to as the structuring element.The elementary operations in mathematical morphology are dilation and erosion,which can be combined in sequence to produce other operations,such as opening and closing. According to the sampling frequency of the ultrasonic C-scan system(100MHz),the frequency ofultrasonic probe (5 MHz)and the wavelength in the testing piece(1.2 mm),the structuring elements B1 and B2 are constructed as

respectively.
B1 and B2 are used for opening and closing calculation,respectively.Using mathematical morphology based technique,post-processing is carried out on the segmented D-scan image(as shown in Fig.5).The processed result is shown in Fig.6.The opening calculation can remove the pixels in the regions that are too small to contain the structuring element B1.It tends to smooth outward bumps,break narrow sections and eliminate thin protrusions.The closing calculation can fill in the holes and concavities that are smaller than the structuring element B2.It tends to eliminate small holes and remove inward bumps.Asa result,it can be seen that the gaps in the defect diffracted stripes are filled.

Fig.6 Image processed with mathematicalmorphology based technique
5 Conclusions
A DIP based defect detection method is proposed for automatic defect identification in ultrasonic TOFD D-scan image.For image pre-processing,an adaptive filter is applied for clutterwave suppression.Then wavelet technique is applied for noise suppression.The pre-processing can remove redundant data and recover the noise contaminated data effectively.Information entropies based image segmentation technique can effectively extract defects in the pre-processed D-scan image.The calculated threshold value used for image segmentation can avoid under-segmentation for small targets.Mathematicalmorphology based image analysis technique can fill the gaps and delete speckles in the segmented image,and finally distinguish defects from the background image.The results achieved so far have been promising in terms of accuracy,consistency and reliability.
References
[1] Chi D Z,Gang T.Shallower buried defect testing method based on ultrasonic TOFD.Journal of Nondestructive Evaluation,2013,32(2):164-171.
[2] Gang T,Chi D Z.Novel approach to enhancement of ultrasonic TOFD B-scan image for measurement of weld crack. Science and Technology of Welding and Joining,2007,12 (1):87-93.
[3] Chi D Z,Gang T,Yao Y X,et al.Weld crack testingmethod using ultrasonic TOFD technique.Insight:Non-destructive Testing and Condition Monitoring,2010,52(4):188-191.
[4] Zahran O,Al-Nuaimy W.Automatic segmentation of time-offlight diffraction images using time-frequency techniques-application to rail-track defect detection.Insight:Non-destructive Testing and Condition Monitoring,2004,46(6):338-343.
[5] A l-Ataby A,Al-Nuaimy W,Zahran O.Towards automatic flaw sizing using ultrasonic time-of-flight diffraction.Insight:Non-destructive Testing and Condition Monitoring.2010,52 (7):366-371.
[6] Al-Ataby A,Al-Nuaimy W,Brett C R,et al.Automatic detection and classification of weld flaws in TOFD data using wavelet transform and support vectormachines.Insight:Nondestructive Testing and Condition Monitoring,2010,52(11):597-602.
[7] Chi D Z,Gang T,Yao Y X.Non-linear wavelet shrinkage basedmethod for defect detection in ultrasonic signal.Journal of Mechanical Engineering,2011,47(18):1-6.
*Thiswork is supported by the National Natural Science Foundation of China(51375002,51005056)and the Postdoctoral Science-Research Developmental Foundation of Heilongjiang Province(LBH-Q13079).
**Chi Dazhao and Gang Tie,State Key Laboratory of Advanced Welding and Joining,Harbin Institute of Technology,Harbin,150001. Chi Dazhao,Corresponding author,E-mail:dzchi@hit.edu.cn

- China Welding的其它文章
- Stress-strain characteristics of linear friction welding of TC11 and TC17 alloys*
- Effects of C/B4C ratio on Microstructure and property of Fe-based alloy coatings reinforced w ith in situ synthesized TiB2-TiC*
- Effects of Bi and rare earth metal on theMicrostructure and properties of Zn-based high-tem perature solder*
- Numerical analysis of keyhole establishment time in keyhole p lasma arc welding*
- Effect of pulse frequency on hardness characteristics of Al-Cu alloy HPVP-GTAW joints*
- Analysis of grain grow th in hybrid weld HAZ based on the coupled thermo-fluid model