2009~2013年眉山市主城区降水污染的来源解析
李 祥
(眉山市环境监测中心,四川 眉山 620010)
2009~2013年眉山市主城区降水污染的来源解析
李祥
(眉山市环境监测中心,四川 眉山620010)

眉山市主城区;降水;化学组成;源解析
大气降水能有效地将空气、植被、土壤、地表水、地下水联系在一起。降水对大气颗粒物具有明显的清除作用,并能通过沉降方式渗透到土壤中,补给地表水和地下水的来源,影响动植物生存,进而间接涉及人类的生产生活。所以,对大气降水特征的研究是当今的一大热点。从大气降水的化学组成特征可以了解到其污染来源。大气降水中的污染物绝大多数来自人类的生产活动,例如工业生产、农业生产、畜牧养殖等。对降水的污染来源解析能为我们今后对降水污染治理和控制提供参照依据,更好的发展循环经济、资源节约和环境友好型社会。
眉山市作为一个新兴城市,为了促进经济发展,不断进行产业结构调整,引进了大批企业入驻,使得辖区内工业企业、农牧养殖、粮食水果生产等活动日新月异,造成降水污染越来越复杂。所以,对本地区降水中污染物来源的解析意义重大,能为类似的发展中城市对降水污染的治理控制提供一些思路。
1 材料与方法
1.1采样点及样品采集
本研究在眉山市东坡区环境监测站所在办公大楼(103.84°E,30.06°N)楼顶设一个采样点。该办公楼高约15 m,四周无高大树木或建筑物覆盖遮挡。采样点位于眉山市东坡区主城区,属于典型的城市功能区。采样点具体位置以及周围环境情况见图1。

图1 采样点位置Fig.1 Location of sampling site
采样时间从2009年1月1日起持续到2013年12月31日,逢雨必采。降水采集装置是一个聚乙烯材质的漏斗型开口瓶。利用支架将其支撑到离楼面约1.2m高处收集降水。收集到的降水样品转移到清洁干燥的白色聚乙烯瓶中,贴上标签,然后带回实验室进行后续分析。降水样品的采集与保存细则详见《大气降水样品的采集与保存》(GB 13580.2—92)[1]。采样同时记录好降水起止时间、降雨量、样品编号等信息。
1.2样品化学分析
1.2.1降水pH值
收集到的降水样品带回实验室后应立即测定其pH值,再用尼龙微孔滤膜(孔径:0.45 μm)进行过滤,滤液转移到干净的聚乙烯瓶中密封保存,并贴上标签编号。pH计型号为pHS-3C(雷磁公司)。
1.2.2降水化学组成分析

1.3数据统计分析
采用降雨量加权法计算年均降水pH值。降雨量加权年(月)均离子浓度的计算方式类似。具体计算过程如式(1)所示:
(1)

pHi—第i次降水的pH值;
Vi—第i次降水的降雨量,mm;
n—降水总场数。
采用SPSS 19.0软件对所有水溶性无机离子组份浓度数据进行皮尔森相关性分析和因子分析。
2 结果与讨论
2.1降水pH值
从2009年1月1日~2013年12月31日期间,共收集到降水样品243个。表1统计了这5年间降水pH值具体情况。2009年至2013年,各年降水pH值变化范围依次分别为5.67~7.20、6.15~7.16、5.91~6.59、5.98~6.73、6.04~8.27,pH值降雨量加权年均值依次分别为6.34、6.43、6.36、6.27、6.89。与国内外大部分地区相比,本研究的降雨量加权年均pH值较大,例如南京[3](5.15)、成都[4](5.10)、深圳[5](4.56)、金华[6](4.54)、广州[7](4.50)、杭州[8](4.50)、上海[9](4.49)、贵阳[10](4.23)、雅安[11](4.03)、东京[12](4.52)、纽约[13](4.60)、首尔[14](4.70)、圣保罗[15](5.20)、泰国[16](6.00)等;而北京[17](6.00)、乌鲁木齐[18](6.86)和马德里[19](6.50)等地区则与本研究结果十分接近。

表1 2009~2013年降水pH值统计
图2描绘了本地区2009~2013年间降水pH值的日变化趋势。从图中可以观察到,降水pH值最低5.67,最高8.27,并且2009~2012年降水pH值较稳定,波动幅度小,而2013年降水pH波动较大,并且日变化趋势也与其它4年相差较大,推测可能是因为2013年降水的污染来源发生了部分变化。这5年间,无酸雨事件发生,但发生了“碱雨”事件。pH值大于7.0的降水叫“碱雨”。2009年发生2次碱性降水事件,2010年发生3次,2013年发生14次。5年间碱雨发生概率为7.82%,而其余降水事件的pH值主要分布在5.60~7.00之间,说明眉山市主城区降水主要趋于中性,少数时间显碱性。降水显碱性可能是由人类生产或生活活动排放到环境空气中的氧化钙、氢氧化钠、氨气等引起。目前对碱雨的报道相对较少,例如南充市[20]、绵阳市[21]、双鸭山市[22]和克山县[23]等。
由以上分析可见,本地区降水主要显中性,少数情况显碱性,无酸雨事件,这与国内大部分地区的观察结果不同。
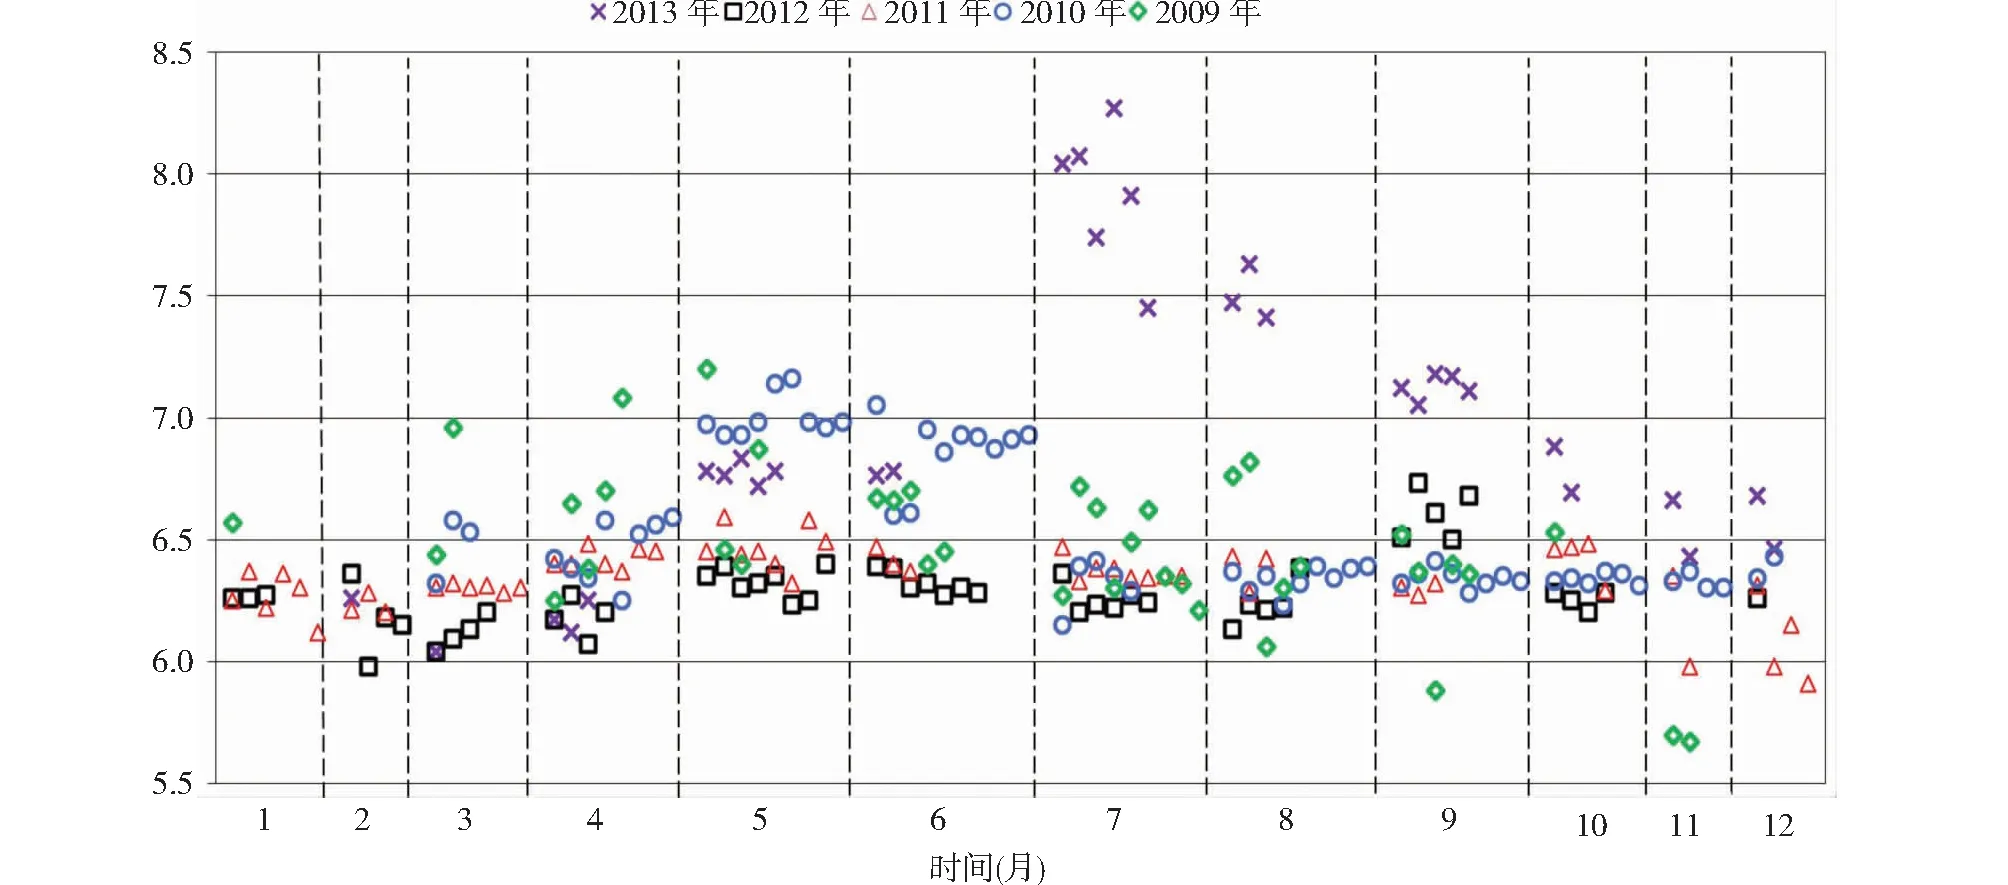
图2 2009~2013年间降水pH值日变化Fig.2 Daily variation of precipitation pH values from 2009 to 2013
2.2水溶性无机离子组成特征

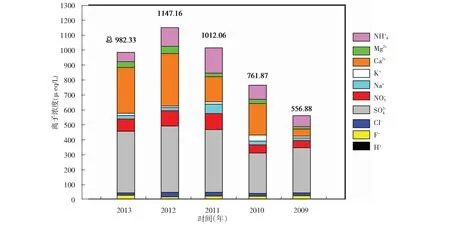
图3 眉山主城区降水离子的降雨量加权年均浓度Fig.3 Yearly rainfall-weighted average ionic concentrations in the main urabn area of Meishan City
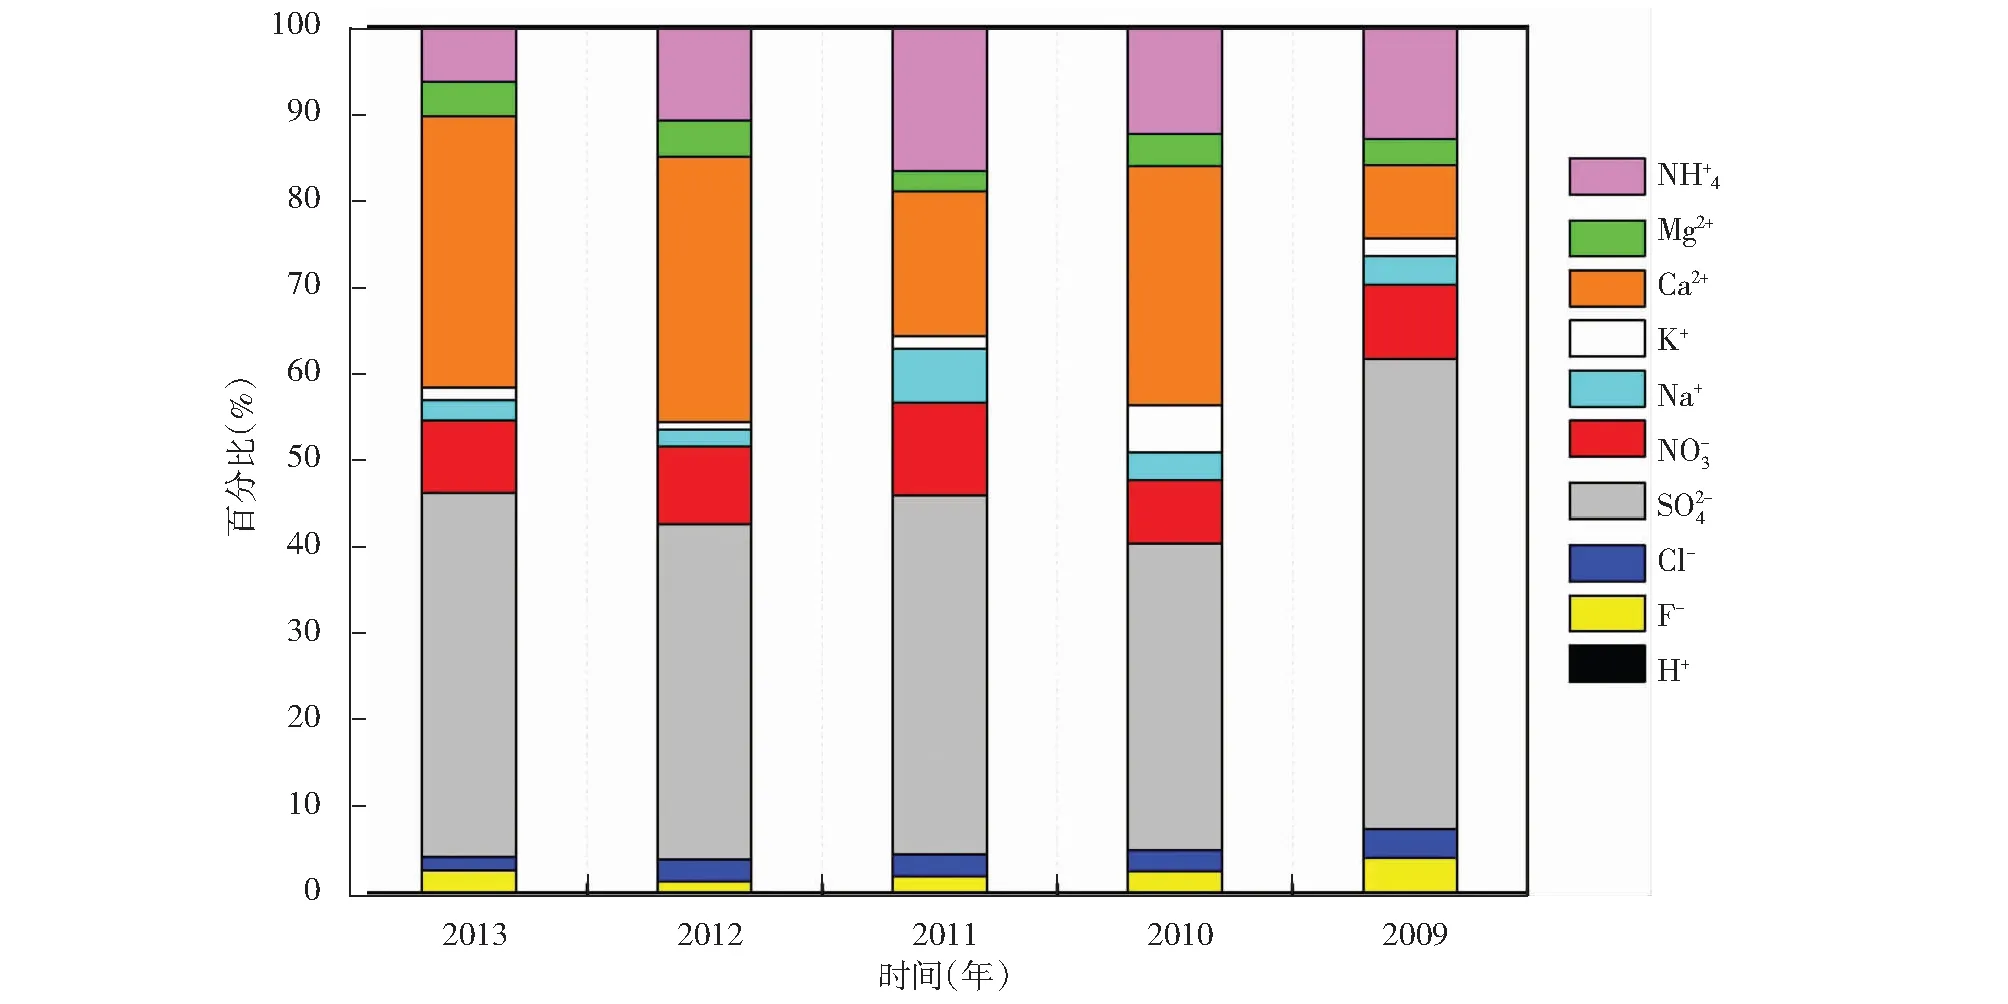
图4 降雨量加权年均离子组成百分比Fig.4 Percent of ions based on yearly rainfall-weighted average ionic concentrations

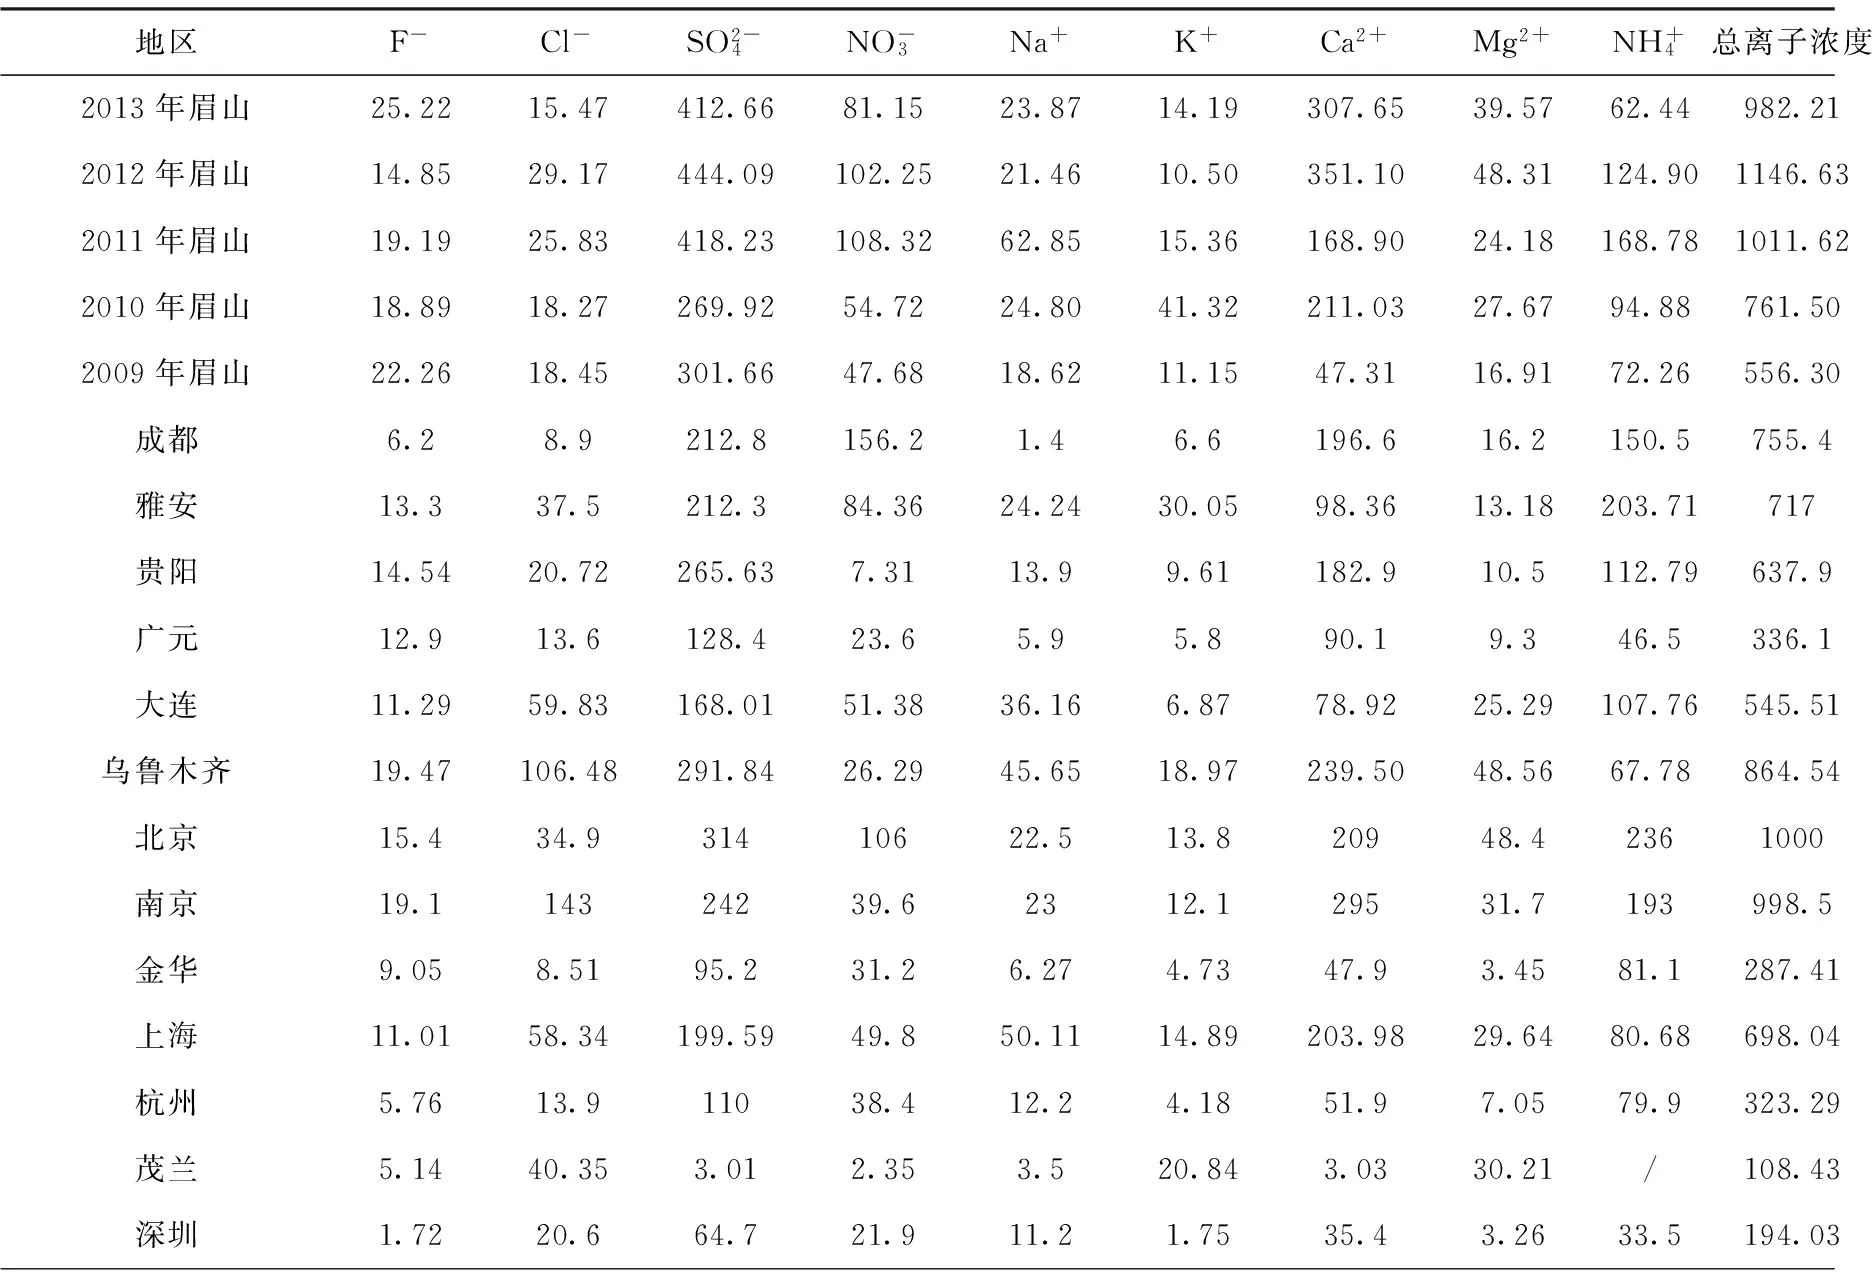
表2 各地降水中降雨量加权年均离子浓度比较
续表2
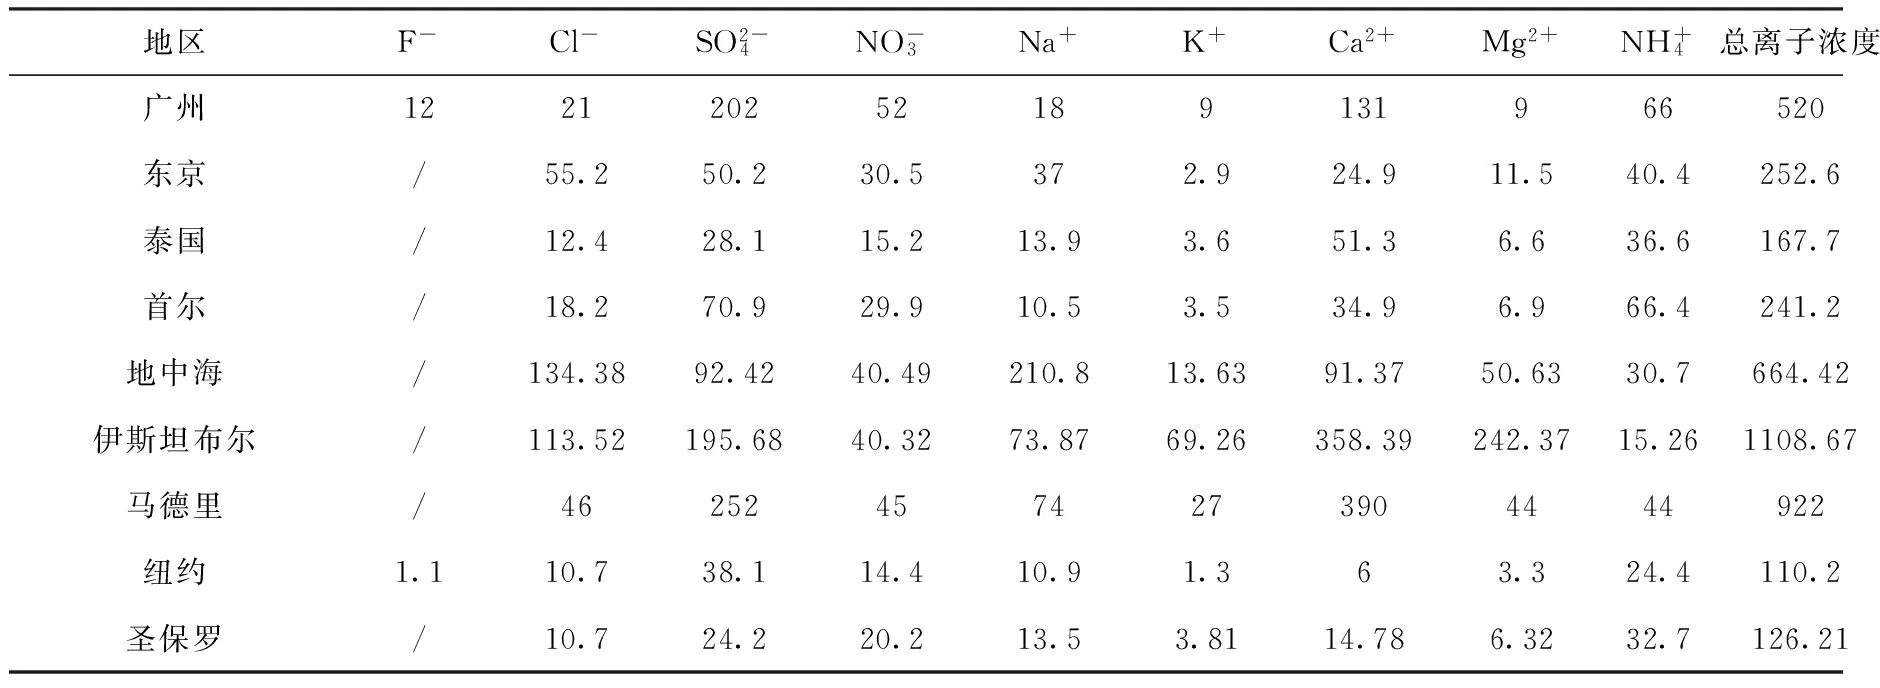
地区F-Cl-SO2-4NO-3Na+K+Ca2+Mg2+NH+4总离子浓度广州122120252189131966520东京/55.250.230.5372.924.911.540.4252.6泰国/12.428.115.213.93.651.36.636.6167.7首尔/18.270.929.910.53.534.96.966.4241.2地中海/134.3892.4240.49210.813.6391.3750.6330.7664.42伊斯坦布尔/113.52195.6840.3273.8769.26358.39242.3715.261108.67马德里/462524574273904444922纽约1.110.738.114.410.91.363.324.4110.2圣保罗/10.724.220.213.53.8114.786.3232.7126.21

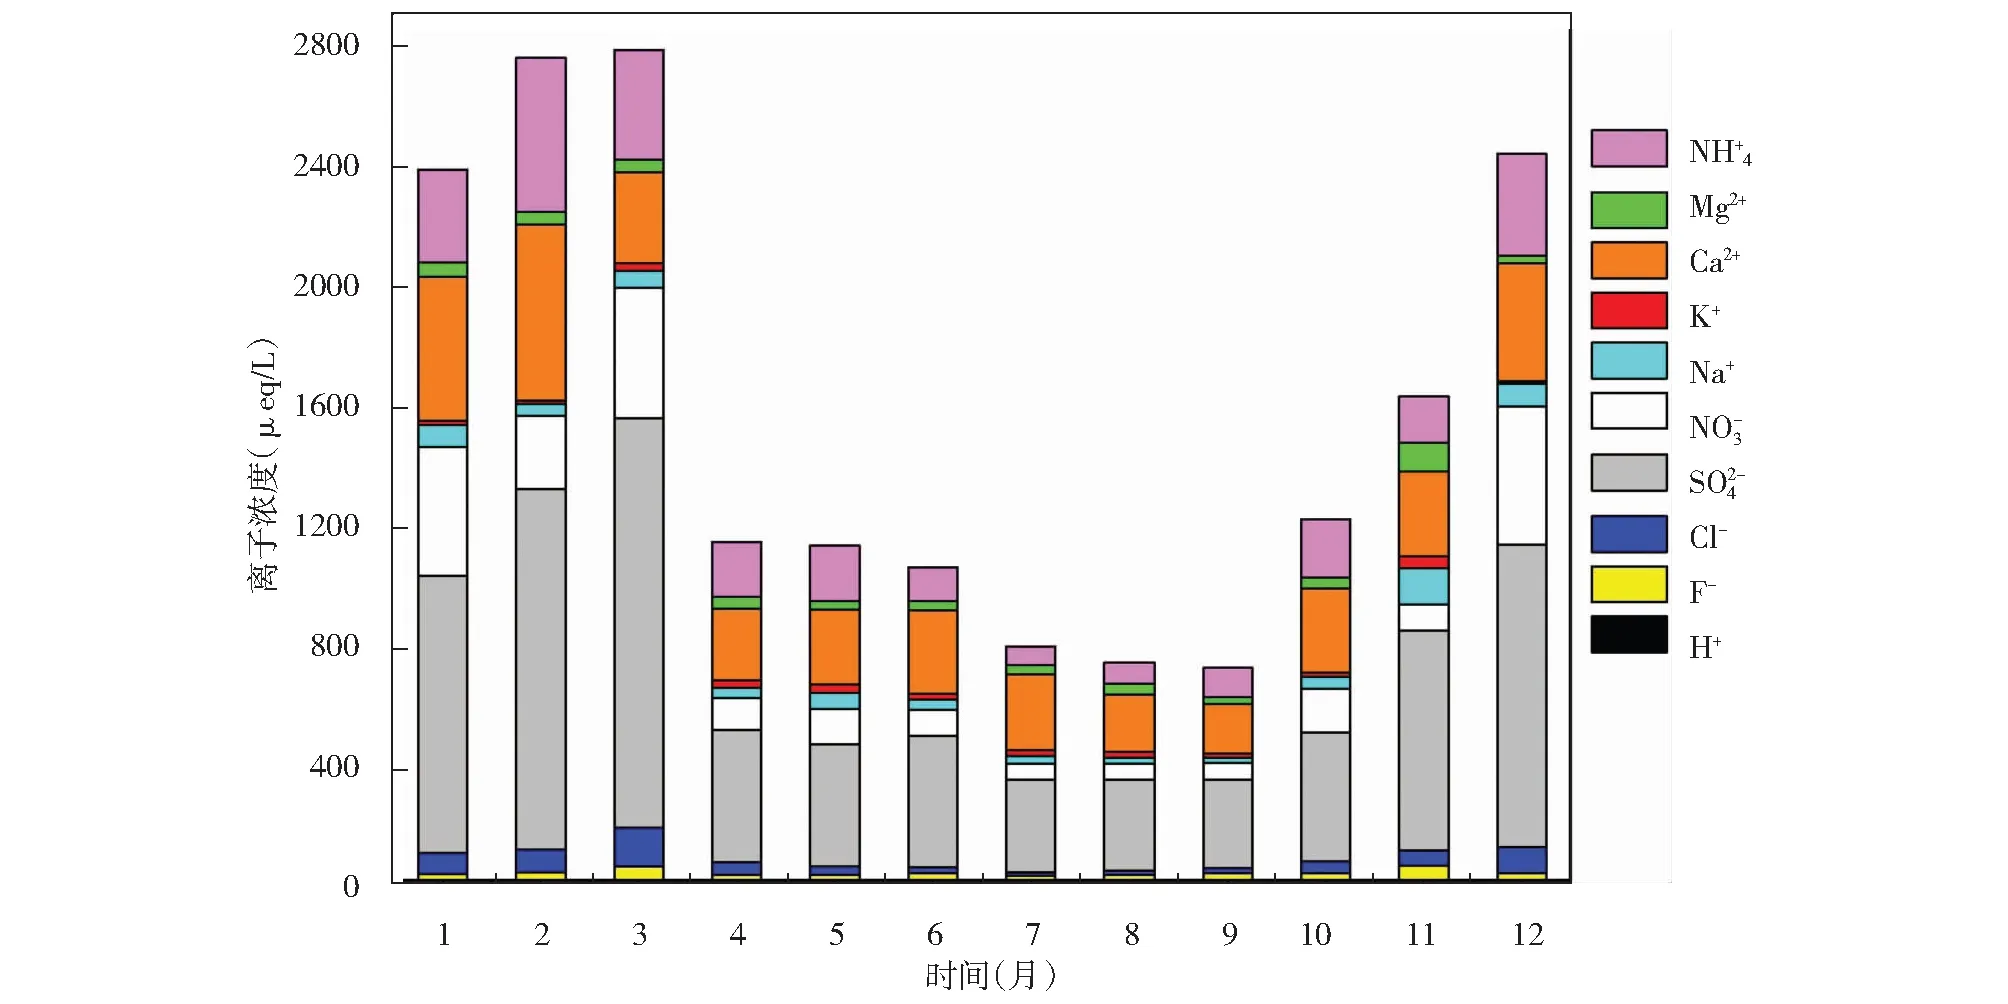
图5 降水离子5年加权月均浓度Fig.5 Monthly rainfall-weighted average ionic concentrations of five years
2.3污染源解析


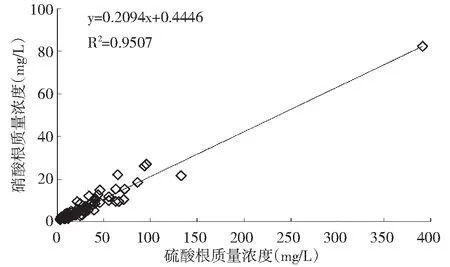
图和浓度之间的线型回归Fig.6 Linear regression between and
2.3.2离子组成相关性分析

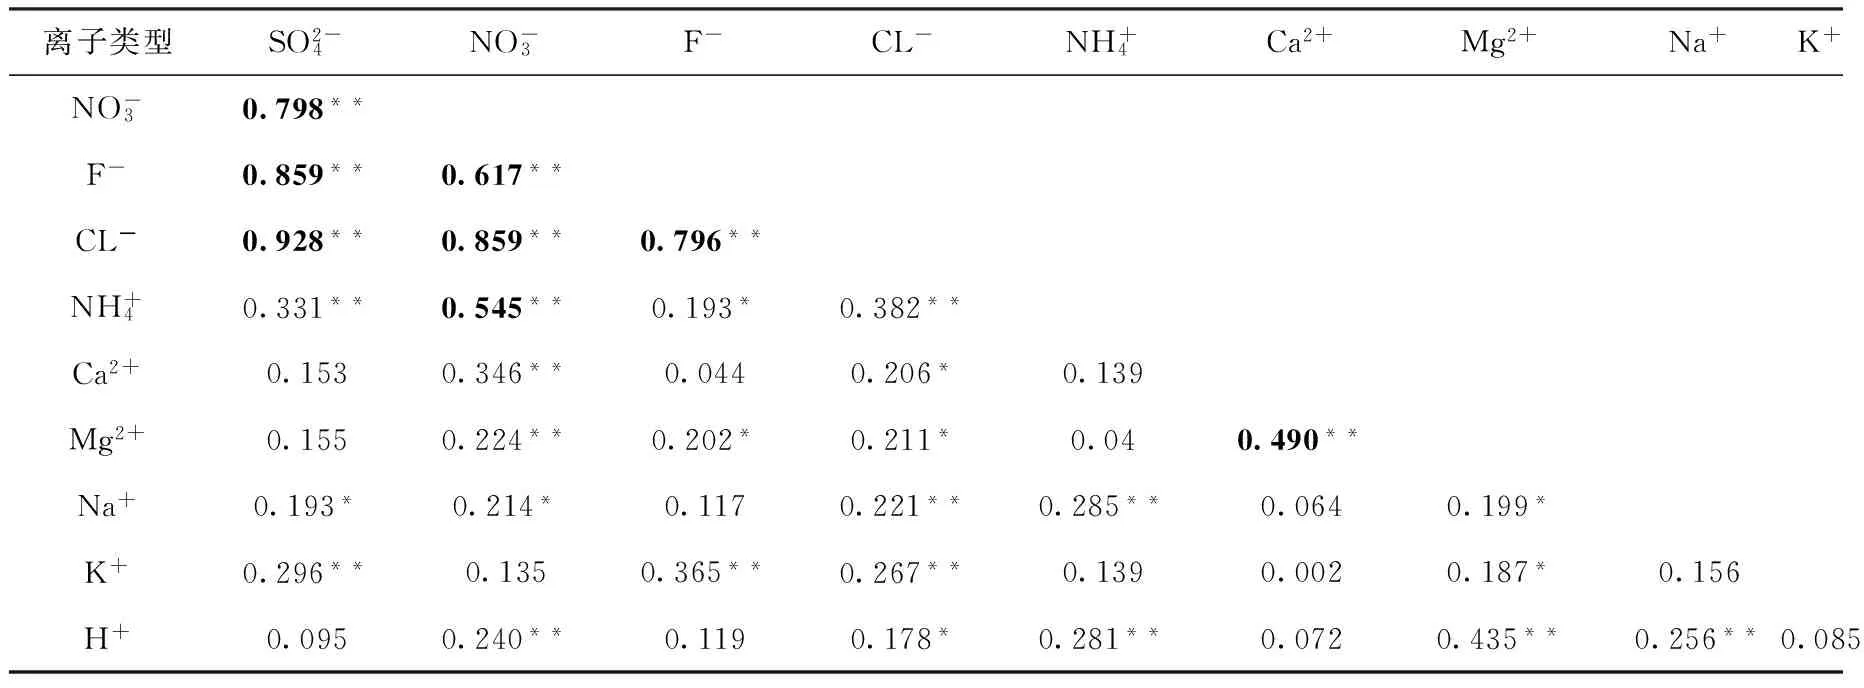
表3 5年降水离子组成相关性分析结果
备注:** 表示在 0.01 水平(双侧)上显著相关;* 表示在 0.05 水平(双侧)上显著相关;黑体数据为相关极显著,且相关系数大于0.49。
2.3.3因子分析

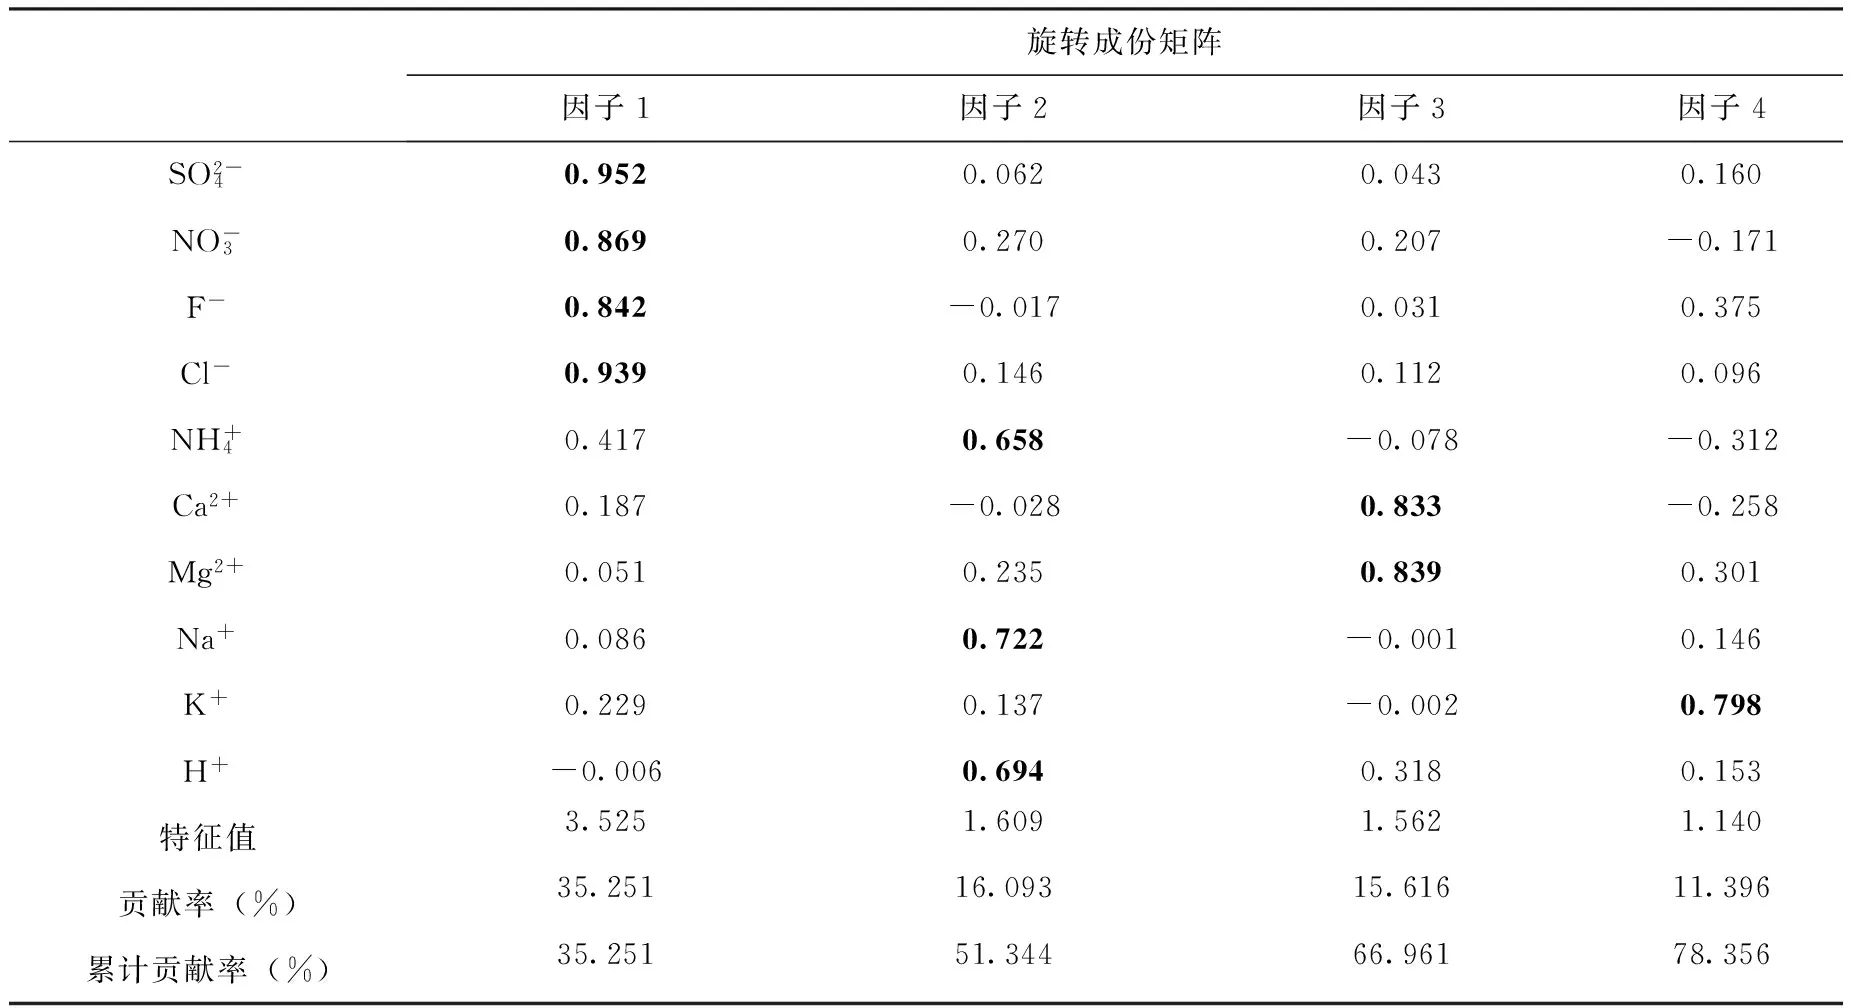
表4 降水化学组成因子分析结果
注:黑体数据表示此变量的荷载值大于0.65。
2.3.4富集因子分析
富集因子分析法是一种分析污染来源的有效方法,常常用于降水污染来源的分析[16, 30,31]。富集因子分析法是以Na+作为参照元素,并假设所有的Na+均来源于海盐泡沫[32],以EFseawater表示海盐富集因子,不同目标离子的海盐来源按式(2)所示计算:
(2)


表5 不同降水离子的EFseawater值
2.3.5不同污染源的贡献率

(3)

(4)


表6 不同污染源对降水中各离子的贡献率
3 结 论
本文通过对2009年1月1日~2013年12月31日期间眉山市主城区降水的组成和污染来源解析,主要得出以下结论:
3.12009~2013年降水pH值的降雨量加权年均值依次分别为6.34、6.43、6.36、6.27、6.89,pH值变化范围依次分别为5.67~7.20、6.15~7.16、5.91~6.59、5.98~6.73、6.04~8.27。这5年期间,碱雨发生概率为7.82%,而其余降水的pH值均在5.60~7.00之间,说明本地区降水主要呈现中性,偶尔显碱性,并无酸雨事件发生。

[1]GB/T13580.2-1992, 大气降水样品的采集与保存 [S].
[2]赵敏, 宗贵仪, 王先明, 等. 2013年眉山市东坡区主城区降水化学组成特征 [J]. 四川环境, 2015, 34(1): 78-84.
[3]Tu J, Wang H, Zhang Z, et al. Trends in chemical composition of precipitation in Nanjing, China, during 1992-2003 [J]. Atmospheric Research, 2005, 73(3-4): 283-298.
[4]Wang H, Han G L. Chemical composition of rainwater and anthropogenic influences in Chengdu, Southwest China [J]. Atmospheric Research, 2011, 99(2): 190-196.
[5]Huang X F, Li X, He L Y, et al. 5-Year study of rainwater chemistry in a coastal mega-city in South China [J]. Atmospheric Research, 2010, 97(1-2): 185-193.
[6]Zhang M, Wang S, Wu F, et al. Chemical compositions of wet precipitation and anthropogenic influences at a developing urban site in southeastern China [J]. Atmospheric Research, 2007, 84(4): 311-322.
[7]Huang D Y, Xu Y G, Peng P, et al. Chemical composition and seasonal variation of acid deposition in Guangzhou, South China: Comparison with precipitation in other major Chinese cities [J]. Environmental Pollution, 2009, 157(1): 35-41.
[8]Xu H, Bi X, Feng Y, et al. Chemical composition of precipitation and its sources in Hangzhou, China [J]. Environmental Monitoring and Assessment, 2011, 183(1-4): 581-592.
[9]Huang K, Zhuang G, Xu C, et al. The chemistry of the severe acidic precipitation in Shanghai, China [J]. Atmospheric Research, 2008, 89(1-2): 149-160.
[10]肖红伟, 肖化云, 王燕丽. 贵阳大气降水化学特征及来源分析 [J]. 中国环境科学, 2010, 30(12): 1590-1596.
[11]Zhao M, Li L, Liu Z, et al. Chemical Composition and Sources of Rainwater Collected at a Semi-Rural Site in Ya’an, Southwestern China [J]. 2013, 3(4): 486-496.
[12]Okuda T, Iwase T, Ueda H, et al. Long-term trend of chemical constituents in precipitation in Tokyo metropolitan area, Japan, from 1990 to 2002 [J]. Science of the Total Environment, 2005, 339(1-3): 127-141.
[13]Song F, Gao Y. Chemical characteristics of precipitation at metropolitan Newark in the US East Coast [J]. Atmospheric Environment, 2009, 43(32): 4903-4013.
[14]Kyoung Lee B, Hee Hong S, Soo Lee D. Chemical composition of precipitation and wet deposition of major ions on the Korean peninsula [J]. Atmospheric Environment, 2000, 34(4): 563-75.
[15]Santos M A, Illanes C F, Fornaro A, et al. Acid rain in downtown Sao Paulo city, Brazil [J]. Water, Air, & Soil Pollution: Focus, 2007, 7(1-3): 85-92.
[16]Panyakapo M, Onchang R. A four-year investigation on wet deposition in western Thailand [J]. Journal of Environmental Sciences, 2008, 20(4): 441-448.
[17]Yang F, Tan J, Shi Z, et al. Five-year record of atmospheric precipitation chemistry in urban Beijing, China [J]. Atmospheric Chemistry and Physics, 2012, 12(4): 2025-2035.
[18]Xu M, L A, Xu F, et al. Seasonal chemical composition variations of wet deposition in Urumchi, Northwestern China [J]. Atmospheric Environment, 2008, 42(5): 1042-1048.
[19]Hontoria C, Saa A, Almorox J, et al. The chemical composition of precipitation in Madrid [J]. Water, Air, & Soil Pollution, 2003, 146(1): 35-54.
[20]杨先红, 舒丽, 陈善莉. 南充市近十年酸雨变化特征及降水化学组成研究 [J]. 四川环境, 2014, 33(1): 26-31.
[21]沈菁, 黄建. 绵阳市大气降水 pH值时空分布及酸雨成因研究 [J]. 四川环境, 2002, 21(2): 72-75.
[22]曹志锋, 王荣, 陈刚. 双鸭山市降水酸碱变化情况分析 [J]. 黑龙江气象, 2013, 30(1): 32-33.
[23]刘文霞. 克山县降水污染现状分析 [J]. 黑龙江环境通报, 2014, 38(1): 98-100.
[24]徐俊, 乔梁, 赵洪兵, 等. 广元市降水化学组成及酸雨污染趋势分析[J]. 四川环境, 2013,(S1):105-108.
[25]Zhang X, Jiang H, Zhang Q, et al. Chemical characteristics of rainwater in northeast China, a case study of Dalian [J]. Atmospheric Research, 2012, 116: 151-160.
[26]Han G L, Tang Y, Wu Q X, et al. Chemical and strontium isotope characterization of rainwater in karst virgin forest, Southwest China [J]. Atmospheric Environment, 2010, 44(2): 174-181.
[29]陈克军, 陈刚才, 张卫东, 等. 重庆市主城区降雨酸度的影响因子分析 [J]. 矿物岩石地球化学通报, 2003, 22(2): 163-166.
[30]Galy-Lacaux C, Laoualid D, Descroix L, et al. Long term precipitation chemistry and wet deposition in a remote dry savanna site in Africa (Niger) [J]. Atmospheric Chemistry and Physics, 2009, 9(5): 1579-1595.
[31]Laouali D, Galy-Lacaux C, Diop B, et al. Long term monitoring of the chemical composition of precipitation and wet deposition fluxes over three Sahelian savannas [J]. Atmospheric Environment, 2012, 50: 314-327.
[32]Kulshrestha U, Sarkar A, Srivastava S, et al. Investigation into atmospheric deposition through precipitation studies at New Delhi (India) [J]. Atmospheric Environment, 1996, 30(24): 4149-4154.
[33]Keene W C, Pszenny A A P, Galloway J N, et al. Sea-salt corrections and interpretation of constituent ratios in marine precipitation [J]. Journal of Geophysical Research, 1986, 91(D6): 6647-6658.
[34]Okay C, Akkoyunlu B O, Tayan M. Composition of wet deposition in Kaynarca, Turkey [J]. Environmental Pollution, 2002, 118(3): 401-410.
[35]Ali K, Momin G, Tiwari S, et al. Fog and precipitation chemistry at Delhi, North India [J]. Atmospheric Environment, 2004, 38(25): 4215-4222.
Source Apportionment of Precipitation Pollution in the Main Urban Area of Meishan City from 2009 to 2013
LI Xiang
(MeishanEnvironmentalMonitoringCenter,Meishan,Sichuan620010,China)

The main urban area of Meishan City; precipitation; chemical componets; source apportionment
2015-05-14
李祥(1977-),男,四川眉山人,2014年毕业于武汉大学环境工程专业,硕士,工程师,主要从事环境监测工作。
X502
A
1001-3644(2015)06-0102-10
——四川眉山市彭山区第一中学

