Interaction of Land Demand and Supply Effects in Intensive Land Use:a Simulation Study for Chengdu,China
GU Ji-rong(辜寄蓉),CHEN Xian-wei(陈先伟),JIANG Liu-guangyan(江浏光艳),YANG Hai-long (杨海龙),YU You-xiang(于有翔)
1 Key Laboratory of Land Resources Evaluation and Monitoring in Southwest,Chengdu 610068,China
2 The Bureau of Land and Resources of Chengdu,Chengdu 610072,China
Interaction of Land Demand and Supply Effects in Intensive Land Use:a Simulation Study for Chengdu,China
GU Ji-rong(辜寄蓉)1*,CHEN Xian-wei(陈先伟)2,JIANG Liu-guangyan(江浏光艳)1,YANG Hai-long (杨海龙)1,YU You-xiang(于有翔)1
1 Key Laboratory of Land Resources Evaluation and Monitoring in Southwest,Chengdu 610068,China
2 The Bureau of Land and Resources of Chengdu,Chengdu 610072,China
Intensive land use(ILU)policies affect the demand and supp ly of land.These policies promote efficient land use,and demands for land must therefore be evaluated in term s of the level of land-use intensity.If the demand is considered excessive,ILU policies act like a“valve”to restrict the land supp ly.Draw ing on data from Chengdu,China,where developable land is scarce,we construct a model using system dynam ics(SD)to simulate two scenarios:ILU development and non-ILU development.The results show thatwhen ILU leads to positive land-use efficiency,land supply will exceed demand,resulting in an appropriate level of real demand for the current population level and GDP.Thus,artificial demand (inflated by investors)is reduced.By contrast,when non-ILU leads to negative land-use efficiency,land demand will exceed supp ly.In this scenario,artificial demand is higher than real demand.
land demand and supply;intensive land use(ILU); developable land;land area;system dynamics(SD)
Introduction
China has the scarcest arable land per capita in the world. The proportion of Chinese population occupies a dominant position in the world.In 2006,China had 12.18 million ha of cultivated land and 0.093 ha per capita,which was less than 50%of the global average[1].
Land attracts investors because it appreciates value over time[2].Ted argued that land is themost important and,at the same time,the scarcest resource in urban development[3].Since the start of the new millennium,rapid socio-economic transitions have occurred in China.Urbanization and industrialization have developed significantly.Dual-track land resource management aggravates the struggle between land supply and demand.On one hand,there is a large demand for land,which comes from different factors such as industry,housing,and infrastructure.On the other hand,land supply comes only from the government.The land department manipulates land acquisitions and land transfers at all levels. This is the only source of land supply.Therefore,macro-level government policies are important tools to maintain the balance between land demand and supply.
The scarcity of land is the direct driving force behind the intensive land use(ILU)policies.ILU policies attempt to regulate land-use structure to maxim ize economic,social,and ecological benefits.The notion of ILU was first discussed in Thünen[4]and later developed by Alfred and Walter in the contexts of Industrial Location Theory and Central Place Theory[5-6].These theorieswere further developed by Ernest et al.[7-9].The Food and Agriculture Organization(FAO)of the United Nations also defined the concept of ILU as a land evaluation program,which we have used in this research,and established a standard evaluation method[10].In regions where land resources are scarce,such as Hong Kong(China),Singapore,Japan,and Korea,ILU policies are often used in high-density urban construction programs[11].
Changes in land demand and supply create land price fluctuations and are key aspects of ILU policies.The main factors contributing to spraw l in Chinawere found to be the land market,the local governments'willingness to lease land as a result of new tax revenue regulations,and the decentralization that resulted from China's economic reforms.Previous studies have shown various additional factors,such as sale limits,rental costs,potential households,infrastructure investment,land reserves,population levels,development modes,anticipated grow th,and physical constraints[12-15].
According to M inistry of Land and Resources of PRC,ILU is a land-use developmentmethod,in which planning-oriented governmental policies and regulations increase the investment,which in turn improves the efficiency and benefits from the land use.Overall,the factors reported in these studies emerge from two sources:themarket itself and the government policies.The market factors are associated with the price of land,while governments try to control land structure through regulations of issues such as lot size and proportion of different land uses.In this study,wemainly discuss the factors that can be controlled through government policies,such as developed land scale and idle controlling rate.
There are two types of land demand that are relevant for understanding the factors involved in ILU.First,there is a basic demand for land thatmust keep pace with population increase and satisfy economic development.Second,there is an artificial demand for land,which occurswhen expected land scarcity and higher rents cause higher investment demand.This pattern becomes a vicious cycle of demand because the higher the land price,themore inventors are interested,and themore artificial demand.An importantquestion emergeshere:how can artificial demand be kept at zero?Currently,the land demand is equal to the real demand.The ILU policies act like a“valve”to regulate land demand.If the land use efficiency reaches a threshold,it is possible to open the“valve”to supply land and keep pace with the population and GDP.If the efficiency is below the threshold,it is possible to close the“valve”to restrict land users from obtaining developable land,which forcesusers to use the owned land more efficiently.The speculative holding of land may also be a factor that reduces the dependence on new developable land[12].
1 Land Demand and Supply in Chengdu,China
Chengdu is a metropolitan city in southwestern of China. In 2010,the population of Chengdu was 10 million,the fourth highest city in the country.The entire area is 11939.00 km2,representing the eleventh largest city in China.Chengdu is located in Sichuan basin and has limited developable land.The basic year of research is 2007.The social-economic factors for this area are taken from the Chengdu Bureau of Statistics and are presented in Table 1.
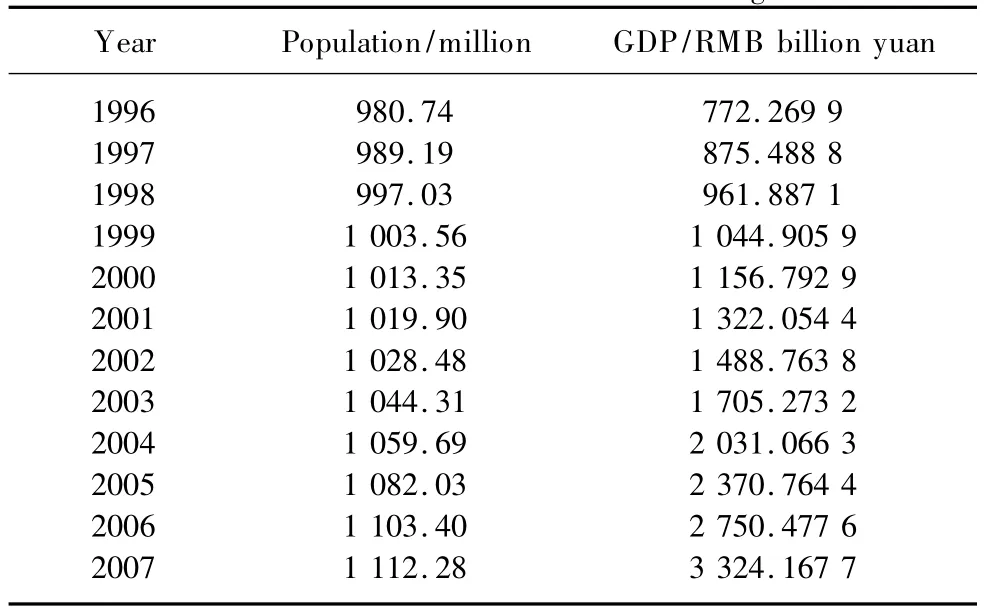
Table 1 Socio-econom ic factors in Chengdu
In China,the national government is effectively the sole owner ofany territory.The local Bureau of Land and Resources (BLR)has direct control over the flow of new land available for development.The BLR determines when and how much new land will be put on themarket,aswell as the allowed uses of this land.The main land uses are industrial,commercial,and residential.The BLRs often sell industrial land by transferring it at prices lower thanmarket value to support local econom ic development.These transferred lands usually have low densities,high-vacancy rates,and low ILU values.By contrast,the BLRs sell the commercial and residential land by auction,and the land prices are decided by competing developers.As a result,the prices for these land types aremuch higher.These auctioned lands have high densities and high ILU values.It is notable that high vacancy rates still exist in these areas because there is high investment demand.The summary statistics of land supply are taken from the BLR of Chengdu and presented in Table 2.
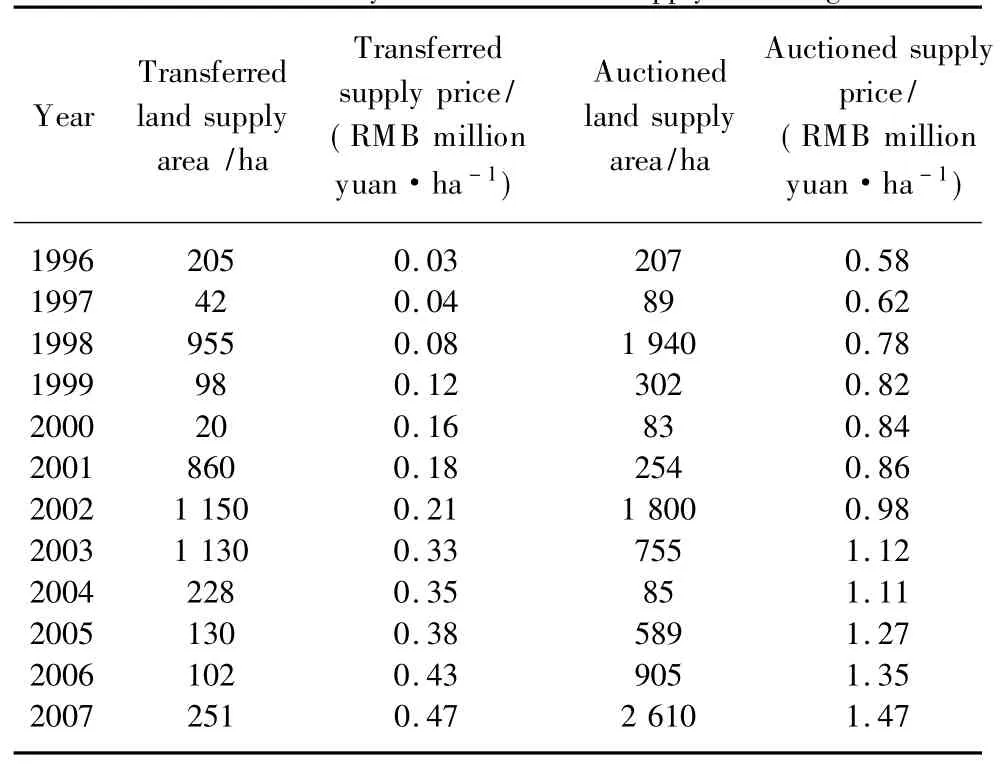
Table 2 Summary statistics of land supply in Chengdu
In China,the governmentalso uses controlling objectives to manage land demand and supply.Themost important objectives are land reserve,intensive land use,idle rate,and per occupied housing unit.These objectives are used to control the land management efficiency of the subordinate BLR by conducting annual supervision of the BLR.The objectives represent important efforts to help maintain an equilibrium between supply and demand.The actual effect of these policies is what we address in this study.To investigate this issue,we project two land use scenarios,ILU development and non-ILU development,and simulate the changes using system dynamics(SD).
Land reserves are an important component of the land supply and demand in Chengdu.Land reserves are governmentowned land that is set aside for future development,and a local basic land reserves uses this value to control the developable land supply.Announcing or adjusting this value at the right time will affect market expectations and lead to a rational market. The value of land reserve is determined by local economic development,land prices,and the previous year's land supply. In China,no national standard is used to set the value.
In Chengdu,another type of land that has been sold for housing,commercial,or industrial development is the land that has been left unused for over one year.This kind of land is described as the idle land.The existence of idle land causes low land use efficiency,low-density use,and low ILU values.In 1999,M inistry of Land and Resource of PRC enacted a policy entitled“Idle Land Management Act”with the goal of reducing the idle rate.The idle rate is calculated by the yearly idle land area versus the total developed land.The rate is announced every year by the local BLRs and acts as a kind of controlling value,not a real value.The rate is simply a management objective of the local BLRs.In this study,we refer to the idle rate as the idle controlling rate and use values between 1%and 5%.The summary statistics of land supply in Chengdu are taken from the BLR of Chengdu and presented in Table 3.
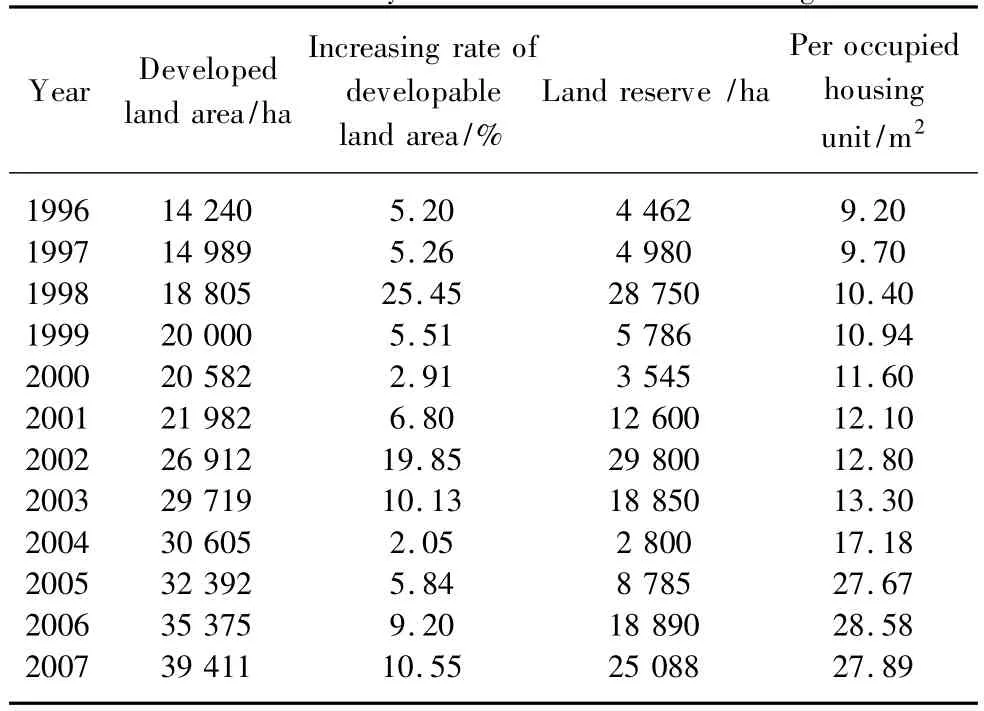
Table 3 Summary statistics of land use in Chengdu
As the figures show,the developed land scale has risen fairly steadily,with an average increase rate of 9.06%. However,the increases are much higher in 1998,2002,2003,and 2007,with the highest rate at 25.45%.The land reserves fluctuate annually,keeping pace with the land development scales.This fluctuation is the resultof strong controlby the local BLRs and lower influence of themarket.The values of the per occupied housing unit increase 5.59%annually.This figure will likely keep growing ata similar pace setting the increasing standard of living.The average value of per occupied housing unit is26-29.7m2in China,while it is over 60m2in U.S.[16]
China's rapid econom ic development over the past three decades has hinged on the high consumption of rural land and the expansion of urban land.The increasing number of houses in recent years has led to a tension between land demand and supply for developable land.M inistry of Land and Resources of PRC instituted ILU policies in 2000,and in 2006 the ministry completed an intensive land use evaluation of six cities,including Chengdu.In general,if a city's intensive land use value exceeds 60,the land use of the city is considered intensive.The BLR of Chengdu led the ILU evaluation in 2006. The researchers chose six cities that had the same level of economic development and used the same indexes and methodsto calculate the ILU values.The results showed that Chengdu had a value of 41.16,Xiamen 31.96,Nanjing 59.57,Shenyang 43.02,Haerbing 62.17,and Hangzhou 62.57. According to these figures,Chengdu was the second-lowest city and described as a non-intensive land use area.
2 Model Structure and Formulation
Themodel used in this study is SD,which analyzes the internal feedback loops and time delays that affect the behavior of an entire system[17].SD is a usefulmodel that can be applied in any context to understanding and shaping the process of changes over time[18-19].Themodeling language is DYNAMO,and themodeling software is Vensim.
A feedback loop consists of state variables,decision variables,and information(Fig.1).A state variable defines the state of the system.A decision variable is based on information,and a decision is made to change(+/-)the system.In thismodel,information abouta state variable is sent to the decision variable[20].
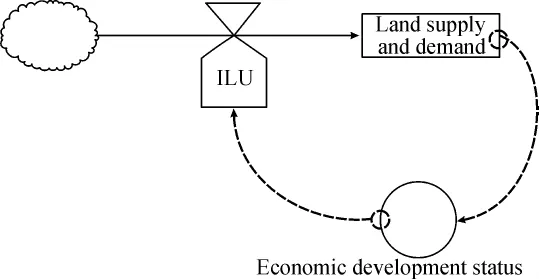
Fig.1 SD feedback loop structure between ILU and land supply and demand
The model attempts to identify the patterns of behavior exhibited by the factors and then builds a feedback to test policies aiming at altering ILU behavior in desired ways.It simulates changes in ILU and land supply factors for the land area and valid demand(Fig.2).Each factor is categorized as a state variable,a decision variable,or information.
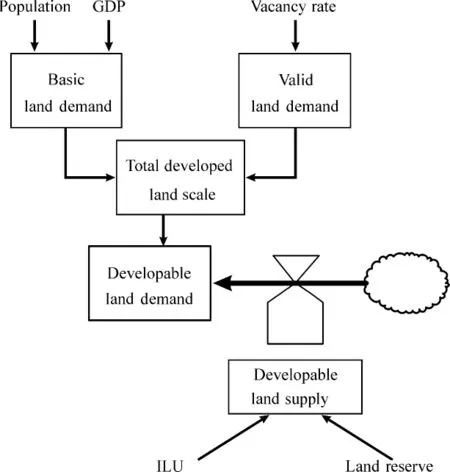
Fig.2 Feedback loop of developable land supply and demand
The basic land demand(B)is the amount of developable lands that support the projected urban expansion,economic development,and improved quality of life,

The variablesαandβare estimated by population(P)and GDP(G),respectively,from 1996 to 2007(Table 1)using linear regression analysis.We calculate the future populations and GDPs using the Grey Prediction Model[21](Table 4).

Table 4 The predicted socio-economic factors in Chengdu
The total developed land area(T)is the total area of regional developed land use.The T from 1996 to 2007 is shown in Table 3.The next year's T is equal to the current T plus the new developable land supply(D),

The developable land demand(A)is the basic land demand minus the previous year's total developed land area,

Finally,the developable land supply(D)is a function of ILU(I)and land reserve(L)in period t.We design two scenarios featuring ILU and non-ILU,which are described in more detail in section 3.In addition,we assume that the functional relationship is log-linear in order to obtain the follow ing supply equation,

The parameters a and b are the adjustment constants of I and L.It is possible to adjust the constants each year through government policies.
3 Simulation Results
The goal of simulation is to integrate the different land-use policies in order to represent an interactive land supply and demand process.Two types of policy variations are examined in this simulation:ILU and non-ILU.Factors for both scenarios are input into themodel to generate the outputs,including total developed land area,developable land supply,and developable land demand.Table 5 outlines the factors for each type of policy.The simulations can provide crucial information about the potential consequences of land-use policies by using information about future grow th to illustrate the qualitative features of these policies.
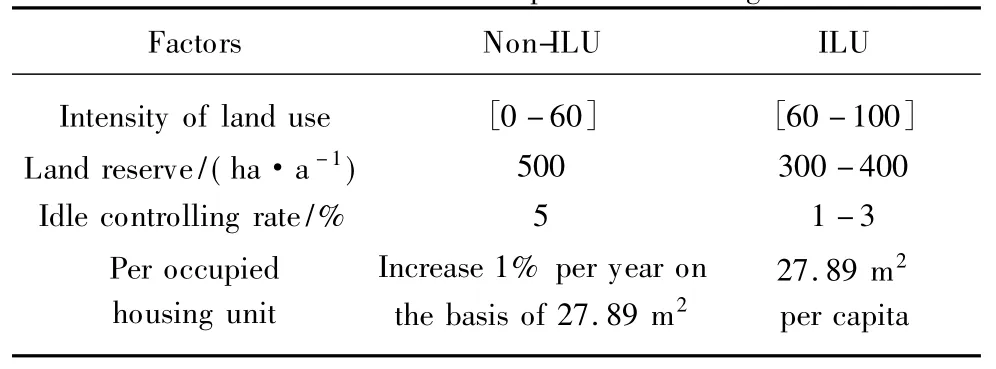
Table 5 Two land-use policies in Chengdu
3.1 Total developed land area
In each scenario,the total land areas grow but at different rates.In the non-ILU developmentmode,the annual grow th is higher.In the ILU developmentmode,the area grows at the same rate between 2011—2013 as that of the non-ILUdevelopment mode;however,after 2014,the grow th slows significantly.In 2015,the area of the ILU developmentmodel is predicted to be approximately 30 km2lower than the area of the non-ILU developmentmode(Fig.3).
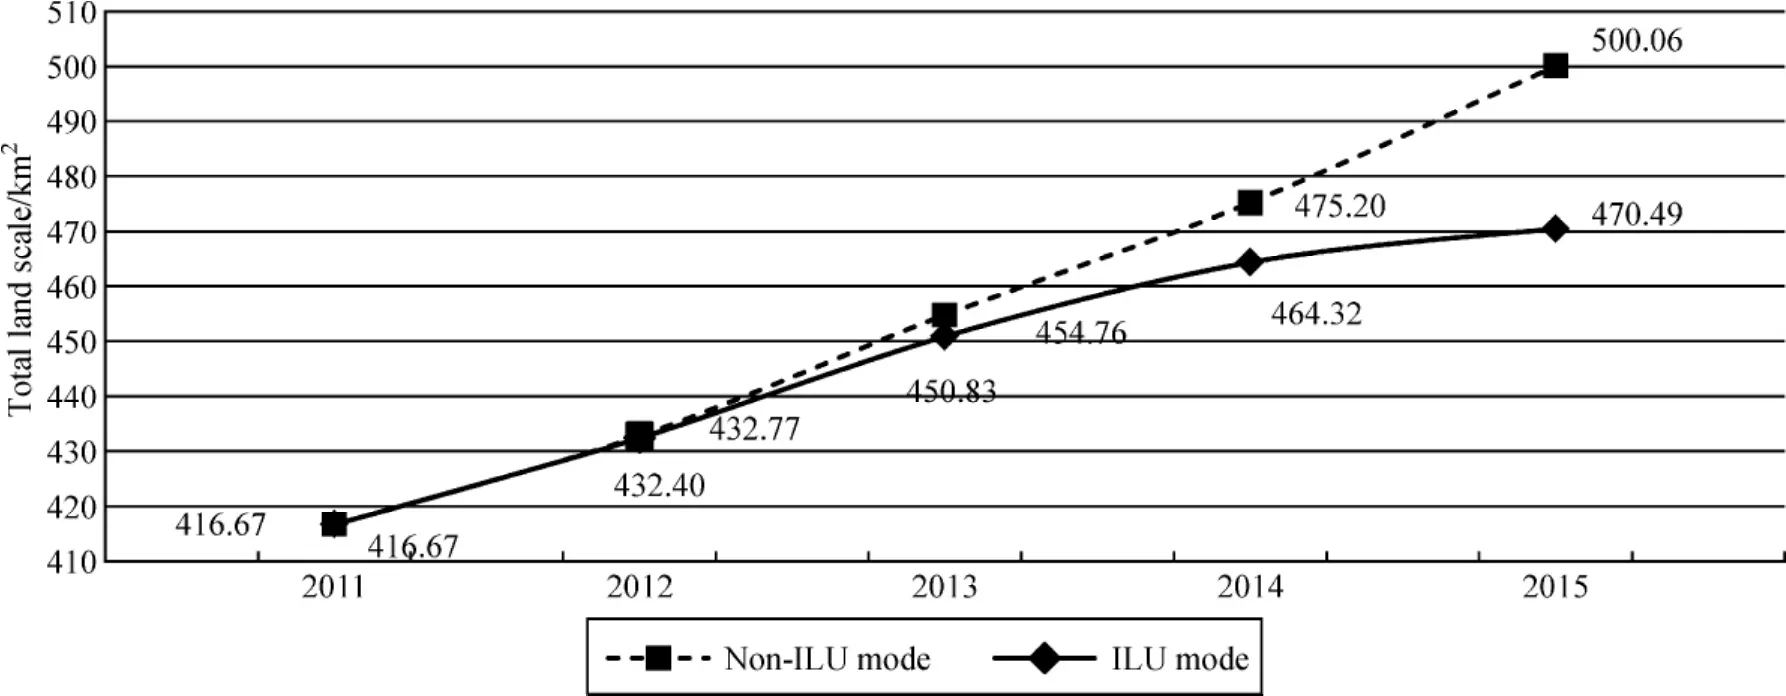
Fig.3 Total land area in different developmentmodes
The total developed land area was 472.57 km2in 2011. The actual data are much higher than the forecasted data (416.67 km2)in the model.Two main reasons drive this result.One reason is that the forecasted population and GDP (Table5)are lower than the actual data.The comparison of the model and reality for 2011 shows that the population are 1 365. 97 and 1 404.8 million for the forecasted data and real data,respectively,and the GDP are 6 631.65 and 6 854.6 Million RMB yuan for the forecasted and real data,respectively. Another reason is the rapid urbanization follow ing theWenchuan Earthquake.
3.2 Developable land supp ly
There are many variations in the supply curves under different ILU modes.The supply curve for non-ILU is higher than that of ILU and continues to climb.By contrast,in the ILU development mode,the supply curve shows an upward trend at first,followed by a steady decline.Although the curve rises in 2014—2015,the highest value is less than the highest value of 2012(Fig.4).
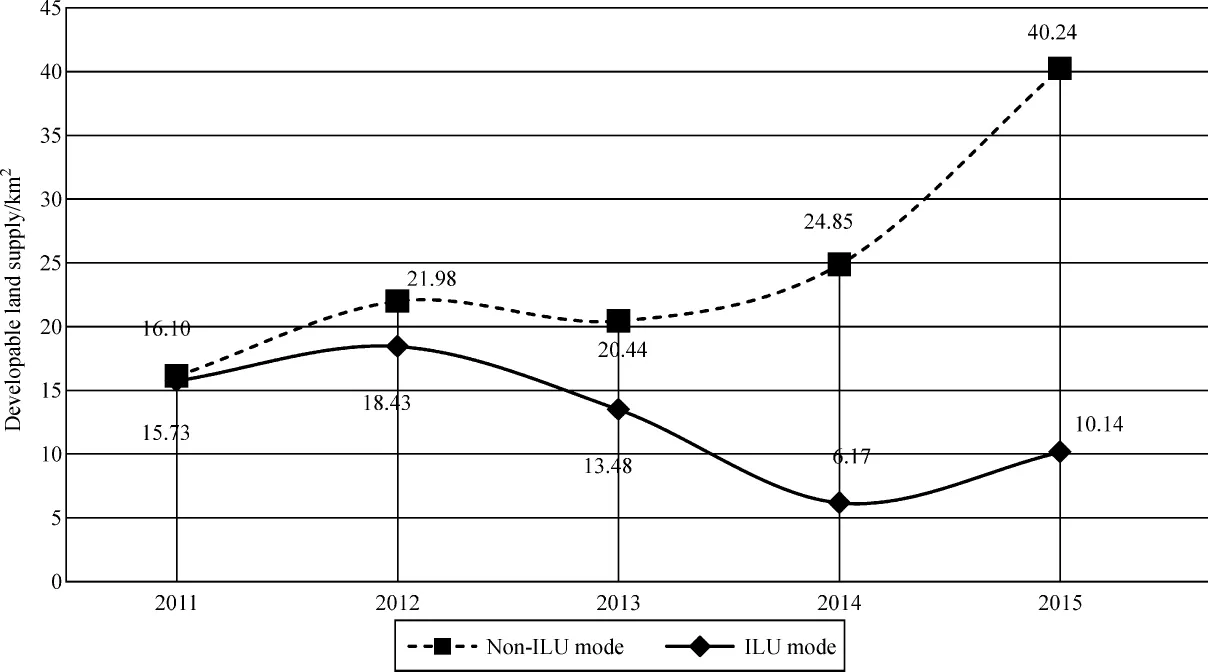
Fig.4 Developable land supply in different developmentmodes
The developable land supply was 26.69 ha in 2011.The actual data aremuch higher than the forecast data,i.e.,15.73 ha for non-ILU and 16.11 ha for ILU in 2011.The forecasted data are influenced by the total developed land area,and we underestimate the needs of social and economic development.
3.3 Developable land demand
From 2011 to 2015,the demand curve for the non-ILU mode ismuch higher than the ILU curve and increases rapidly. The average annual grow th rate in the non-ILU development mode is77.15%greater than that in the ILU developmentmode (Fig.5).
3.4 Relationship between ILU and land demand and supp ly
We use a ratio(Rt)to show the proportion of this year's land supply with land demand,
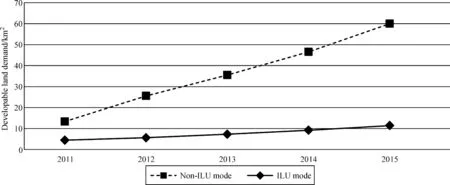
Fig.5 Developable land demand in different developmentmodes

A ratio of 1 means supply equals demand.When the ratio is less than 1,the supply is less than the demand.The lower the calculated values,the higher the negative land-use efficiency.A ratio of 0 means that demand exceeds supply,and no more supply reaches the unanticipated demand.When the ratio is equal to 0.5,the ILU“valve”should be opened or closed,depending on the direction of the curves.This kind of handling will force the land users to use the land more efficiently.
In the non-ILU development mode,we propose a hypothesis.First,the supply meets the entire demand.The demand is also predicted to increase evenly in the non-ILU developmentmode.The ratios of decreases are sustained.After 2012,the demand is predicted to bemuch higher than supply,and the supply will be unable to satisfy the demand.These results are shown in Fig.6.
In the ILU development mode,we propose another hypothesis.First,the demand ismuch higher than the supply. Then,the demand will also show sustained increases in the ILU developmentmode.The difference is that the ratio will keep pace with the increasing demands after 2012,and the supply will be able to satisfy the demand.These results are shown in Fig.7.

Fig.6 The demand for developable land in the non-ILU developmentmode
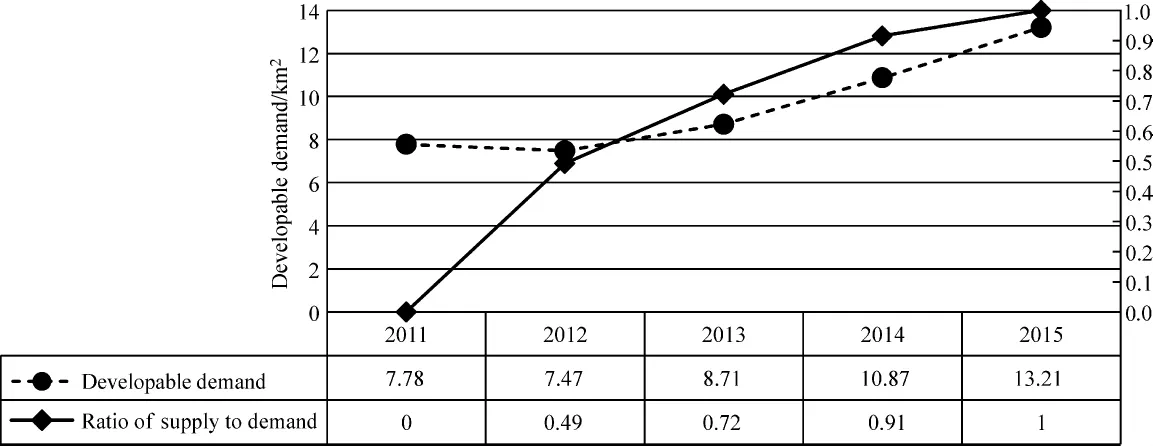
Fig.7 Effective demands for developable land in ILU developmentmode
4 Conclusions
This study presented a dynamic analysis of land demand and supply in Chengdu and provided an important clarification of how ILU affects land demands and supplies in a city.When ILU leads to land-use efficiency,land supply will exceed land demand.In this case,the demand willbe able to keep pacewith the population and GDP,and as a result,artificial demand is lowered.The“valve”is then available to be opened again to increase land supply.When the non-ILU leads to land-use inefficiency,land demand will exceed land supply,resulting in artificial demand being much higher than real demand.ILU policies are able to promote efficient land use only when existing lands are appropriately used.ILU policies are able to measure the land demand and determ ine whether local governments should supply more land.
Throughout China,the government influences and shapes land management through its policies and practices.The results confirm the leverage effects of ILU policy.The governments use the“valve”according to the ILU values.This use will establish the excitation mechanism and promote land-use efficiency.The land supply and demand willeventually form an ideal cycle.
[1]M inistry of Land and Resources of the People's Republic of China.[OL].[2007-09-03](2014-03-01).http://www.m lr. gov.cn/xwdt/jrxw/200704/t20070412_650256.htm.
[2]Perera A.Some Land Planning and Land Development Issues in Sri Lanka[R].Sri Lanka:Department of Town and Country Planning,University of Moratuwa,1996.
[3]Ted K.Should Pola in Urban Centres Have Permanent Buildings[J].Urban Development Authority,2002(3):31-32.
[4]Heinrich T J.The Isolated State[M].Oxford:Pergamon,1966.
[5]Alfred W.The Location of Industries[M].Chicago:University of Chicago Press,1929.
[6]Walter C.Central Places in Southern Germany[M].London: Prentice-Hall,1966.
[7]Ernest B.The Grow th of the City[M].Chicago:University of Chicago Press,1925.
[8]Homer H.The Structure and Grow th of Residential Neighborhoods in American Cities[R].Washington DC: Government Printing Office,1939.
[9]Chauncy H,Edward U.The Nature of Cities[J].Annals of the American Academy of Political and Social Science,1945,242:7-17.
[10]Food and Agriculture Organization.A Framework for Land Evaluation[R].New York:Food and Agriculture Organization,1976.
[11]Lau S S Y,Giridharan R,Ganesan S.Multiple and Intensive Land Use:Case Studies in Hong Kong[J].Habitat International,2005,29(3):527-546.
[12]Peng R J,Wheaton W C.Effects of Restrictive Land Supply on Housing in Hong Kong:an Econometric Analysis[J].Housing Research,1994,5(2):263-291.
[13]Alain B.Measuring Constraints on Land Supply:the Case of Hong Kong[OL].[2009-04-16](2014-03-01).http://alainbertaud.com/images/HK_outline4.pdf.
[14]Zhang T W.Land Market Forces and Government's Role in Spraw l:the Case of China[J].Cities,2000,17(2):123-135.
[15]Hilber C.Supply Constraints and House Price Dynamics:Panel Data Evidence from England[OL].[2009-09-23](2014-03-01).http://cep.lse.ac.uk/sem inarpapers/26-02-10-WV.pdf.
[16]M inistry of Construction of China.2005 Statistic Reporton Urban Housing.[OL].[2007-03-17](2014-03-01).http://wenku. baidu.com/view/3851b4a4284ac850ad024299.htm l.
[17]Road Maps.[OL].[2007-11-25](2014-03-01).http:// clexchange.org/curriculum/roadmaps/rm1.asp.
[18]Antuela T,Stewart R.The Application of Discrete Event Simulation and System Dynam ics in the Logistics and Supply Chain Context[J].Decision Support Systems,2012,52(4): 802-815.
[19]Dean K,Donald M,Ronald R.System Dynam ics:Modeling,Simulation,and Control of Mechatronic Systems[M].Hoboken: John W iley&Sons Inc,2012.
[20]Amy T,CharlesT,Hsiao C T,et al.System Dynam ics Modelling of Product Carbon Footprint Life Cycles for Collaborative Green Supply Chains[J].International Journal of Computer Integrated Manufacturing,2012,25(10):934-945.
[21]Wu W Y,Chen S P.A Prediction Method Using the Grey Model GMC(1,n)Combined with the Grey Relational Analysis:a Case Study on Internet Access Population Forecast[J].Applied Mathematics and Computation,2005,169(1):198-217.
P285.23
A
1672-5220(2015)04-0636-06
date:2014-03-03
Hundred-Talent Program of M inistry of Land and Resources,China
*Correspondence should be addressed to GU Ji-rong,E-mail:gjr@sicnu.edu.cn
 Journal of Donghua University(English Edition)2015年4期
- Journal of Donghua University(English Edition)的其它文章
- Empirical Analysis of Binary Logistic Model for the Influencing Factors of the Chinese Urban and Rural Residents'Woolen Products Consumption—Based on Questionnaires of 513 Urban and Rural Residents in 16 Provinces
- Analysis of Satisfaction with Business Cost in Shanghai Using Structural Equation Modeling Approach
- Ontology Mapping Based on Bayesian Network
- Diurnal and Seasonal Variations in Particulate Matter at Shanghai during the Heavy Haze and Non-haze Periods
- Swept-Volume Display System Based on Cylindrical Space Projection and Curved Reflectors
- Existence of Solutions for Infinity-Point Nonlinear Fractional Boundary Value Problem at Resonance
