我国10城市冬季大气颗粒物中多环芳烃污染及呼吸暴露风险评价
王蕊,苏玉红,卓少杰,韩洋,沈国锋,沈惠中,陈源琛,杜伟,孟文君,陶澍
1.新疆大学化学化工学院,乌鲁木齐 830046 2.北京大学城市与环境学院 地表过程分析与模拟教育部重点实验室,北京 100871
我国10城市冬季大气颗粒物中多环芳烃污染及呼吸暴露风险评价
王蕊1,2,苏玉红,卓少杰2,韩洋2,沈国锋2,沈惠中2,陈源琛2,杜伟2,孟文君2,陶澍2
1.新疆大学化学化工学院,乌鲁木齐 830046 2.北京大学城市与环境学院 地表过程分析与模拟教育部重点实验室,北京 100871

多环芳烃;大气颗粒物;大气污染;暴露风险;冬季
了解大气颗粒物中多环芳烃的组成、分布和潜在来源,可以系统评价环境空气中多环芳烃污染程度,既为个体健康风险提供数据支持,也可为有效控制多环芳烃污染提供重要的科学支撑[12]。目前,国内学者对我国城市大气颗粒物中多环芳烃的污染状况已进行了一些研究,但主要集中在北京、南京、广州等大城市和区域,黄石、南昌、昆明和绵阳等中国二三线城市的相关数据鲜有报道。因此,本文对比研究了广州、昆明、黄石、晋中等10个城市冬季大气颗粒物中多环芳烃的污染水平和空间分布,分析温度条件对其的影响,并估算了各城市居民因多环芳烃呼吸暴露而引起的潜在肺癌风险。
1 材料与方法(Materials and methods)
1.1 样品采集
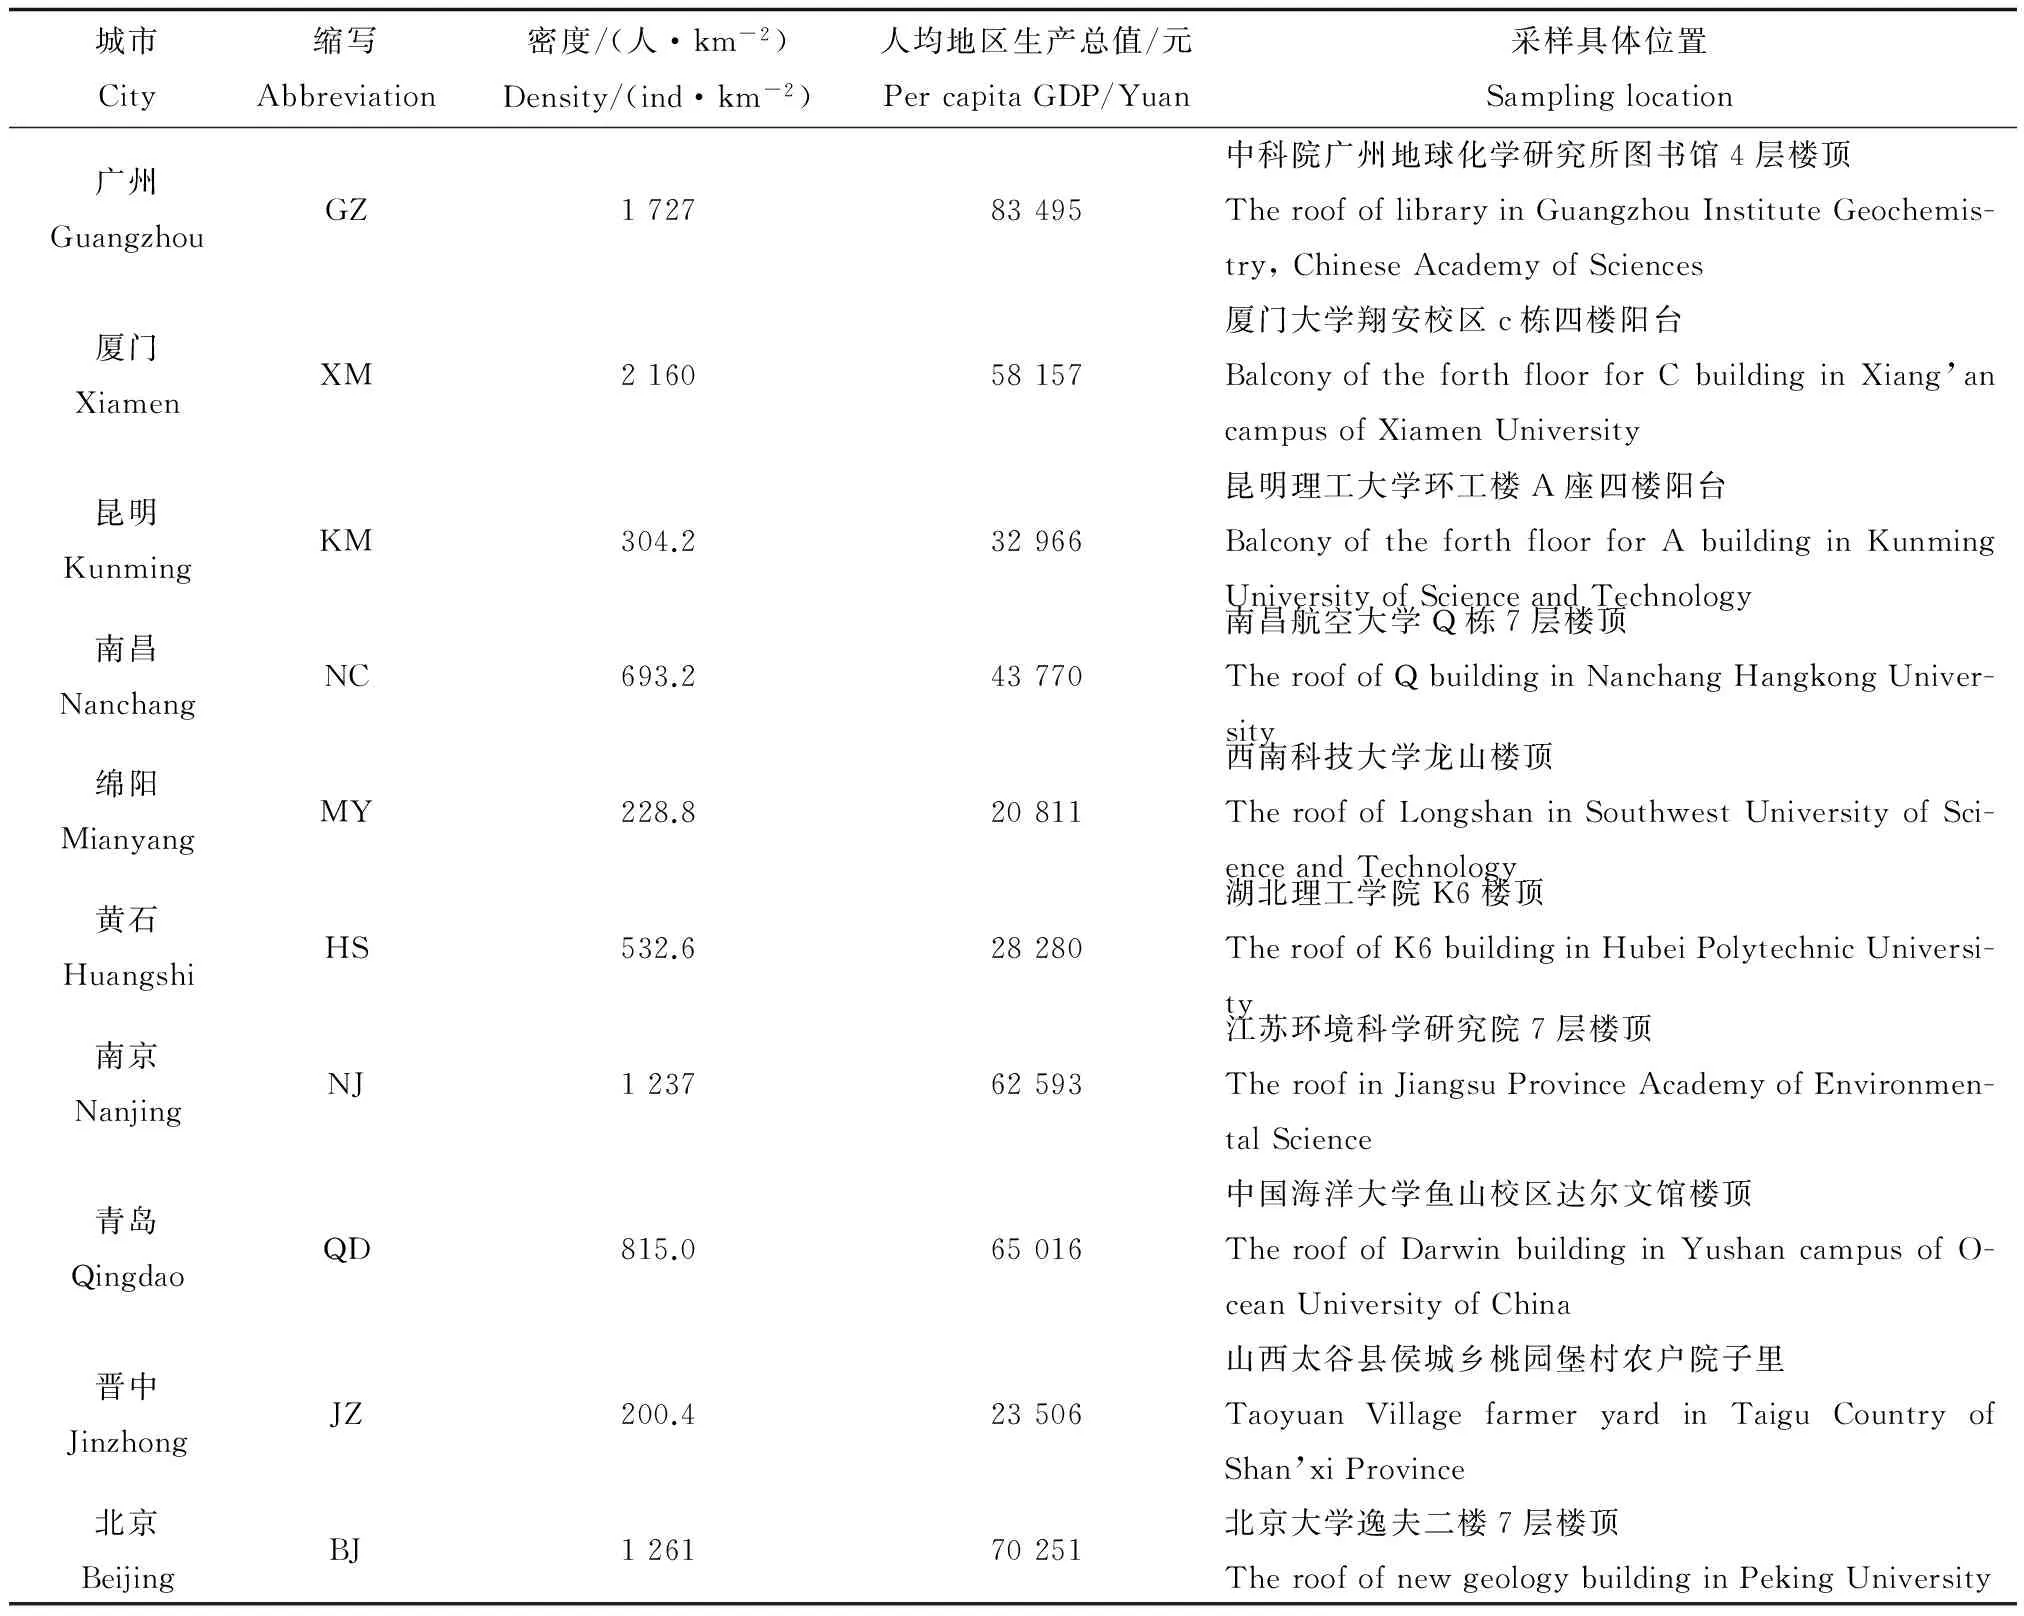
2013年12月和2014年1月,对我国10个城市(广州,厦门,昆明,南昌,绵阳,黄石,南京,青岛,晋中和北京,如图1)进行大气可吸入颗粒物(PM10)的采集,采样点分布在居民、商业及交通等综合区域。10个城市采样点的情况如表1,分布如图1。每次采样持续72 h,各点分别采集4个样品进行分析。
用带有PM10切割头的大流量采样器(中科院广州地球化学研究所)采集大气环境中空气动力学直径小于10 μm的颗粒物(PM10)。流量设为300 L·min-1。采样介质为玻璃纤维滤膜(GFF,20 cm × 15 cm),使用前在450 ℃的马弗炉中灼烧6 h。用高精度分析天平测定颗粒物重量(10-5g,瑞士 Mettler Toledo),采样前后分别将滤膜放置于干燥器中平衡48 h以上。采样后的滤膜用铝箔包裹并保存在-20 ℃冰箱中待处理。
1.2 化学试剂及样品前处理
所用化学试剂及样品前处理过程参见文献Li等[7]。相比于文献,层析柱净化样品时,先后用10 mL正己烷溶剂和50 mL正己烷/二氯甲烷混合溶剂(体积,1:1)淋洗。

表1 10个城市采样点的情况Table 1 The condition of ten sampling sites
1.3 样品分析
中医法5~7分者的30日内死亡率高于2~4分者,差异有统计学意义(x2=55.456,P=0.000<0.05);7分以上者死亡率为89.19%。NEWS法5~7分者的20日内死亡率高于2~4分者,差异有统计学意义(x2=55.088,P=0.000<0.05);7分以上者死亡率为89.04%。见表1。二者的曲线拟合度Z为0.239,P为0.81。
本研究采用气相色谱-质谱(Agilent GC 6890/MSD 5973)串联法分析目标化合物,内标法定量。分析条件参见Li等[7]。

1.4 质量控制
在样品分析过程中,做实验室空白、试剂空白及加标回收实验进行质量控制。实验室空白与试剂空白区别不大。加标回收率为66.1%~109%,平行样的相对偏差不超过10%。随机选择12个样品添加了回收率指示物(2-氟联苯、对三联苯-d14)(表2),2种回收率均值和标准偏差分别为(88.3%±3.40%)和(98.5%±8.73%)。27种PAHs的方法检出限如表3。
1.5 PAH暴露风险参数
ILCRs计算公式如下[9]:
ILCR = CSF × LADD
(1)
LADD = C × IR × ED × EF/(BW×ALT)
(2)
公式中:C是颗粒物中BaP人口密度加权浓度(ng·m-3);IR代表每天空气摄入量(m3·d-1);EF代表每年的暴露频率(d·a-1),一般数值设为350;ED是持续暴露时间(a);BW代表体重(kg);ALT代表平均暴露时间(a);CSF代表致癌强度系数 (mg·kg-1·d)-1,呼吸暴露途径的CSF数值设为26.6,即评价风险的最大值[9,14];LADD代表PAHs的日均暴露剂量(mg·(kg·d)-1)。暴露人群分为3组:儿童(0~10岁)、青少年(11~18岁)及成年人(19~70岁)。

图1 采样点分布与27种PAHs

表2 12个样品的回收率Table 2 The recoveries of 12 samples

表3 27种PAHs的方法检出限Table 3 The method detection limits of 27 PAHs
PAF计算公式如下[10-11]:
(3)
rr(Cbap)=[UURcum.exp=100](Cbap×70/100)
(4)
公式中:rr和URR是根据BaP人口密度加权浓度计算的相对风险(Cbap,μg·m-3)和单元相对风险[15]。基于每年暴露于BaP的浓度为100 μg·m-3[15]和一生暴露70年的假设,URR值设为4.49[10,16]。
2 结果与讨论(Results and discussion)
2.1 PAHs浓度水平及空间分布
大气颗粒物PM10中PAHs的总浓度与PM10浓度存在显著的相关性(r=0.6140,P<0.05)。整个采样期间27种PAHs总浓度(PAH27)如图1。DaiP和DahP在部分样品中没有检出。PAH27变化范围为13.7~2 002 ng·m-3。由图1可知,在所有采样点中,晋中和北京的浓度相对较高,广州、厦门水平相对低。总体特征上,北方点PAHs高于南方点。冬天北方地区需要燃煤或生物质来采暖,这些物质的燃烧都将提高PAHs污染水平。晋中位于山西省中部的晋中盆地南部,本地PAHs污染水平受当地生活源及周围炼焦工业影响严重,且受盆地地势的影响不利于污染物扩散。此外,晋中点附近,受当地居民在冬季使用传统炉灶燃烧大量劣质煤和生物质的影响。南方地区,冬季天气温和,无需大量燃煤或生物质取暖。广州和厦门的PAHs浓度水平低于其他点,这与两个城市的温度高于其他城市有关。Di-mashki等[17]发现单个多环芳烃化合物与温度成负相关,这主要是因为相对高的温度能提高PAHs的反应活性,加快PAHs的光降解速率。在高温条件下,大气中PAHs可以与OH自由基及氮氧化物更快地完成降解过程,同时,较高的温度导致对流更加活跃,污染物更容易扩散。各点PAHs浓度水平及温度高低如图2所示。在研究区域的北方点中,沿海城市青岛的浓度相对低,在南方有类似的发现,沿海城市厦门浓度比其他点低。东部沿海地区一般为平原,地势平坦,有利于污染物的扩散。本研究中冬季大气多环芳烃分布趋势与文献报道一致[18-21]。
2.2 PAHs谱分布

图2 采样点的温度与∑27PAHs
在27种PAHs中,15种优控多环芳烃占80.9%~93.9%。Shen等[22]报道木柴燃烧时排放的16种优控PAHs占总PAHs浓度的比例为84%~95%。各点PAHs的归一化谱图分布见图3。由图可知,不同采样点的谱分布总体特征相似。在27种PAHs中,占主导地位的单体为FLA (7.56%~19.8%),PYR (6.72%~13.8%),CHR (12.8%~19.6%)和BkF (8.59%~15.5%),4者总共贡献PAH27的42.1%~64.3%。这些物种是大气中较为常见的多环芳烃单体。例如,在厦门地区的2004年到2005年PM10中PAHs的研究发现每个季节的15种PAHs中主要化合物均是PHE (16.5%~45.5%),PYR (9.5%~21.4%),FlA (4.3%~21.0%) 和CHR (4.9%~12.7%),这些化合物所占比例为70.2%~83.8%[12]。
按照分子量的大小,PAHs可以分为低分子量化合物(LMWs)和高分子量化合物(HMWs)。LMWs是指分子量小于228的PAHs(从ACE到CcdP),分子量大于等于228的化合物为HMWs(从BaA到DP)。相比于HMWs,LMWs易挥发[23],因此固态比例较低。所有采样点中HMWs比例(58.2%~77.4%) 高于LMWs (22.6%~41.8%)。HMWs由于其高致癌性和致突变性,受到更多的关注。由于本研究北方区域的生活燃料主要依靠煤和生物质,其HMWs的排放比例高,也导致了大气环境中HMWs比重的增大,而南方地区大量的燃煤电厂和煤炭生产等工业排放对HMWs有贡献。
2.3 BaP浓度与潜在肺癌风险分析
由于PAHs浓度水平分布不均和人群暴露行为模式的差别,不同地区的个体暴露水平有显著的差异[10]。在本文中,PAHs污染指示物BaP用于评价潜在的暴露风险。本研究期间,各点的大气BaP浓度变化范围为0.598~97.5 ng·m-3。根据我国空气质量标准,可接受的所有采样点,晋中BaP浓度(97.5 ng·m-3)显著高于国家标准(P<0.05),北京(12.0 ng·m-3)高于国家标准(P >0.05),而其他点低于国家标准(P >0.05)。

图3 采样点多环芳烃谱图分布特征
BaP最高日平均浓度(室外)是10.0 ng·m-3[24]。根据研究区域BaP人口密度加权浓度,表4列举了3组人群(儿童、青少年和成年人)的ILCRs。如表所示,不同地区ILCRs分布规律一致,女性的暴露风险大于男性,由高到低的顺序为成年人、青少年和儿童。一般而言,ILCRs数值介于10-6和10-4之间认为具有潜在的致癌风险,而数值大于10-4表示具有相对高的健康风险[25]。本文中,ILCRs范围为8.94×10⁻⁶~4.77×10⁻⁴,研究区域人群具有潜在的致癌风险。所有采样点中晋中和北京的BaP污染水平相对高,导致当地居民高的致癌风险。
如图4在采样点中依据BaP人口密度加权浓度估算的PAFs变化范围为0.487%~13.2%,均值是3.44%,高于Zhang[10]估算的全国均值(1.6%)。其中,晋中(13.2%)和北京(10.4%)显著高于其他采样城市(P<0.05),说明2个城市大气BaP呼吸暴露是诱发人群肺癌发病的重要因素之一。图4中同时显示了当地肺癌实际发病率[26]。由图可见,肺癌发病率与PAF存在明显的相关关系,PAF高的地区,肺癌实际发病率亦高。虽然BaP只是颗粒态PAHs的一种,甚至是众多大气污染物中的一类组分,但PAHs污染与其他燃烧有关的污染物(如颗粒物等)存在空间共变关系,即PAHs浓度较高的地区,大气颗粒物及其他不完全燃烧产物亦趋于较高污染水平,因此,整体上提高了大气污染物暴露的肺癌风险。
必须指出的是由于本研究只采集室外的大气颗粒物,没有涉及室内的个体暴露。且由于条件的限制,在采样城市只设置1个采样点,因此呼吸暴露风险的评价具有一定的局限性和不确定性。
综上,(1)采样期间,研究区域PAH27总浓度范围为13.7~2 002 ng·m-3,其中厦门浓度最低、晋中最高;从污染水平上看,北方点高于南方,东部沿海城市低于其他点。

表4 采样点ILCRs估算值Table 4 The calculated ILCRs at different sampling sites

图4 采样点的PAFs和肺癌发病率
(2)不同采样点的谱分布总体特征一致。在27种PAHs中,FLA (7.56%~19.8%),PYR (6.72%~13.8%),CHR (12.8%~19.6%)和BkF (8.59%~15.5%),这4种化合物占PAH27的一半左右(42.1%~64.3%)。在27种PAHs中,15种优控化合物所占比例较大(80.9%~93.9%)。
(3)不同采样点的BaP浓度变化范围为0.598~97.5 ng·m-3。通过BaP人口密度加权浓度评价呼吸暴露的健康风险,ILCRs估算数值为8.94×10⁻⁶~4.77×10⁻⁴。据此估算的PAFs数值为0.487%~13.2%,与当地居民肺癌病发率存在相关性。
[1] Liu S Z,Tao S,Liu W X,et al.Atmospheric polycyclic aromatic hydrocarbons in North China: A winter-time study [J].Environment Science & Technology,2007,41(24): 8256-8261
[2] Yang Y Y,Guo P R,Zhang Q,et al.Seasonal variation,sources and gas/particle partitioning of polycyclic aromatic hydrocarbons in Guangzhou,China [J].Science of the Total Environment,2010,408(12): 2492-2500
[3] Wei C,Han Y M,Musa B B,et al.Occurrence,gas/particle partitioning and carcinogenic risk of polycyclic aromatic hydrocarbons and their oxygen and nitrogen containing derivatives in Xi'an,central China [J].Science of the Total Environment,2015,505: 814-822
[4] Ricci P F,Catalano J A,Kelsh M D.Time series (1963-1991) of mortality and ambient air pollution in California: An assessment with annual data [J].Inhalation Toxicology,1996,8: 95-106
[5] Moolgavkar S H.Air pollution and hospital admissions for diseases of the circulatory system in three U.S.metropolitan areas [J].Journal of the Air and Waste Management Association,2000,50(7): 1199-1206
[6] Tan J H,Bi X H,Duan J C,et al.Seasonal variation of particulate polycyclic aromatic hydrocarbons associated with PM10in Guangzhou,China [J].Atmospheric Research,2006,80(4): 250-262
[7] Li W,Wang C,Wang H Q,et al.Atmospheric polycyclic aromatic hydrocarbons in rural and urban areas of Northern China [J].Environmental Pollution,2014,192: 83-90
[8] Jamhari A A,Sahani M,Latif M T,et al.Concentration and source identification of polycyclic aromatic hydrocarbons (PAHs) in PM10of urban,industrial and semi-urban areas in Malaysia [J].Atmospheric Environment,2014,86: 16-27
[9] Shen H Z,Tao S,Liu J F,et al.Global lung cancer risk from PAH exposure highly depends on emission sources and individual susceptibility [J].Scientific Reports,2014,10: 1-8
[10] Zhang Y X,Tao S,Shen H Z,et al.Inhalation exposure to ambient polycyclic aromatic hydrocarbons and lung cancer risk of Chinese population [J].Proceeding of the National Academy of Science of the United States of America,2009,106(50): 21063-21067
[11] Menzler S,Piller G,Gruson M,et al.Population attributable fraction for lung cancer due to residential radon in Switzerland and Germany [J].Health Physics,2008,95(2):179-189
[12] Hong H S,Yin H L,Wang X H,et al.Seasonal variation of PM10-bound PAHs in the atmosphere of Xiamen,China [J].Atmospheric Research,2007,85(3-4): 429-441
[13] 中国国家统计局.中国统计年鉴2013[R].北京: 北京统计出版社,2014
[14] United States Environmental Protection Agency (US EPA).Carcinogen Assessment of Coke Oven Emissions [R].2014,http://cfpub.epa.gov/ncea/cfm/recordisplay
[15] Armstrong B,Hutchinson E,Unwin J,et al.Lung cancer risk after exposure to polycyclic aromatic hydrocarbons: A review and meta-analysis [J].Environmental Health Perspectives,2014,59(10): 655-663
[16] Gibbs G W.Estimating residential polycyclic aromatic hydrocarbons (PAH) related lung cancer risk using occupational data [J].Annals of Occupational Hygiene,1997,41: 49-53
[17] Panther B C,Hooper M A,Tapper N J.A comparison of air particulate matter and associated polycyclic aromatic hydrocarbons in some tropical and temperate urban environments [J].Atmospheric Environment,1999,33(24-25): 4087-4099
[18] Dimashki M,Lim L H,Harrison R M,et al.Temporal trends,temperature dependence,and relative reactivity of atmospheric polycyclic aromatic hydrocarbons [J].Environment Science & Technology,2001,35(11): 2264-2267
[19] Wild S R,Jones K C.Polynuclear aromatic hydrocarbons in the United Kingdom environment: A preliminary source inventory and budget [J].Environment Pollution,1995,88(1): 91-108
[20] Guo Z G,Sheng L F,Feng J L,et al.Seasonal variation of solvent extractable organic compounds in the aerosols in Qingdao,China [J].Atmospheric Environment,2003,37(13): 1825-1834
[21] Li J,Zhang G,Li X D,et al.Source seasonality of polycyclic aromatic hydrocarbons (PAHs) in a subtropical city,Guangzhou,South China [J].Science of the Total Environment,2006,355(1-3): 145-155
[22] Shen G F,Wei S Y,Zhang Y Y,et al.Emission and size distribution of particle-bound polycyclic aromatic hydrocarbons from residential wood combustion in rural China [J].Biomass and Bioenergy,2013,55: 141-147
[23] Agarwal T,Khillare P S,Shridhar V,et al.Pattern,sources and toxic potential of PAHs in the agricultural soils of Delhi,India [J].Journal of Hazardous Materials,2009,163(2-3): 1033-1039
[24] 国家环境保护总局.GB3095—1996环境空气质量标准[S].北京:中国标准出版社,1996
[25] Chen S C,Liao C M.Health risk assessment on human exposed to environmental polycyclic aromatic hydrocarbons pollution sources [J].Science of the Total Environment,2006,366(1): 112-123
[26] 赫捷,陈万青.2012年中国肿瘤年报[M].北京: 军事医学科学出版社,2012
◆
Pollution and Inhalation Exposure Risk of PM10-Bound Polycyclic Aromatic Hydrocarbons during the Winter Time in Ten Cities,China
Wang Rui1,2,Su Yuhong1,*,Zhuo Shaojie2,Han Yang2,Shen Guofeng2,Shen Huizhong2,Chen Yuanchen2,Du Wei2,Meng Wenjun2,Tao Shu2
1.College of Chemistry and Chemical Engineering,Xinjiang University,Urumqi 83046,China 2.Key Laboratory for Earth Surface Processes of Ministry of Education,College of Urban and Environmental Science,Peking University,Beijing 100871,China
17 March 2015 accepted 13 May 2015
Ambient particulate matter (PM) and polycyclic aromatic hydrocarbons (PAHs) pollutions attract wide public attentions due to the adverse impacts on environment and human health.In this study,PM10-bound PAHs samples were collected and analyzed from ten cities in China during a winter time (December,2013 and January,2014).27 parent PAHs including 15 US EPA priority pollutants and 12 non-priority PAHs were analyzed through a laboratory pretreatment by silica gel-alumina column and GC-MS detection.PAH pollution level,composition profiles and spatial distribution were analyzed,and the ILCRs and PAF were calculated to assess potential health risks to humans caused by PAHs inhalation exposure.The results showed that the sum concentration of ∑PAH27ranged from 13.7 ng·m-3to 2 002 ng·m-3.The pollution levels in the northern cities were generally higher than those in the southern cities,and those in the eastern coastal cities were relatively low.Ambient level of PM10-bound PAHs was negatively correlated with temperature.The dominated PAHs found in PM10were bluoranthene (7.56%~19.8%),pyrene (6.72%~13.8%),chrysene (12.8%~19.6%) and benzo(k) fluoranthene (8.59%~15.5%),the total of which contributed to about 42.1%~64.3% of ∑PAH27.Due to PAHs inhalation exposure,estimated ILCRs were from 8.94×10⁻⁶to 4.77×10⁻⁴,and the associated PAFs ranged from 0.487% to 13.2% with the mean of 3.44%,which was higher than the previously reported national average of 1.6%.The study provided valuable basic information for the study on ambient PAHs pollution and associated health outcomes.
PAHs; PM10; air pollution; exposure risk; winter time
国家自然科学基金(41390240,41161160559,41130754)
王蕊(1988-),女,硕士研究生,研究方向为环境污染化学,E-mail: wangrui090613@163.com;
*通讯作者(Corresponding author),E-mail: yuhong_su2010@sina.com
10.7524/AJE.1673-5897.20150317007
2015-03-17 录用日期:2015-05-13
1673-5897(2015)4-096-09
X171.5
A
苏玉红(1973-),女,博士,教授,主要研究方向为环境污染与修复。
王蕊,苏玉红,卓少杰,等.我国10城市冬季大气颗粒物中多环芳烃污染及呼吸暴露风险评价[J].生态毒理学报,2015,10(4): 96-104
Wang R,Su Y H,Zhuo S J,et al.Pollution and inhalation exposure risk of PM10-bound polycyclic aromatic hydrocarbons during the winter time in ten cities,China [J].Asian Journal of Ecotoxicology,2015,10(4):96-104(in Chinese)

