Applicability of Markov chain-based stochastic modelfor bubbling fluidized beds
Zhuang Yaming Chen Xiaoping Liu Daoyin
(Key Laboratory of Energy Thermal Conversion and Control of Ministry of Education, Southeast University, Nanjing 210096, China)
Applicability of Markov chain-based stochastic modelfor bubbling fluidized beds
Zhuang Yaming Chen Xiaoping Liu Daoyin
(Key Laboratory of Energy Thermal Conversion and Control of Ministry of Education, Southeast University, Nanjing 210096, China)
A Markov chain-based stochastic model (MCM) is developed to simulate the movement of particles in a 2D bubbling fluidized bed (BFB). The state spaces are determined by the discretized physical cells of the bed, and the transition probability matrix is directly calculated by the results of a discrete element method (DEM) simulation. The Markov property of the BFB is discussed by the comparison results calculated from both static and dynamic transition probability matrices. The static matrix is calculated based on the Markov chain while the dynamic matrix is calculated based on the memory property of the particle movement. Results show that the difference in the trends of particle movement between the static and dynamic matrix calculation is very small. Besides, the particle mixing curves of the MCM and DEM have the same trend and similar numerical values, and the details show the time averaged characteristic of the MCM and also expose its shortcoming in describing the instantaneous particle dynamics in the BFB.
stochastic model; Markov chain; discrete element method (DEM); bubbling fluidized bed (BFB)
Numerical simulation has been a very popular and effective method to simulate the mixing and flow of particles in granule systems, which can provide detailed information to understand the particle dynamics, such as the discrete element methods (DEM)-CFD model[1-2]and the Eulerian-Granular model[3]. But most of these methods are based on the basic rule and fundamental equations, which requires many computational resources and a long computing time. By comparison, the semi-empirical model has high efficiency and needs low computational loads, such as the plug flow model[4]and the bubbling two-phase model[5]. However, the movement and mixing of particles are impossible to obtain in such kinds of models.
For a compromise, the Markov chain-based stochastic model (MCM) can both quickly compute and have the ability to track the particles in granule systems, particularly in the powder technologies[6-8]. Doucet et al.[9]successfully used the first-order MCM to simulate the mixing of monodisperse particles in a rotating drum. Also, the transition probability of particles moving from one cell to another is directly calculated from a DEM result. The work shows that the MCM has the ability to give a good estimate of the particle dynamics. Ponomarev et al.[10-11]applied the MCM to the static mixer, and they calculated the probability distribution of particles flowing across the mixer according to shape parameters. The model gives very satisfying results, and it is convenient for accounting for the oscillating character of mixing kinetics due to particle segregation.
However, the interaction between the solid phase and gas phase in the fluidized bed is much stronger than that in both the rotating drum mixer and the static mixer. Also, as the existing of bubbles, the flow in the fluidized bed is very complicated. Gottschalk et al.[6]introduced a multiphase MCM for the particle transport in a bubbling fluidized bed (BFB), and made it possible to take into account the finite velocity of fluidization bubbles. The model parameters are determined by mass balance or long-time behavior, e.g., the knowledge of the invariant distribution. As the fluidized bed is discretized into several horizontal cells along with the height of bed, it is impossible to simulate the radial mixing or movement of particles. The results from the MCM are compared with the experimental results, showing that the model accounts for the effects seen. The possibility that the MCM is not necessarily stationary (time-homogeneous) is given. Harris et al.[12]simulated the motion of one single particle moving up and down the riser using the Markov chain. Two models are presented. One is a core-annulus solids interchange model, and the other is a four-zone model that follows from the fast fluidized bed hydrodynamic profile. Models are linked to actual experimental conditions using local particle transfer rates between each model section, and the simulation output agrees well with the experimental data. The macroscopic characteristics of the riser, such as residence time distribution (RTD) and the simulated trajectory of one single particle, can be obtained. Yet, the detailed mixing and particle movement still cannot be calculated.
In this paper, a MCM is introduced to simulate the particle movement in a 2D BFB. The probabilities of particles flowing between two cells are calculated directly from the DEM results. Also, the probability distributions of particle position are calculated from both the static and dynamic transition probability matrices, which are used to discuss the Markov property of the BFB. In order to validate the accuracy of the MCM, the particle mixing of the MCM and DEM simulation are compared, and the suggestion for the further improvement of the MCM is given.
1 Model Description
1.1 Markov chain
A Markov chain is a random process that undergoes transitions from one state to another in a state space, and it can be used to model a random system that changes states according to a transition rule only depending on the current state. The memoryless property of the Markov chain is called the Markov property. The details of the MCM can be found in Ref.[13].
The 2D BFB is discretized tomequal divisions in width, andnequal divisions in height. Thenmseparate cells formnmstates of a Markov chain as shown in Fig.1.

Fig.1 Discretized fluidized bed with nm cells
The details of the bed are shown in Tab.1.
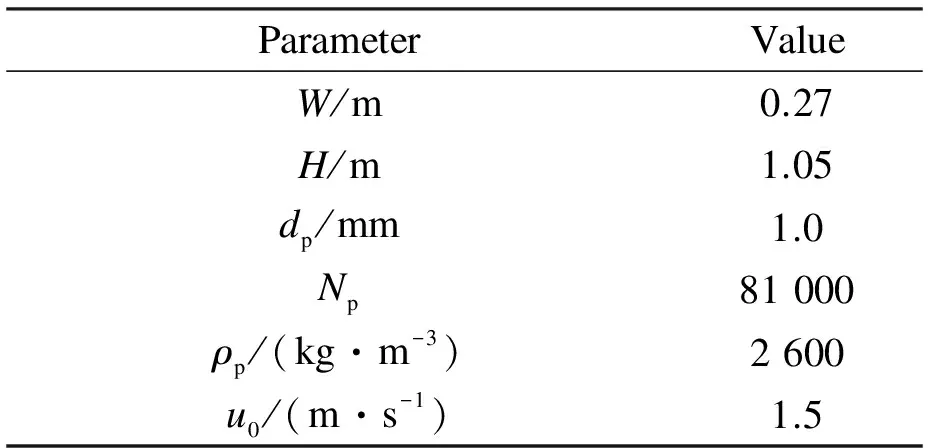
Tab.1 Details of the BFB
So the transition probability matrix has the size ofnm×nm, which is calculated from the statistical data of a DEM simulation.
In this research, the actual time of DEM simulation is from 0 to 20 s, and the simulation time of MCM is from 15 to 20 s. The transition probability matrix of MCM is calculated using the results of DEM from 10 to 15 s, as shown in Fig.2. That is, the MCM learns the statistical rules of particle motion from the DEM results, and follows the rules to impel particle system running. What needs to be emphasized is that the DEM simulation of the actual 5 s (15 to 20 s) costs about 20 h, while the MCM only costs about 15 min. So the MCM is very efficient.

Fig.2 The simulation time of two models
In this paper, time step Δtis set to be 0.025 s. The calculation details of the transition probability matrix based on the Markov chain are presented as follows. Assuming that from the momenttptotp+1, there areNijparticles moving fromSitoSj, and there areNparticles in the stateSiat the momenttp. The transition probabilityPijfrom the momenttptotp+1can be calculated through the following relationship:
(1)
The transition probabilities between any other two states at this time step can be calculated by the same method, and they form the matrix of transition probabilities at each time step. The average value of different matrices at different time steps is the final transition probability matrix for the MCM. As the probability that particles move between any certain two states is fixed, this 2D matrix is called the static transition probability matrix. What needs special note is that the period of DEM simulation results for the calculation is a stable condition and is fully developed.
Once the transition probability matrix is obtained, the probability distribution of particle position can be easily calculated at any time. A Monte-Carlo method is employed to move a certain particle from one state space to another based on the transition probability and a random number generated by computers.
1.2 Model applicability

(2)
The new transition probability between every two states is not fixed, so this 3D matrix is called the dynamic transition probability matrix. The calculation of transition probabilities is still based on the results of DEM simulation. In addition, the dynamic matrix significantly needs much more computer memory and a longer computing time.
2 Results and Discussion
2.1 Discussion of Markov property of the BFB
The transition probability matrix is one of most important parts of the stochastic model. Once the matrix is obtained, it is convenient to calculate the probability distribution of particle positions, which is helpful to understand the macroscopic properties of the particle movement.
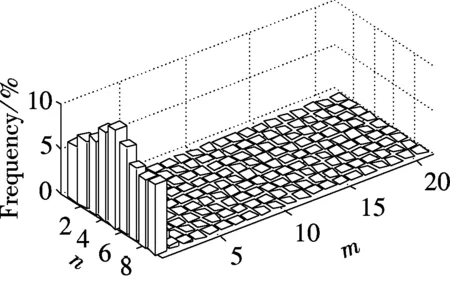
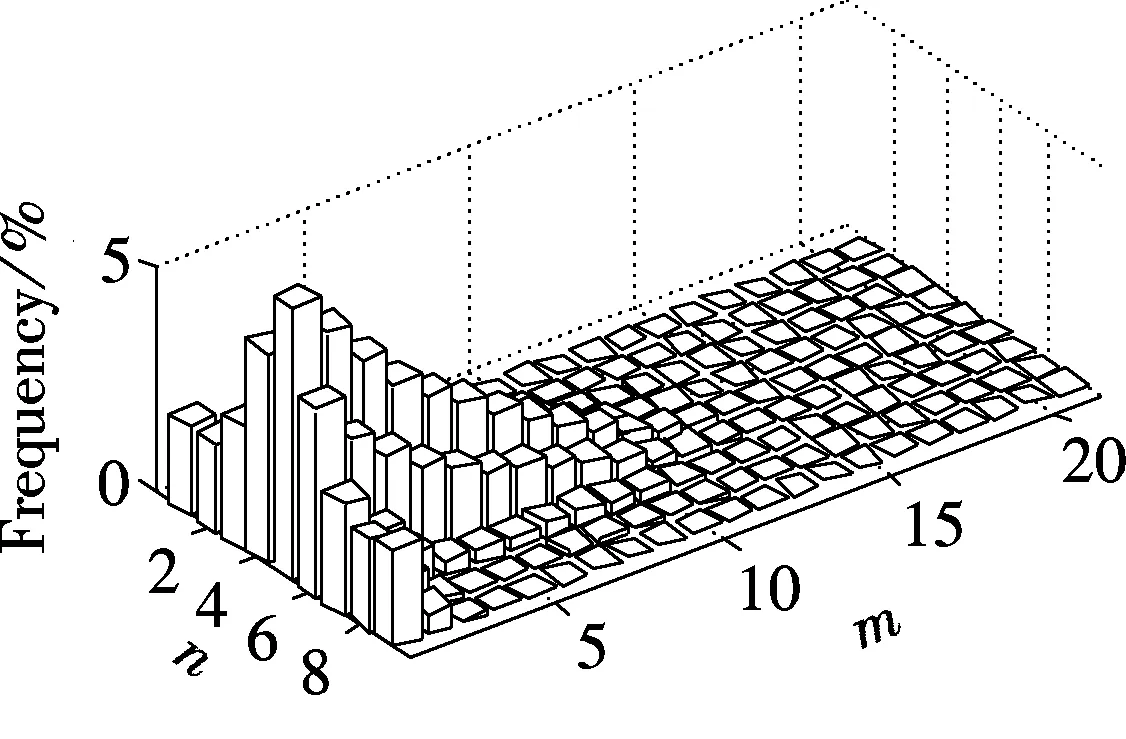
Fig.3 is the probability distribution of the position of a batch of particles at 0.05, 0.30, 0.55, 0.80, 1.05 and 1.30 s after being put into the bottom of the bed, which is calculated by the static transition probability matrix based on the Markov chain. The particles first flow up and tend to come close to the middle of the bed. Then, they spread and flow down at the top of the dense phase region as the bubbles break. Finally, the particles gradually spread over the whole dense phase region. The probability distribution of particle position shows the overall particle movement and demonstrates the back mixing characteristics of the particles in the BFB.
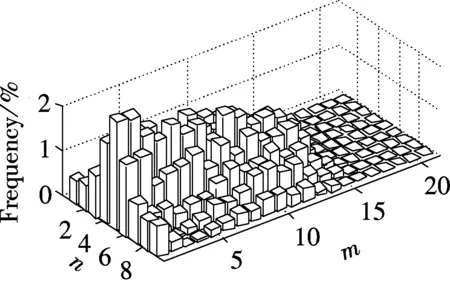
In order to discuss the Markov property of the BFB, Fig.4 shows the probability distribution of the particle position calculated using the dynamic probability transition matrix. While the computation loads and time costs of dynamic matrix calculation are almost one thousand times that of the static matrix, the probability distribution of particle position does not change much both in the overall trend and details. Although it cannot be definitely proved that the particle movement in the BFB has the Markov property to meet the need of Markov chain, using the MCM to simulate the particle movement in the BFB still has some basis through this comparison.
(a)
(b)

(c)

(d)

(e)

(f)
Fig.3 Probability distribution of particle position based on the static transition probability matrix. (a) 0.05 s; (b) 0.30 s; (c) 0.55 s; (d) 0.80 s; (e) 1.05 s; (f) 1.30 s

(a)

(b)
(c)

(d)

(e)

(f)
Fig.4 Probability distribution of particle position based on the dynamic transition probability matrix. (a) 0.05 s; (b) 0.30 s; (c) 0.55 s; (d) 0.80 s; (e) 1.05 s; (f) 1.30 s
2.2 Comparison of the particle mixing of two models
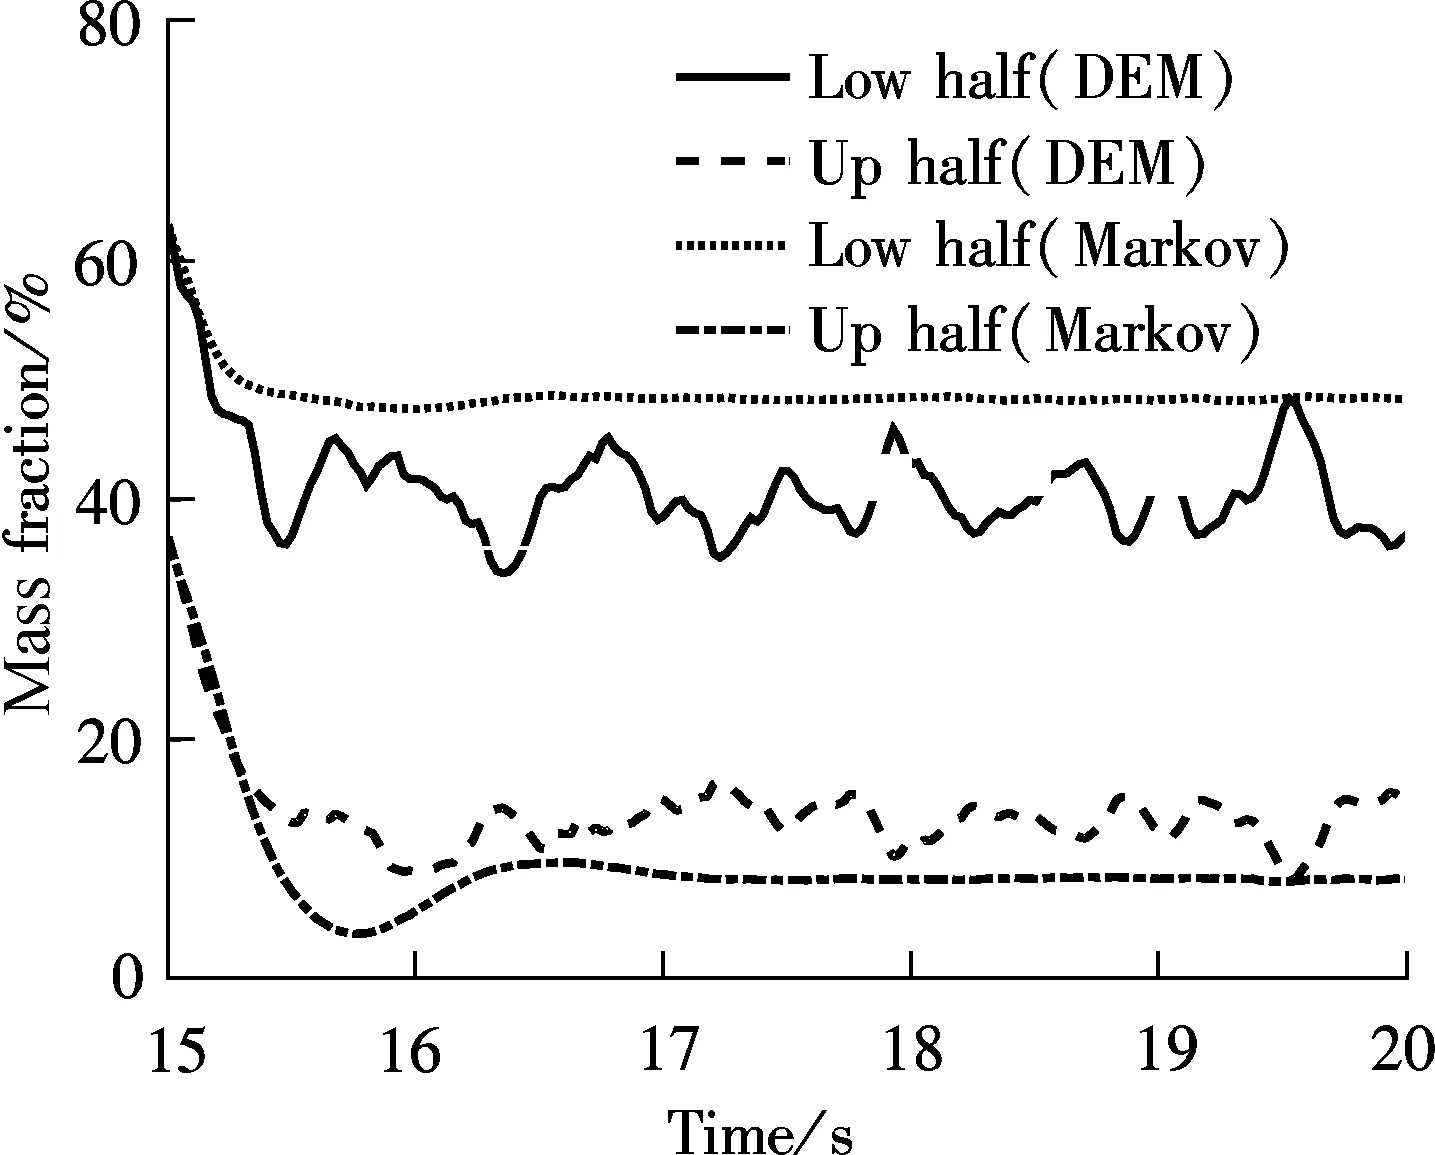
In order to validate the accuracy of MCM, the particle mixing of MCM is compared with that of the DEM simulation. To better understand the radial particle mixing in the BFB, the bed is divided into two parts, the left half and the right half. At the moment of the 15th second, which is the time that MCM starts calculating, particles are marked as left half if they are in the left half bed, and are marked as right half if they are in the right half bed. In the same way to study the axial particle mixing, particles over the height of 0.25 m of the bed are marked as up half, and below the height of 0.25 m of the bed are marked as below half. Figs.5(a) and (b) show the radial and axial particle mixing of both DEM and MCM in the BFB, where the number fraction means the percentage of marked particles that still remain in the original part of the bed in the process of simulation.

(a)
(b)
Fig.5 shows that there are about 54% particles in the left half bed, and about 44% particles in the right half bed at the moment of the 15th second. Then after 5 s of DEM simulation, about 50% original left half particles move to the right half bed, and also about 50% right half particles move to the left half bed. The radial mixing of MCM has the same trend, but the mixing speed is slow. Another clear difference is that the mixing curves of MCM are much smoother than those of DEM. From the comparison of axial particle mixing of two models shown in Fig.5(b), there are much more particles in the low half of the bed (about 65%) than in the up half of the bed (about 35%) at the beginning. As the asymmetry of low and up half bed, about two-thirds of the original low half particles move to the up half bed, and about one-third of the original up half particles move to the low half bed in the rest time of DEM simulation. While the particle mixing is a little slower in the low half bed and a little faster in the up half bed of MCM compared to that of DEM. Besides, the mixing curves of MCM are still very smooth compared to that of DEM.
On the one hand, the bubbles have strong effect on the particle mixing in the BFB, and the effect becomes stronger and stronger as the bubbles increase, combine or break along with the height of the bed. MCM only pays attention to the particle phase and uses the averaged static transition probability matrix. The effect of bubbles on the particle mixing is much weakened in the MCM. This may be the reason why the mixing curves are so smooth in MCM, and there are differences in the mixing speed between the two models. However, the comparison of particle mixing of the two models demonstrate the ability of MCM in describing the time averaged mixing trend of particles in the BFB, although its instantaneous particle mixing characteristics is not so good as the DEM.
3 Conclusion
The comparison between static and dynamic transition probability matrices shows that it is reasonable to develop the MCM of BFB, because it is highly effective and partly has the ability to describe both macroscopic and microscopic movement of particles in the bed, such as the probability distribution of particle position and particle mixing. The accuracy of MCM is validated by the particle mixing comparison with the DEM simulation. As the bubble phase cannot be negligible in BFB, the simple Markov chain that only calculates particle phase is not sufficient for the MCM to match DEM on the details of particle dynamics. The bubble phase or other factors should be considered using appropriate methods to improve the MCM of BFB.
[1]Luo K, Fang M, Yang S, et al. LES-DEM investigation of an internally circulating fluidized bed: effects of gas and solid properties[J].ChemicalEngineeringJournal, 2013, 228: 583-595.
[2]Zhang Y, Jin B, Zhong W, et al. DEM simulation of particle mixing in flat-bottom spout-fluid bed[J].ChemicalEngineeringResearchandDesign, 2010, 88(5): 757-771.
[3]Ding J, Gidaspow D. A bubbling fluidization model using kinetic theory of granular flow[J].AIChEJournal, 1990, 36(4): 523-538.
[4]Ali M, Mahmud T, Heggs P J, et al. A one-dimensional plug-flow model of a counter-current spray drying tower[J].ChemicalEngineeringResearchandDesign, 2014, 92(5): 826-841.
[5]Gordillo E D, Belghit A. A two phase model of high temperature steam-only gasification of biomass char in bubbling fluidized bed reactors using nuclear heat[J].InternationalJournalofHydrogenEnergy, 2011, 36(1): 374-381.
[6]Gottschalk T, Dehling H G, Hoffmann A C. Multiphase stochastic model for fluidized beds[J].PhysicalReviewE, 2008, 77(3): 031306.
[7]Tjakra J D, Bao J, Hudon N, et al. Modeling collective dynamics of particulate systems under time-varying operating conditions based on Markov chains[J].AdvancedPowderTechnology, 2013, 24(2): 451-458.
[8]Berthiaux H, Mizonov V, Zhukov V. Application of the theory of Markov chains to model different processes in particle technology[J].PowderTechnology, 2005, 157(1): 128-137.
[9]Doucet J, Hudon N, Bertrand F, et al. Modeling of the mixing of monodisperse particles using a stationary DEM-based Markov process[J].Computers&ChemicalEngineering, 2008, 32(6): 1334-1341.
[10]Ponomarev D, Mizonov V, Gatumel C, et al. Markov-chain modelling and experimental investigation of powder-mixing kinetics in static revolving mixers[J].ChemicalEngineeringandProcessing:ProcessIntensification, 2009, 48(3): 828-836.
[11]Ponomarev D, Mizonov V, Berthiaux H, et al. A 2D Markov chain for modelling powder mixing in alternately revolving static mixers of Sysmix®type[J].ChemicalEngineeringandProcessing:ProcessIntensification, 2009, 48(11): 1495-1505.
[12]Harris A T, Thorpe R B, Davidson J F. Stochastic modelling of the particle residence time distribution in circulating fluidized bed risers[J].ChemicalEngineeringScience, 2002, 57(22): 4779-4796.
[13]Zhuang Y, Zhao M, Liu D, et al. Modeling of the particle residence time distribution in fluidized bed risers using a stationary DEM-based Markov process[C]//The11thInternationalConferenceonFluidizedBedTechnology. Beijing, China, 2014: 395-400.
基于马尔科夫链随机模型的鼓泡床适用性
庄亚明 陈晓平 刘道银
(东南大学能源热转换及其过程测控教育部重点实验室, 南京 210096)
为了模拟二维鼓泡流化床(BFB)中的颗粒运动,建立了基于马尔科夫链的随机模型(MCM).用离散化的床体网格定义状态空间,并根据离散单元模型(DEM)的运算结果直接计算转移概率矩阵.通过对比静态和动态转移概率矩阵的模拟结果来讨论BFB的马尔科夫特性.基于马尔科夫链计算静态矩阵,基于颗粒运动有后效性计算动态矩阵.结果表明:静态和动态矩阵模拟的颗粒运动趋势差别很小.此外,MCM和DEM模拟的颗粒混合曲线趋势相同且数值相近,曲线细节表明了MCM的时均性特点,也暴露了其在描述 BFB颗粒运动瞬时特性方面的缺陷.
随机模型;马尔科夫链;离散单元模型(DEM);鼓泡流化床(BFB)
TQ16
Foundation items:The National Science Foundation of China (No.51276036, 51306035), the Fundamental Research Funds for the Central Universities (No.KYLX_0114).
:Zhuang Yaming, Chen Xiaoping, Liu Daoyin. Applicability of Markov chain-based stochastic model for bubbling fluidized beds[J].Journal of Southeast University (English Edition),2015,31(2):249-253.
10.3969/j.issn.1003-7985.2015.02.016
10.3969/j.issn.1003-7985.2015.02.016
Received 2015-01-02.
Biographies:Zhuang Yaming (1990—), male, graduate; Chen Xiao-ping (corresponding author), male, doctor, professor, xpchen@seu.edu.cn.
 Journal of Southeast University(English Edition)2015年2期
- Journal of Southeast University(English Edition)的其它文章
- Adaptive modulation in MIMO optical wireless communication systems
- An improving energy efficiency cooperation algorithm based on Nash bargaining solution in selfish user cooperative networks
- Performance analysis of an O2/CO2 power plantbased on chemical looping air separation
- Model of limestone calcination/sulfation under oxy-fuel fluidized bed combustion
- A novel carbon trap sampling systemfor coal-fired flue gas mercury measurement
- Composite bioabsorbable vascular stents via 3D bio-printingand electrospinning for treating stenotic vessels
