The Burial of Biogenic Silica, Organic Carbon and Organic Nitrogen in the Sediments of the East China Sea
WANG Lisha, ZHANG Chuansong, and SHI Xiaoyong, 3), *
The Burial of Biogenic Silica, Organic Carbon and Organic Nitrogen in the Sediments of the East China Sea
WANG Lisha1), 2), ZHANG Chuansong1), 2), and SHI Xiaoyong1), 2), 3), *
1),,266100,..2),,,266100,..3),100194,..
We sampled the sediments of the East China Sea during 2005 and 2006, and analysed the contents of the biogenic matters: biogenic silica, organic carbon, and organic nitrogen. From the surface distribution we found the contents of these substances to be in the ranges of 0.72%-1.64%, 0.043%-0.82%, and 0.006%-0.11%, respectively. Their distributions were similar to each other, being high inside the Hangzhou Bay and low outside the bay. The vertical variations of the contents were also similar. In order to discuss the relation between them we analysed the variations of content with depth. They increased in the first 7cm and then decreased with depth. The peaks were found at depths between 20 to 25cm. The distribution of carbonate showed an opposite trend to that of biogenic matters. The content of total carbon was relatively stable with respect to depth, and the ratio of high organic carbon to carbonate showed a low burial efficiency of carbonate, which means that the main burial of carbon is organic carbon. In order to discuss the source of organic matters, the ratio of organic carbon to organic nitrogen was calculated, which was 8.01 to 9.65, indicating that the organic matter in the sediments was derived mainly from phytoplankton in the seawater.
burial; sediment; biogenic matters; carbon and nitrogen ratio; East China Sea
1 Introduction
Marine sediments are composed of terrestrial materials transported by rivers, atmospherically-driven dust, and particles formed in situ biologically or inorganically (Chester, 1990; Krause., 2013). Chemical composition of marine sediments reflects the source of these materials, their interaction with the ambiance, and diagenisis of the sediments (Calvert and Pedersen 1993;Amanda., 2011). Biogenic silica (BSi) is one of the major biogenic components of oceanic sediments and an important element in the marine ecosystem, produced by diatoms, silicoflagellate and radiolarian in the euphotic layer (Nelson., 1995; De Master, 2002; Ragueneau., 2005; Hou., 2011). Furthermore, biogenic silica in sediments has the potential to be a proxy of paleo-pro- ductivity (Lyle., 1988; Mortlock., 1991; Krause., 2009). Diatoms account for over 40% of global primary production and are major vehicles in the organic carbon cycle, facilitating matter transfer towards both higher trophic levels (Ryther, 1969; Cushing, 1989; Hu., 2013) and the deep sea (Goldman, 1988; Bues-seller, 1998; Boyd and Newton, 1999; Blair and Aller, 2012). POC (particle organic carbon) can be produced by living phytoplanktons in the surface ocean and phytoplankton remains buried in the sediments is the main source of the organic carbon (OC) in the sediments. Some phytoplankton remnants can be mineralized in the process of deposition and the process leads to high nutrient concentrations (Hanson., 2000). Organic nitrogen (ON) is a major component of phytoplankton and would deposit to sediments upon the plankton’s death. And this is the main source of nitrogen in the sediment. In general, the biogenic matters in the sediment (BSi, OC, ON) are associated closely with the deposition of phytoplankton activities. Furthermore, concentrations of biogenic matters in the sediment are controlled by seawater mixing and horizontal diffusion.
The spatial distribution of opal content and OC have been widely studied both in coastal-shelf areas (DeMaster, 1981; Kamatani and Oku, 2000; Liu., 2002; Chen., 2009; Li., 2012; Li., 2014) and in the deep ocean (Ragueneau., 2001). However, only a few scientists have studied the changes of quantification in the biosiliceous paleoproductivity of the superficial layer of a water column (Anderson., 1998; Masqué., 2003; Shibamoto and Harada, 2010; Xing., 2011). Furthermore, little research has focused on the distribution and relationships of biogenic matter. In this study, we investigated the burial mechanism in the East China Sea near the Changjiang Esturary through the dilution effect of runoff, biology content and deposition rate, discussed the distribution of biogenic matters and the harmful algae blooms events in this area in history and revealed the origination of biogenic matters.
2 Sampling and Analysis
2.1 Sampling
Sediment cores were sampled in the East China Sea during two cruises in the spring months (late April to early May) of 2005 and 2006 using home-made multiple gravity corer. We sampled 6 sediments in 2005 and 10 sediments in 2006 (Fig.1). All of the sediments are clay. Because the sediment of the first 7cm is the major zone of exchange of chemical elements between sediments and seawater, the cores were cut in interface of 1cm for the first 0-10 cm segment downward from the surface and 2 cm for the rest 10-42 cm. A total of 22 segments were cut and frozen at −20℃.

Fig.1 The sampling stations (a-spring 2005; b-spring 2006).
2.2 Parameter Measurement in the Sediments
After being pretreated by a lyophilizing machine for 3-4d, approximately 100mg of parallel dried samples were weighed and placed into 50mL centrifuge tubes. One tube was used to determine the content of biogenic silica. In this tube, 5mL of 10% H2O2and 5mL of 2 molL−1HCl solution were added to remove the organic matter and carbonate. The content of biogenic silica was determined as per the chemical method of Mortlock and Froelich (1989). To the treated sediments 40mL 2molL−1sodium carbonate solution were added. The supernatant solution was extracted every other hour at 85℃. By determining concentration of silicate in the supernatant solution, the biologic silica content was calculated by extrapolation with the relationship between time and silicate amount. Before the supernatant solution was removed, the tube was centrifuged. For the determination of the contents of organic carbon and organic nitrogen, to another tube was added 4mL of 2molL−1HCl during 24h of vibration to remove the carbonate. The carbonate content was determined by measuring the weight difference before and after the addition of HCl. After removing the inorganic carbon, the organic carbon and organic nitrogen concentrations were determined using a PE2400II CHN analyzer.
3 Results and Discussion
3.1 The Components in the Surface Sediments
The results of analyzing the components in the surface sediments are shown in Fig.2.
3.1.1 Biogenic silica (BSi)
The biogenic silica content ranged from 0.72% to 1.64% with a mean of 1.21% for samples collected in 2005. The highest biogenic silica content (1.64%) occurred in Station ZC17, located in the southern part of the survey area where there is low input of river, while the lowest content (0.72%) was in RB12, on the outside of Hangzhou Bay in the northern part of the survey area with more input of river. For those collected in 2006, biogenic silica content ranged from 0.77% to 1.51% with a mean of 1.23%. In general high biogenic silica content was recorded from a number of stations near the center of the investigated area with low deposition rate. The station with the highest biogenic silica content (1.51%) occurred again in ZC17. The station with the lowest biogenic silica content (0.77%) was in RB08, which was near RB12 in the northern part of survey area.
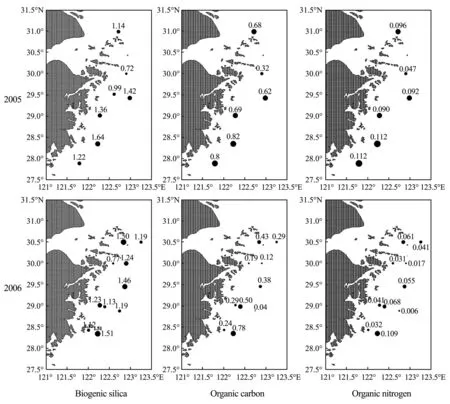
Fig.2 The distribution of biogenic silica, organic carbon, and organic nitrogen in the surface sediment (%) in 2005 and 2006.
The BSi burial in the sediments was explained with monsoon, gain-size distribution (Hou., 2008; Wang., 2014) and with three factors: the dilution of suspended matter from the river, the quantity of diatoms in the seawater, and the deposition rate. When terrestrial dilution increases, more substances would be removed from the river, causing a decrease in the biogenic silica content in the suspended substances and then a decrease in the biogenic silica content in the sediments. This process could explain why the biogenic silica content of the surface sediments was low outside Hangzhou Bay. Diatoms in a euphotic zone absorb the silicate in the seawater to construct their cells. Upon death, their skeletons deposit, providing a source of biogenic silica and are the main constituents of the BSi in the sediments in coastal areas (Wang, 2014). The layer the quantity of diatoms, the more the biogenic silica deposit in sediment. In the study area, the diatoms dominate the phytoplankton every year, which could be responsible for high biogenic silica content in the region of frequent Harmful Algae Blooms (HAB).
The biogenic silica produced in the surface seawater is mostly dissolved during deposition and only a small amount of them could be buried in the sediments (Tréguer, 1995). Fast deposition would favor biogenic silica to be preserved in the sediment, or versa. In this study Station HB08 was in a region of fast deposition (Duan., 2005; Xu., 2012), while the others were in a region of frequent HAB. Station HB08 was affected by dilution from the Changjiang (Yangtze) River, where deposition rate was high, resulting in effective burial of biogenic silica. These factors worked together to produce high biogenic silica concentrations at HD08. Stations with prefixes ZA, ZB, ZC, and ZD were also located in a region of frequent HAB, but the dilution of organic matter from the river was weak; therefore, the biogenic silica content in the sediments was high.
3.1.2 Organic carbon
The organic carbon content in the samples of 2005 ranged from 0.32% to 0.82% with a mean of 0.65%. The distribution was similar to that of biogenic silica. Highest concentrations were found in the southern part of the survey area, with a maximum of 0.82% in Station ZC17 (in the southern part of the region). Low concentrations were in the area outside Hangzhou Bay, with a minimum value of 0.32% Stition RB12. Comparison between biogenic silica and organic carbon shows that they have the similar distribution and the relationship between them may imply that algae, especially diatoms, provide the primary source of both organic carbon and biogenic silica. In samples of 2006, organic carbon content varied widely, from 0.043% to 0.78% with a mean of 0.33%. Low organic carbon content was found outside Hangzhou Bay. Again, maximuun occurred in ZC17, the station of the highest biogenic silica. The minimum value was in ZB12a, near the location of lowest biogenic silica. Similar distribution patterns of the two parameters indicate that the content of organic carbon in the sediment is controlled by biological process. Therefore, we believe that if the concentration of chlorophyll in the seawater is high, more organic carbon will be buried in the sediments.
In general, the organic carbon content in samples was less than 1% lower outside of the Hangzhou Bay and higher in the Changjiang estuary and the areas off Zhejiang Province.
3.1.3 Organic nitrogen
The organic nitrogen content in samples of 2005 ranged from 0.047% to 0.11% on an average of 0.091%, high in the southern part of the survey area and lower in the area beyond the Hangzhou Bay, which is similar to the distributions of organic carbon and biogenic silica. The highest organic nitrogen content (0.112%) was in ZC17 and ZD21 in the southern part of the study area, and the lowest one (0.047%) was in RB12 in the area beyond the Hangzhou Bay. The locations of these extrema are the same as those of biogenic silica and organic carbon.
The content of organic nitrogen in the samples of 2006 ranged from 0.006% to 0.109% on an average of 0.046%. The distribution is similar to those of organic carbon and biogenic silica, high in the southern part and the area near Changjiang estuary and low in the area outside the Hangzhou Bay and the outer southeastern tip of the study region. Stations of the highest and lowest organic nitrogen content were ZC17 and ZB12a, respectively, which is similar to those of organic carbon and biogenic silica.
3.2 The Components in the HB08 Core (2005)
Biogenic silica, organic nitrogen, organic carbon with close relationship (Hou., 2008) and inorganic carbon (carbonate) were analyzed using cored samples collected in spring of 2005 at different depths at station HB08. The vertical distribution of such matter (Fig.3) shows that the content of biogenic silica in the core sample fluctuates vertically around 1.1%, in a range of 1.04% to 1.54% with a mean of 1.25%. In general, the biogenic silica content was low in the surface and bottom sediments and high in the middle part from 18 to 25 cm. The distribution of biogenic silica is similar to that found by Bernárdez. (2005). This pattern of distribution was caused by the decreasing input of silicate in recent years (Wang, 2006). Such decreasing input could affect the growth of diatoms and then the content of biogenic silica in the sediments. Therefore the biogenic silica content increased with depth in the upper layer of the core. The highest concentration of biogenic silica at 1.54% was found in 18 to 25 cm of the core, indicating an HAB occurrence at that time.
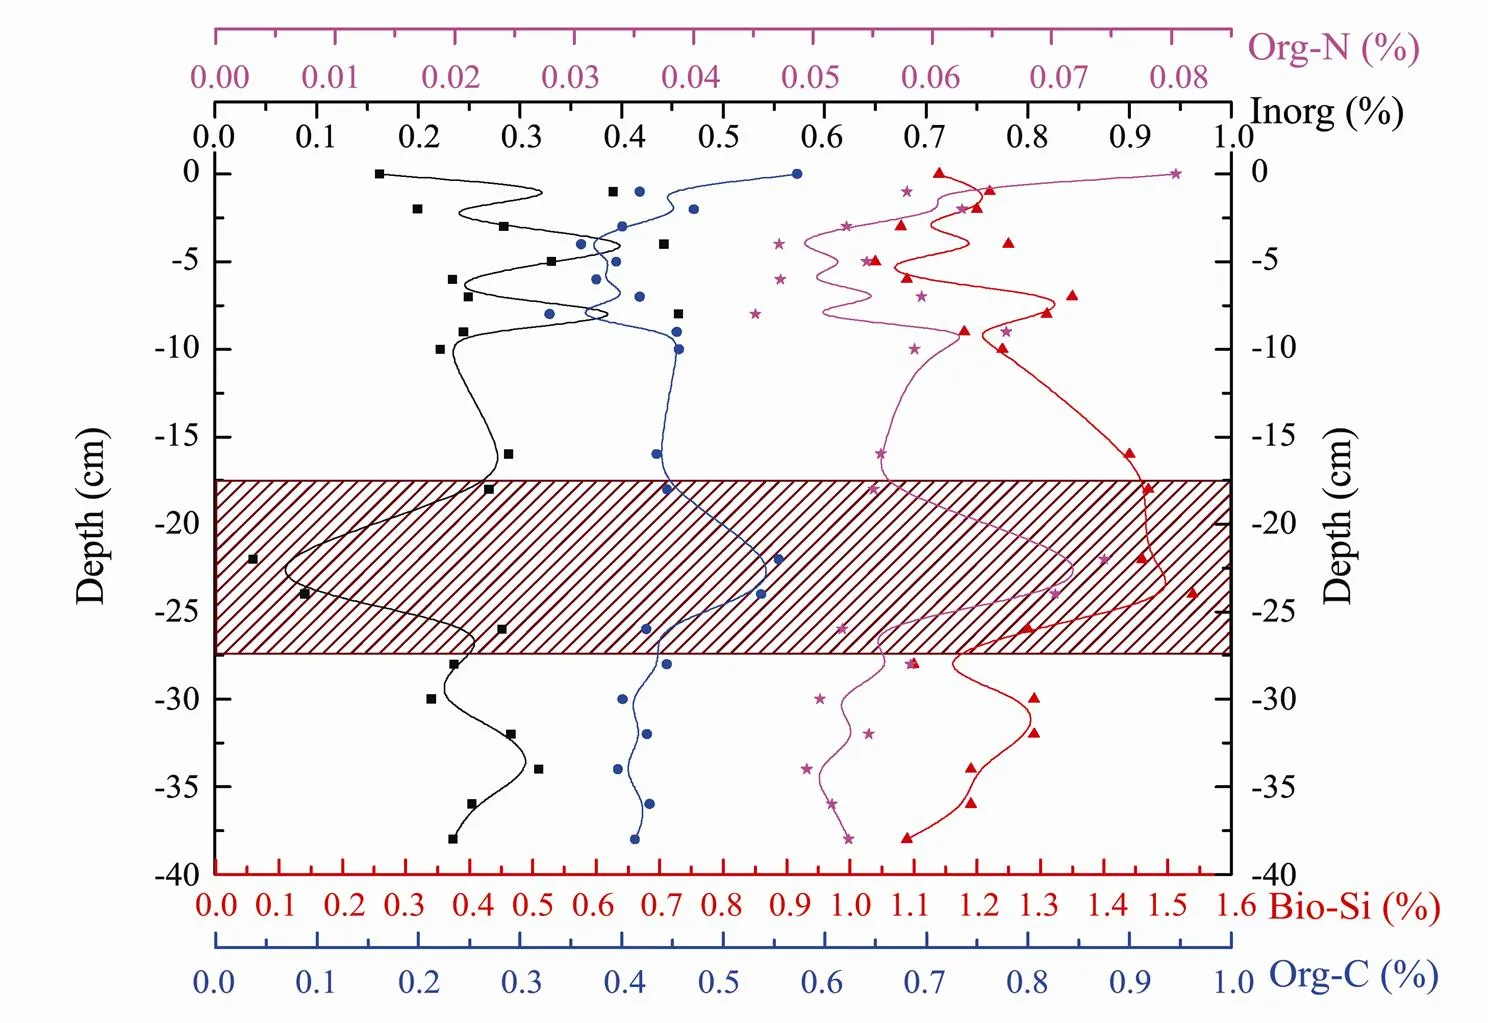
Fig.3 Vertical variations of biogenic silica, organic carbon, organic nitrogen, and carbonate in the HB08 core for spring 2005.
Carbonate content in Core HB08 sediments fluctuated vertically around 0.3%, with values ranging between 0.04% and 0.46% at a mean of 0.26%, the highest value being at a depth of about 8 cm and the lowest at 24 cm. In general, carbonate content in the surface layer of approximately 10cm was relatively high. From here to about 20cm depth, carbonate content decreased overall, and then increased with the depth down to the bottom of the core. In the middle part of the core at 20 to 25cm, occurred the carbonate minimum, which is opposite to the biogenic silica maximum found at that depth.
Organic carbon content in Core HB08 fluctuated around 0.44% and ranged from 0.33% to 0.57% with a mean of 0.43%. In the upper layer of approximately 10 cm, organic carbon content was relatively low. In general, organic carbon content increased first and then decreased with depth. The first peak of organic carbon content was found near the surface (0.57%) and the second peak at a depth of 20 to 25cm (0.55%) corresponding to carbonate content minimum and biogenic silica content maximum. The lowest organic carbon content was found at 5 to 10 cm, where the carbonate content was highest.
Change in organic nitrogen in vertical direction was very similar to that of organic carbon, increasing at beginning and then decreasing. Organic nitrogen in Core HB08 fluctuated in the range of 0.045% to 0.080% with an average of 0.057%. Peak values were found at the surface and at 20 to 25cm depth, and low value at 5 to 10cm, being consistent with the pattern of organic carbon. The low organic matter retention in the sediment may result from the carbonate dilution effect due to terrestrial sources. Those results are close to the result through R-factor analysis (Ozkan., 2014).
In general, changes of biogenic silica, organic carbon and organic nitrogen are consistent overall in trend and, degree of discretization, and in the place of spikes, and all of them were opposite to the variation of carbonate, which was very obvious at 21-23cm, indicating probably a diatomic HAB event. Dead diatoms became a main source of biologic silica and organic matter in the sediments, resulting in the increases in the amount of the above-mentioned matters. However, the content of inorganic carbon was low. Thus, the distribution of organic matter was associated with biological activity in this area.
The ratio of organic carbon to organic nitrogen was used to indicate the source of organic matter. The ratio was between 7 and 10, which indicates that the organic carbon in the sediments was mainly from phytoplankton in the seawater (Meyers, 1994). Organic carbon and organic nitrogen in Core HB08 showed a linear relationship (=0.9504,=22; Fig.4), and the ratio was between 8.01 and 9.65 with an average of 8.90, indicating that the organic matter of the core was mainly from phytoplankton despite of the impact by the Changjiang River. On the other hand, no abnormal change occurred at 23-25cm, which further indicates that the inorganic matter was probably from diatomeae. The total carbon content of the core was relatively stable and slightly varied from 0.52% to 0.73% with an average of 0.62%, showing a decreasing trend with depth (Fig.5).
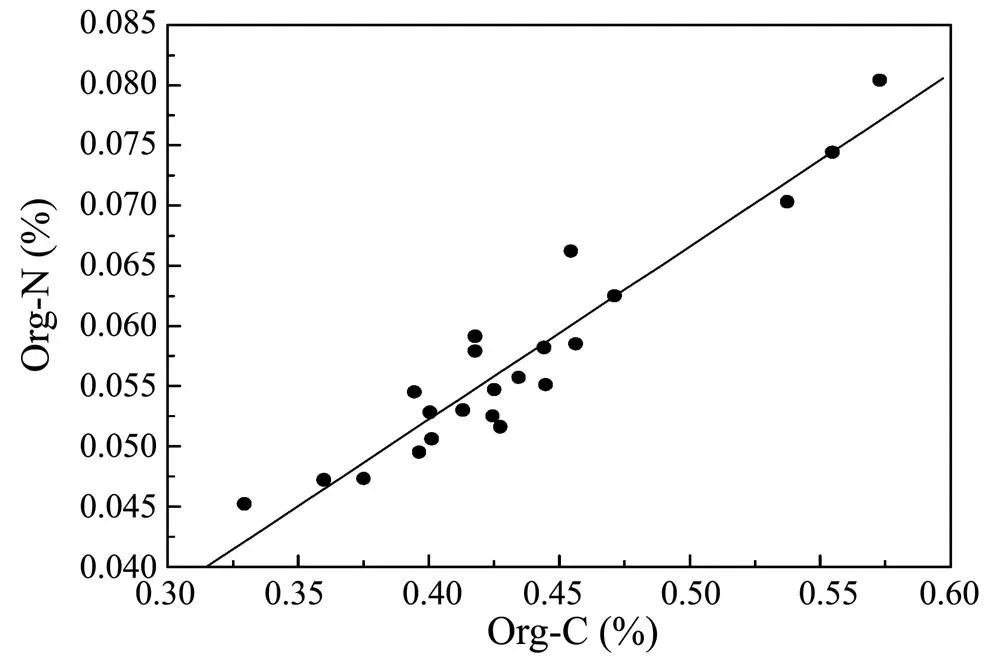
Fig.4 The relationship between organic carbon and organic nitrogen in the HB08 core for spring 2005.
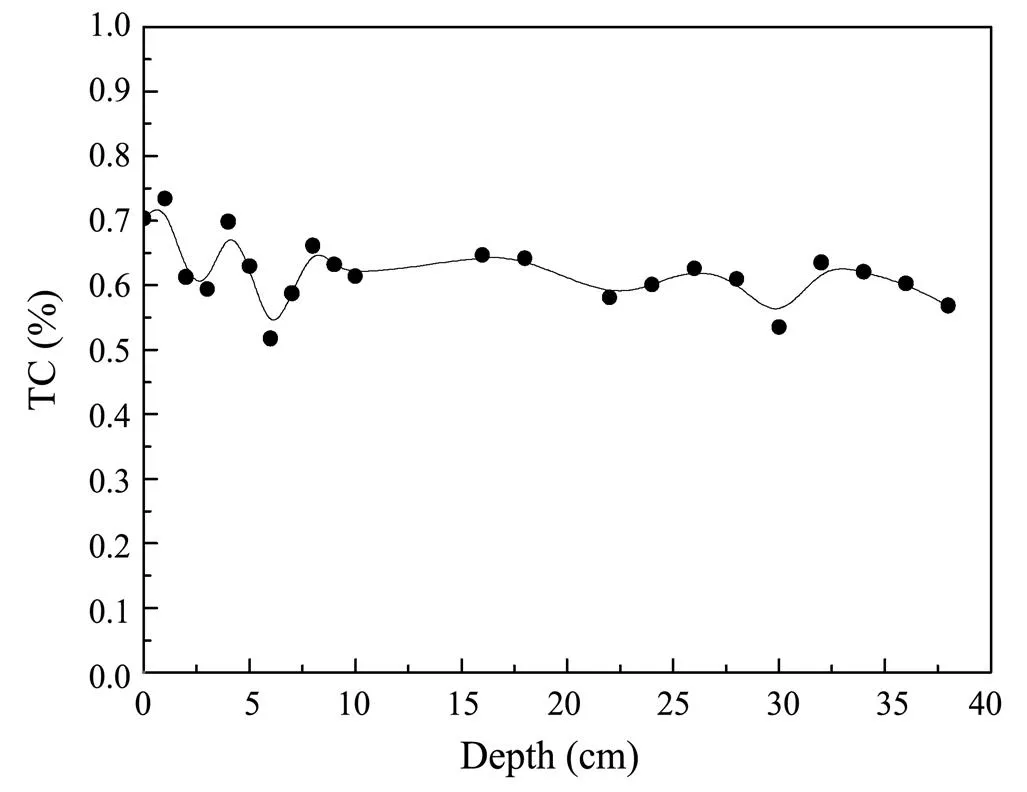
Fig.5 Vertical variation in total carbon in the HB08 core for spring 2005.
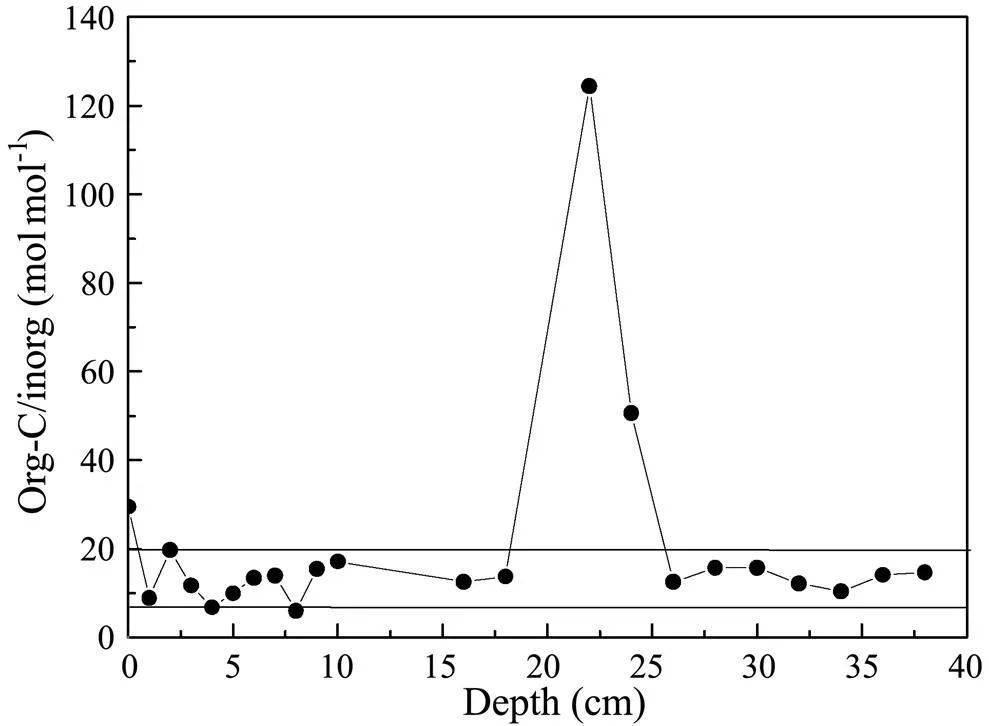
Fig.6 Vertical variation in the ratio of organic carbon to carbonate in the HB08 core for spring 2005.
Another useful indicator was the ratio of organic carbon to carbonate (molmol−1) being used to evaluate the burial efficiency of carbonate, as well as the efficiency of organic carbon during carbon burial. The ratio for Core HB08 was relatively stable except in the 20 to 25cm layer (Fig.6). The ratio of organic carbon to carbonate was 6.02 to 124.4 and often in the range of 10 to 20. All of the ratios are larger than 1.5, indicating that the burial efficiency of carbonate is low (Sayles, 2001). Organic carbon played an important role in the carbon burial in this area. The significant relationship among biogenic silica, organic carbon and organic nitrogen manifests that diatoms are the main source of biogenic silica and carbon at station HB08 and in areas of the East China Sea where HABs are frequent.
4 Conclusions
Biogenic silica contents in surface sediments in the area of frequent harmful algae blooms in the East China Sea ranged from 0.72% to 1.64% in spring 2005 and from 0.77% to 1.51% in spring 2006; for organic carbon contents, they ranged from 0.32% to 0.82% and 0.043% to 0.78%; for the organic nitrogen contents, they were 0.047% to 0.11% and 0.006% to 0.109% respectively. The spatial distributions of these substances were largely overlapped; they concentrated in the southern part of the survey area but were lower in the area outside the Hangzhou Bay. The distributions of them were controlled by the dilution of suspended matter from the river, the quantity of diatoms in the seawater, and the deposition rate.
The vertical variations of biogenic silica, organic carbon, and organic nitrogen were similar to each other. The substances increased first and then decreased with depth with peak values between 20 to 25cm, while from the surface to 10cm, their concentrations were low and scattered; for carbonate, the case is the opposite. The total carbon content in the HB08 core was relatively stable and decreased with depth. The ratio of organic carbon to carbonate (molmol−1) was high, indicating that the burial efficiency of carbonate was low. The organic carbon to organic nitrogen ratio was low and between 8.01 and 9.65, showing that the organic matter was derived mainly from phytoplankton in the seawater. Diatoms were the main producer of biogenic silica and organic matter as well.
Acknowledgments
This work is supported by the National Key Basic Research Program (973) (Grant No. 2010CB428701).
Amanda, M. V., Robinson, W. F., Zoe, J. H., and Joanna, C. C., 2011. The ebb and flood of Silica: Quantifying dissolved and biogenic silica fluxes from a temperate salt marsh.,95: 415-423.
Anderson, R. F., Kumar, N., Mortlock, R. A., Froelich, P. N., Kubik, P., Dittrich-Hannen, B., and Suter, M., 1998. Late- Quaternary changes in productivity of the Southern Ocean., 17 (1): 497-514.
Bernárdez, P., Prego, R., Frances, G.,and González-Álvarez, R., 2005. Opal content in the Ria de Vigo and Galician continental shelf: Biogenic silica in the muddy fraction as an accurate paleoproductivity proxy.,25 (10): 1249-1264.
Blair, N. E., and Aller, R. C., 2012. The fate of terrestrial organic carbon in the marine environment., (4): 401-423.
Boyd, P. W., and Newton, P. P., 1999. Does planktonic community structure determine downward particulate organic carbon flux in different oceanic provinces?, 46 (1): 63-91.
Buesseller, K. O., 1998. The decoupling of production and particulate export in the surface ocean., 12 (2): 297-310.
Calvert, S. E., and Pedersen, T. F., 1993. Geochemistry of recent oxic and anoxic marine sediments: Implications for the geological record., 113 (1-2): 67-68.
Cawthern, T., Johoson, J. E., Giosan, L., Flores, J. A., Rose, K., and Solomon, E., 2014. A late Miocene-Early Pliocene biogenic silica crash in the Andaman Sea and Bay of Bengal., 58: 1-12.
Chen, T., Hammond, D. E., Berelson, W. M., Hering, J. G., and Dixit, S., 2009. Dissolution kinetics of biogenic silica collected from the water column and sediments of three Southern California borderland basins., 113: 41- 49.
Chester, R., 1990.. Unwin Hyman Ltd, London, 1-55.
Cushing, D. H., 1989. A difference in structure between ecosystems in strongly stratified waters and in those that are only weakly stratified.,11 (1): 1-13.
DeMaster, D. J., 1981. The supply and accumulation of silica in the marine environment., 45 (10): 1715-1732.
DeMaster, D. J., 2002. The accumulation and cycling of biogenic silica in the South Ocean: Revisiting the marine silica budget.,49 (16): 3155-3167.
Duan, L. Y., Wang, Z. H., Li, M. T., Pan, J. M., and Chen, Z. Y., 2005.210Pb distribution of Changjing Estuarine sediment and the implications to sedimentary environment., 23 (3): 514-522 (in Chinese with English abstract).
Ozkan, E. Y., Buyukisik, H. B., and Kontas, A., 2014. Biogeochemical behavior and distribution of biogenic silica in marine sediments from Izmir Bay, Aegean Sea (Turkey)., 164: 1-8.
Goldman, J. G., 1988. Spatial and temporal discontinuities of biological processes in pelagic surface water. In:. Rothschild, B. J., ed., Kluwer, Dordrecht, 273-296.
Hanson, R. B., Ducklow, H. W., and Field, J. G., 2000. The changing ocean carbon cycle: A midterm of the JGOFS. Cambridge University Press, London, 15-36.
Hou, L. J., Liu, M., Xu, S. Y., Yan, H. M., Ou, D. N., Cheng, S. B., and Lin, X., 2008, Distriubion and accumulation of biogenic silica in the intertidal sediments of Yangtze Estuary.,20: 543-550.
Hou, L. J., Liu, M., Yang, L., Qu, D. N., Lin, X., and Chen, H., 2010. Biogenic silica in intertidal marsh plants and associated sediments of the Yangtze Estuary.,22: 374-380.
Kamatani, A., and Oku, O., 2000. Measuring biogenic silica in the marine sediments., 68 (3): 219-229.
Krause, J. W., Brzezinski, M., Villareal, T. A., and Wilson, C., 2013. Biogenic silica cycling during summer phytoplankton blooms in the North Pacic subtropical gyre.,71: 49-60.
Krause, J. W., Nelson, D. M., and Lomas, M. W., 2009. Biogeochemical responses to late-winter storms in the Sargasso Sea, II: Increased rates of biogenic silica production and export.,56:861-874.
Hu, L. M., Shi, X. F., Guo, Z. G., Wang, H. J., and Zhang, Z. S., 2013. Sources, dispersal and preservation of sedimentary organic matter in the Yellow Sea: The importance of depositional hydrodynamic forcing.,335: 52-63.
Li, X., Bianchi, T. S., Allison, M. A., Chapman, P., Mitra, S., Zhang, Z., Yang, G. P., and Yu, Z. G., 2012. Compositon, adundance and age of total organic carbon in the surface sediment from the inner shelf of the East China Sea., 145-147: 37-52.
Li, D., Yao, P., Bianchi, T. S., Zhang, T. T., Zhao, B., Pan, H. H., Wang, J. P., and Yu, Z. G., 2014. Organic carbon cycling in the sediments of the Changjing Esturary and adjacent shelf: Implication for the influence of Three Gorges Dam., 139: 409-419.
Liu, S. M., Ye, X. W., Zhang, J., and Zhao, Y. F., 2002. Problems with biogenic silica measurement in the marginal seas., 192 (4): 383-392.
Lyle, M., Murray, D. W., Finney, B. P., Dymond, J., Robbins, J. M., and Brooksforce, K., 1988. The record of late Pleistocene biogenic sedimentation in eastern tropical Pacific Ocean., 3 (1): 39-59.
Masqué, P., Fabres, J., Calafat, A. M., Canals, M., Sanchez- Cabeza, J. A., Sanchez-Vidal, A., Cacho, I., and Bruach, J. M., 2003. Accumulation rates of major constituents of hemi-pelagic sediments in the deep Alboran Sea: A centennial perspective of sedimentary dynamics., 193: 203-233.
Meyers, P. A., 1994. Preservation of elemental and isotopic source identification of sedimentary orangic matter., 114 (3-4): 289-302.
Mortlock, R. A., and Froelich, P. N., 1989. A simple method for the rapid determination of biogenic opal in pelagic marine sediments., 36 (9): 1415-1426.
Mortlock, R. A., Charles, C. D., Froelich, P. N.,Zibello, M. A.,Saltzman, J.,Hays, J. D., and Burckle, L. A., 1991. Evidence for lower productivity in the Antarctic Ocean during the last glaciations., 351: 220-223.
Nelson, D. M., Tréguer, P., Brzezinski, M. A., Leynaert, A., and Quéguiner, B., 1995. Production and dissolution of biogenic silica in the ocean: Revised global estimates, comparison with regional data and relationship to biogenic sedimention.,9 (3): 359-372.
Ragueneau, O., Gallinari, M., and Corrin, L., 2001. The benthic silica cycle in the Northeast Atlantic: Annual mass balance, seasonality and importance of non-steady-state progresss for the early diagenesis of biogenic opal in deep-sea sediments., 50 (1-4): 171-200.
Ragueneau, Q., Savoye, N., Del, Amo, Y., Cotton, J.,Tardiveau, B., and Leynaert, A., 2005. A new method for the measurement of biogenic silica in suspended matter of coastal water: Using Si:Al ratio to correct for the mineral interference., 25 (5-6): 697-710.
Ryther, J. H., 1969. Photosynthesis and fish production in the sea., 166: 72-76.
Sayles, F. L., Martin, W. R., Chase, Z., and Anderson, R. F., 2001. Benthic remineralization and burial of biogenic SiO2CaCO3, organic carbon and detrital material in the Southern Ocean alonga transect at 170˚W., 48 (19): 4323-4383.
Shibamoto, Y., and Harada, K., 2010. Silicon flux and distribution of biogenic silica in deep-sea sediments in the Western North Pacic Ocean, 57:163-174.
Tréguer, P., Nelson, D. M., Van Bennekom, A. J., DeMaster, D. J., Leynaert, A., and Quéguiner, B., 1995. The silica balance in the world ocean: A reestimate., 268: 375-379.
Wang, B. D., 2006. Cultural eutrophication in the Changjiang (Yangtze River) plume: History and perspective.,, 69 (3-4): 471-477.
Wang, L., Fan, D. J., Li, W. R., Liao, Y. J., Zhang, X .L., Liu, M., and Yang, Z. S., 2014. Grain-size effect of biogenic silica in the surface sediments of the East China Sea.,81: 29-37.
Xing, L., Zhang, H., Yuan, Z., Sun, Y., and Zhao, M., 2011. Terrestrial and marine biomarker estimates of organic matter sources and distributions in surface sediments from the East China Sea shelf.,31: 1106-1115.
Xu, K. H., Li, A. C., Liu, J. P., Ji, D. M., Yang, Z. S., Liu, C., Kao, S., Wan, S., and Xu, F., 2012. Provenance, structure, and formation of the mud wedge along inner continental shelf of the East China Sea: A synthesis of the Yangtze dispersal system., 294: 176-191.
(Edited by Ji Dechun)
10.1007/s11802-015-2522-3
(October 21, 2014; revised February 1, 2015; accepted February 7, 2015)
. Te: 0086-532-66782143E-mail:shixy@ouc.edu.cn
ISSN 1672-5182, 2015 14 (3): 464-470
© Ocean University of China, Science Press and Springer-Verlag Berlin Heidelberg 2015
 Journal of Ocean University of China2015年3期
- Journal of Ocean University of China的其它文章
- Monte Carlo Simulation of in situ Gamma-Spectra Recorded by NaI (Tl) Detector in the Marine Environment
- Effects of Waterborne Cu and Cd on Anti-oxidative Response,Lipid Peroxidation and Heavy Metals Accumulation in Abalone Haliotis discus hannai Ino
- A General Overview of the Typical18Frontal-Ventral-Transverse Cirri Oxytrichidae s. l. Genera (Ciliophora, Hypotrichia)
- Application of a Delay-Difference Model for the Stock Assessment of Southern Atlantic Albacore (Thunnus alalunga)
- Invasion and Morphological Variation of the Non- Indigenous Barnacle Chthamalus challengeri (Hoek, 1883) in Yangshan Port and its Surrounding Areas
- Hydrochemistry of the Natural Low pH Groundwater in the Coastal Aquifers near Beihai, China
