
Temporal and Spatial Distribution Characteristics of Potential Evapotranspiration and Its Sensitivity to Meteorological Factors in Guizhou Province
2015-02-25 01:18:12FeiYUXiaopingGUHuaXIONG
Agricultural Science & Technology 2015年12期
Fei YU,Xiaoping GU,Hua XIONG
1.Guizhou Institute of Mountainous Climate and Environment,Guiyang 550002,China;2.Guizhou Key Laboratory of Mountain Climate and Resources,Guiyang 550002,China;3.Guizhou Forest Inventory and Planning Institute,Guiyang 550003,China
Potential evapotranspiration,a measure of atmospheric evaporation capacity, indicates there is a capacity to control the evaporation process of humid underlying surface in the atmosphere,and it is an important indicator for assessment of drought-wet degree of climate,reservoir design,water consumption of crops,and calculation of crop productivity potential,as well as the fundamental basis for establishment of irrigation system and a plan of the irrigation requirement for water[1-3],playing a significant role in global water cycle and climate evolution. Guizhou Province,the center of southwestern China’s karst areas,is rich in precipitation,but drought occurred at different levels every year.On the one hand,water is lost through potential evapotranspiration besides surface leakage,so studying the temporal and spatial variation of potential evapotranspiration in Guizhou Province is worthy of attention.On the other hand,under the background of global warming,potential evapotranspiration all over the world has tended to reduce in recent 50 years,which is called“evaporation paradox”and hasattracted broad attention in the world[4-5].Changes in potential evapotranspiration are mainly affected by meteorological factors such as temperature,wind speed,sunshine hours,relative hu-midity,saturated vapor pressure deficit and cloud cover,and these factors influence each other,so the reasons for changes in potential evapotranspiration are very complex[6-7].Here based on daily meteorological data at each meteorological station in Guizhou Province from 1961 to 2010,the changes of potential evapotranspiration and its sensitivity to meteorological factors in Guizhou Province were discussed,so as to provide important references for assessment of water resources,research of agricultural water conservancy and climate change.
Data and Methods
Daily meteorological data at each meteorological station in Guizhou Province from 1961 to 2010 are from Guizhou Meteorological Bureau.Based on the daily meteorological data,daily potential evapotranspiration in Guizhou Province was calculated using Penman-Monteith formula recommended by the Food and Agriculture Organization(FAO).The formula is shown as follows:
where PE is potential evapotranspiration,mm/d;Rnis surface net radiation,MJ/(m·d);G is soil heat flux,MJ/(m2·d);Tmeanis daily mean temperature,℃;μ2is wind speed at a height of 2 m,m/s;esis saturation vapor pressure,kPa;eais actual vapor pressure,kPa;△is the slope of a saturation vapor pressure curve,kPa/℃;γ is psychrometer constant,kPa/℃.Each component was calculated according to related studies[8].
Results and Analysis
Temporal and spatial distribution characteristics of potential evapotranspiration
As shown in Fig.1,on the whole,multi-year average potential evapotranspiration in Guizhou Province was higher in the southwest and the west compared with the northeast and the east.Multiyear average potential evapotranspiration in Guizhou Province ranged mostly from 850.0 to 950.0 mm,and it was higher than 1 000.0 m in the southwest marginal areas.It was higher than 900.0 mm in the west and most areas in the south.It varied from 804.1 to 900.0 mm in the middle and most areas in the north-central part and lower than 850.0 mm in the north.
According to Table 1,among the representative stations in Guizhou Province,the maximum ofannual average potential evapotranspiration(1 067.32 mm)appeared in Xingyi City,followed by Guiyang(942.30 mm)and Kaili City(931.71 mm);the annual average potential evapotranspiration was the lowest in Bijie (846.71 mm),Zunyi(857.30 mm)and Tongren City(877.43 mm).
As shown in Fig.2,in most areas of Guizhou Province,potential evapotranspiration was the highest in July but the lowest in January.In various seasons,it was the highest in summer,followed by spring and autumn,while it was the lowest in winter.

Table 1 The maximum,minimum and average of annual potential evapotranspiration in the representative stations in Guizhou Province mm
Changing tend of potential evapotranspiration
In recent 40 years,annual potential evapotranspiration showed an obvious decreasing trend in most stations of Guizhou Province,but the decreasing trend was not obvious in Tongren and Zunyi City(Fig.3).Generally speaking,with the increase of temperature,evaporation and evapotranspiration become stronger on the surface of the ground(including vegetation)and water,but evapotranspiration in the Northern Hemisphere tended to reduce in recent 50 years[9],which is called “evaporation paradox”.“Evaporation paradox”also appeared in Guzhou Province.
Analysis of sensitivity of potential evapotranspiration to meteorological factors
The correlation between potentialevapotranspiration and meteorological factors(daily average temperature,daily maximum temperature,daily minimum temperature,sunshine duration,daily average wind speed,and daily average relative humidity)in representative stations in Guizhou Province was analyzed.The results show that the main meteorological factors influencing changes of potential evapotranspiration in Guizhou Province were sunshine duration,daily maximum temperature,and daily average relative humidity(Table 2).
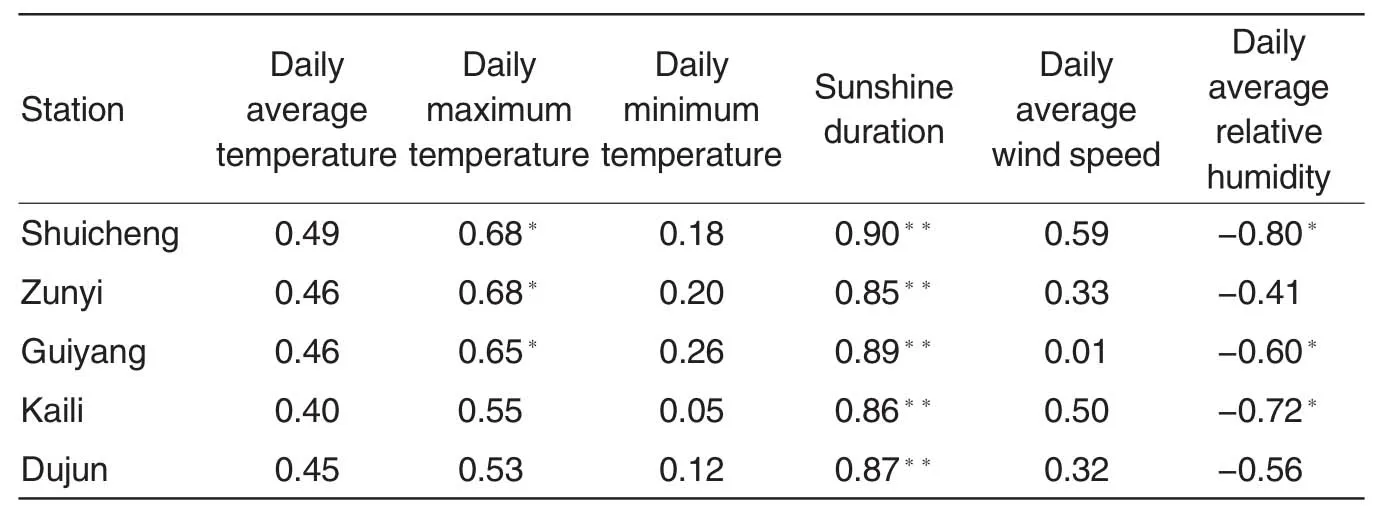
Table 2 Correlation coefficients between potential evapotranspiration and meteorological factors various representative stations in Guizhou Province
Conclusions and Discussion
On the whole,potential evapotranspiration in Guizhou Province was higher in the southwest and the west compared with the northeast and the east.Multi-year average potential evapotranspiration in Guizhou Province ranged mostly from 850.0 to 950.0 mm,and it was higher than 1 000.0 m in the southwest marginal areas and lower than 850.0 mm in the north.In recent 40 years,annual potential evapotranspiration showed an obvious decreasing trend in most stations of Guizhou Province,but the decreasing trend was not obvious in Tongren and Zunyi City.In most areas of Guizhou Province,potential evapotranspiration was the highest in July but the lowest in January.
Correlation analysis shows that the main meteorological factors influencing changes of potential evapotranspiration in Guizhou Province were sunshine duration,daily maximum temperature,and daily average relative humidity.The decrease in potentialevapotranspiration in Guizhou Province was closely related to significant drop of sunshine duration.With the increase of daily average temperature,potential evapotranspiration in Guizhou Province did not increase,revealing that daily average temperature was not the main meteorological factor affecting changes of potential evapotranspiration in Guizhou Province.
[1]GAO G(高歌),CHEN DL(陈德亮),REN GY(任国玉),et al.Trend of potential evapotranspiration overChina from 1956 to 2000(1956~2000年中国潜在蒸散量变化趋势)[J].Geographical Research(地理研究),2006,25(3):378-387.
[2]XIE XQ(谢贤群),WANG L(王菱).Changes of potential evaporation in Northern China over the past 50 years(中国北方近50年潜在蒸发的变化)[J].Journal of Natural Resources(自然资源学报),2007,22(5):683-691.
[3]SUN XZ(孙小舟),FENG ZM(封志明),YANG YZ(杨艳昭).Change tendency of reference crop evapotranspiration in Xiliaohe basin(西辽河流域1952-2007年参考作物蒸散量的变化趋势)[J].Resources Science(资源科学),2009,31(3):479-484.
[4]WANG YJ(王艳君),JIANG T(姜彤),XU CY(许崇育),et al.Spatial-temporal change of 20 cm pan evaporation over the Yangtze River basin (长江流域20cm蒸发皿蒸发量的时空变化)[J].Advances in Water Science(水科学进展),2006,17(6):830-833.
[5]DU J(杜军),HU J(胡军),LIU YL(刘依兰),et al.Changes of pan evaporation and its impact factors in middle reaches of the Yarlung Zangbu River over Tibet in recent 25 years(近25年雅鲁藏布江中游蒸发皿蒸发量及其影响因素的变化)[J].Journal of Natural Resources(自然资源学报),2008,23(1):120-126.
[6]ZHANG MJ(张明军),LI RX(李瑞雪),JIA WX(贾文雄),et al.Temporal and spatial changes of potential evaporation in Tianshan Mountains from 1960 to 2006(中国天山山区潜在蒸发量的时空变化)[J].Acta Geographica Sinica(地理学报),2009,64(7):798-806.
[7]YIN YH(尹云鹤),WU SH(吴绍洪),DAI EF(戴尔阜).Reasons for temporal and spatial changes of potential evaporation in China during 1971-2008(1971~2008年我国潜在蒸散时空演变的归因)[J].Chinese Science Bulletin(科学通报),2010,55(2):2226-2234.
[8]LIU SM(刘绍民),SUN ZP(孙中平),LI XW(李小文),et al.A comparative study on models for estimating evapotranspiration(蒸散量测定与估算方法的对比研究)[J].Journal of Natural Resources(自然资源学报),2003,18(2):161-167.
[9]LIU Y(刘圆),WANG Y(王颖),YANG XG(杨晓光).Trends in reference crop evapotranspiration and possible climatic factors in the North China Plain(华北平原参考作物蒸散量变化特征及气候影响因素)[J].Acta Ecologica Sinica(生态学报),2010,30(4):923-932.
猜你喜欢
水利科学与寒区工程(2024年2期)2024-03-28 03:07:32
Chinese Physics B(2022年7期)2022-08-01 05:59:32
黑龙江水利科技(2021年8期)2021-09-03 12:17:56
水利技术监督(2020年4期)2020-07-16 03:12:36
初中生世界·七年级(2019年8期)2019-08-29 03:16:09
Communications in Theoretical Physics(2018年8期)2018-08-02 07:35:26
东方教育(2018年3期)2018-03-30 09:19:36
现代农业科技(2017年10期)2017-07-12 15:01:24
现代农业科技(2017年6期)2017-05-12 14:52:51
水利科技与经济(2017年4期)2017-04-22 02:38:14
 Agricultural Science & Technology2015年12期
- Agricultural Science & Technology的其它文章
- Study on Engineering Characteristics and Application of Sticky Rice
- Periodical Development Trend of Vertical Greening
- Advances in Microbial Remediation on the Application of Heavy Metal Pollution in Agricultural Water Resources
- Analysis on Status quo and Future Development of Fruit and Vegetable Protreatment
- Effect of Three Treatment Measures on Harmless Seedling Raising of Pinus sylvestris var. mongolica Litv.
- Discussions and Recommendations for Supervision of Vegetable Quality and Safety in Miyun County