
Reconstruction of Smoke Plume Concentration Peaks Based on Modified MAX-DOAS Tomography
2015-01-20 02:33:14MinhongWeiMinmingTongSuwenLi
Min-hong Wei,Min-ming Tong,Su-wen Li
a.School of Physics and Electronic Information,Huaibei Normal University,Huaibei 235000,Chinab.Schoolof Information and ElectricalEngineering,China University of Mining and Technology,Xuzhou 221116,China
(Dated:Received on April 10,2015;Accepted on July 29,2015)
Reconstruction of Smoke Plume Concentration Peaks Based on Modified MAX-DOAS Tomography
Min-hong Weia,b,Min-ming Tongb,Su-wen Lia∗
a.School of Physics and Electronic Information,Huaibei Normal University,Huaibei 235000,China
b.Schoolof Information and ElectricalEngineering,China University of Mining and Technology,Xuzhou 221116,China
(Dated:Received on April 10,2015;Accepted on July 29,2015)
Optical tomography system based on modified simultaneous iterative reconstruction technique is designed to real-time monitor spatial distribution and diffusion process of smoke plume in a power plant.Concentration profiles,rather than just a point value,of smoke plume concentrations are the goal of this method,and the tomography algorithm is analyzed.According to incomplete pro jection data in the process of reconstruction and exiting noise interference,the modified simultaneous iterative reconstruction technique(SIRT)is adopted to extract the information of the trace gas concentration by a fan beam scanning and is compared to the conventional SIRT.Three evaluation indexes show that the reconstruction effect is the best by choosing proper relaxation factor,which reduces the index d to 0.044 from 0.435 and reduces the index r to 0.044 from 0.376 for 5500 iterations.Hence, the modified algorithm performs better in estimating the shape of the plume,this method is used to process the measured spectra in field campaign,the reconstruction results and the measured data are basically consistent,which is further confirmed by the experimental results.
Reconstruction,DOAS tomography,Retrieval,Modified simultaneous iterative reconstruction technique
I.INTRODUCTION
Air pollution is a very complex dynamic phenomenon. Single-point measurements are often not sufficient to offer concentration profiles of smoke plume.In contrast, spatially resolved measurements can provide this type of information.Many detection methods have been dedicated to the remote sensing of indoor gas concentrations and their dispersions,such as tunable diode laser absorption spectroscopy(TDLAS)method,fourier transform infrared spectroscopy(FTIR)method and long path differential optical absorption spectroscopy (LP-DOAS)method[1–4].However,these methods can usually be applied to retrieve one-dimensional profiles or to retrieve horizontal profiles.In order to retrieve two-dimensional profiles at a vertical resolution, a multi-axis differential opticalabsorption spectroscopy (MAX-DOAS)tomography system is put forward and designed in this work,which combines the MAX-DOAS with computed algorithm.
As scattered sunlight in the UV-region is being used as light source,the MAX-DOAS is relatively simplified. In addition,it is a kind of accurate,rapid,wide range of measurement,in situ monitoring technology,especially suitable for the monitoring pollution emissions from oil refineries or thermoelectric power stations[5–7].The MAX-DOAS tomography is a novel detection technology,tomography images can be used to assess the impact of the gaseous pollutant on the surrounding region and provide knowledge of the concentration distribution inside the smoke plume.The MAX-DOAS technique is used to retrieve gas column concentration, reconstruction algorithm is applied to extract information of trace gas profiles from gas column concentration at a vertical resolution[8].
Todd and Ramachandran found that algebraic reconstruction technique(ART)performed best,if measurement errors were negligible,whereas simultaneous iterative reconstruction technique(SIRT)was preferred for noisy data[9].However,the slow speed affects application of the conventional SIRT during on-line process tomography,the modified SIRT is developed to reconstruct the distributions of concentration under incomplete projections for fast computation and high quality in the work.
II.MAX-DOAS TOMOGRAPHY SYSTEM
A.MAX-DOAS system
MAX-DOAS system is integrated with optics,mechanics and electrics,and gas concentration can be measured continuously and automatically.MAX-DOAS setup includes the transmitting and receiving telescopes,spectrometer unit(Ocean Optics S2000)with a spectral resolution of 0.6 nm,fiber,CCD detector,A/D converter,and computer.The scattered sunlight is led into the horizontally aligned telescope pointing to the zenith by reflection in a mirror,tilted 45◦to the optical axis of the telescope.The mirror can be made to rotate around the optical axis of the telescope by means of a stepper motor.The instrument can thereby measure in any direction perpendicular to the optical axis of the telescope.Scattered sunlight is collected and focused by the telescope and is led into the spectrometer unit through 3 m optical fiber,which were processed with DOASIS and WinDOAS software[10–13].
Based on Lambert-Beer’s law,inversion process ofgas concentration can be expressed by Eq.(1)−(4).
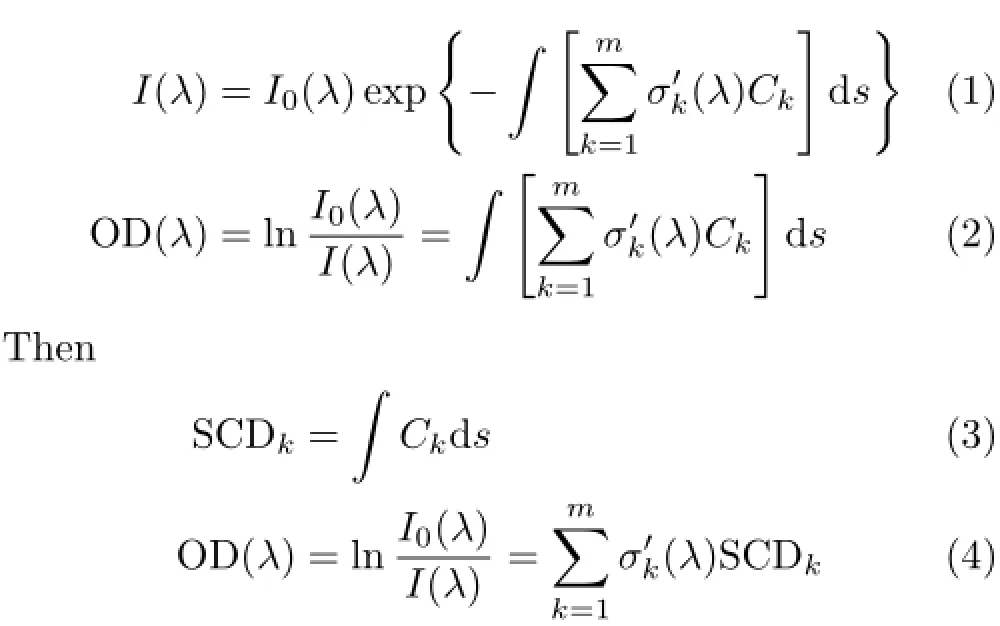
where I(λ)and IO(λ)are,respectively,reflected light and emitted light intensity,represents the fast variations of the spectrum,the fast variations are determined by the absorption of molecules.The slow variations are determined by the light source and by the scattering,such as Rayleigh scattering and Mie scattering etc.,which can be removed by fitting of a polynomial or by using high-pass digital filters.As a result, the fast variations could be obtained.Ckis specific concentration of gas k.OD(λ)is difference absorption optical density of the medium in the wavelengthλ.SCDkis inclined column concentration of gas k,that is lineintegrated concentrations(columns)of trace gas along the light path.General speaking,they can be derived by least square method,example for NO2fitting can be shown in Fig.1.
B.The reconstruction algorithm
A region which encloses the whole plume is divided into pixels N=n×n,where each pixel represents different concentration value,the measurements can be formulated as a matrix equation.

FIG.1 Example for NO2fitting.
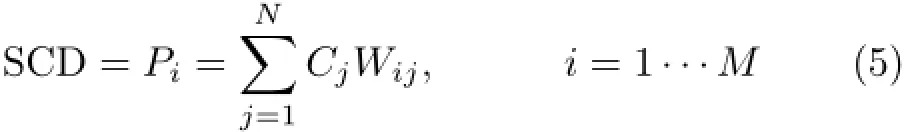
Piis a column vector with the measured integrated concentration of light path i,Cjis a column vector with the concentration of pixel j,Wijis a matrix describing the weights on the pixel j in each measurement,and weight equal to the light path length in the given pixel.
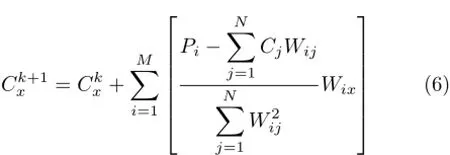
Initial the concentration of each pixel is initialized to zero,then the concentration of each pixel is revised in each iteration by Eq.(6)in conventional SIRT,where k is the iterative number,Cxis the concentration of pixel x.
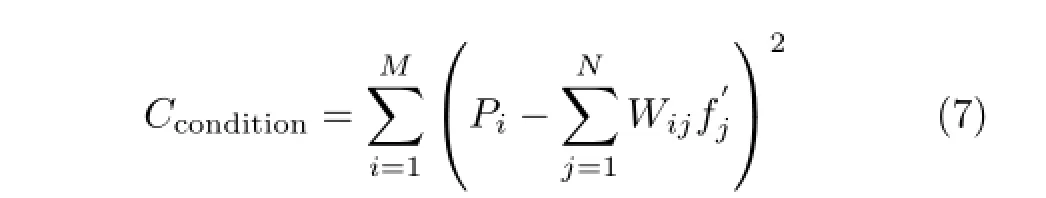
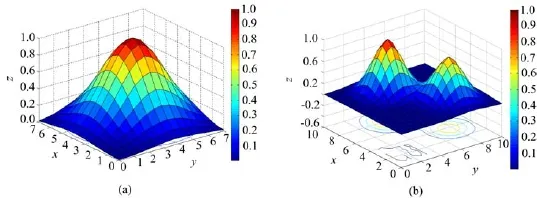
FIG.2 The models of(a)single peak and(b)twin peaks Gaussian plume.
Condition of convergence is expressed by Eq.(7),iteration terminates when Cconditionis less than a certain minimumτ.It is well known that theoretically gas concentration cannot be negative,so we set allnegative concentrations to zero as the last step of the inversion in our implementation.SIRT can be used to reconstruct images from inaccurate projection,however,the slow speed affects its application during on-line process tomography.Unlike the conventional SIRT algorithm, an apposite relaxation function in the modified SIRT algorithm can be chosen to change the iterative scale and accelerate convergence of the SIRT during the reconstruction procedure,and the relaxation factor varied with the change of iterative number[14],iterative equations as follows:
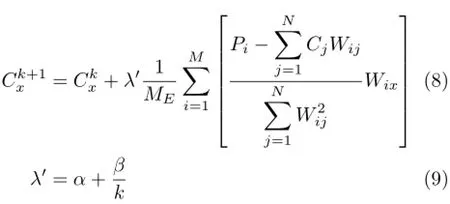
whereλ′represents relaxation function,generally 0<λ′<10,α,βrespectively represent relaxation factor,MErepresents the total number of rays which go through pixel x.
III.RESULTS AND DISCUSSION
A.The reconstruction model
Single and twin Gaussian peaks function are adopted to study concentration distribution reconstruction of smoke plume,which can be expressed by Eq.(10)and Eq.(11),which are shown in Fig.2.Many atmospheric pollutant(e.g.SO2,NO2,O3)can be retrieved by MAX-DOAS simultaneously,NO2was looked upon as reconstruction research object in reconstruction model.

where(xO,yO)represents coordinates of the single peak (the location of the pollution source).A represents peak concentration(maximum concentration).σ2represents width of the plume.
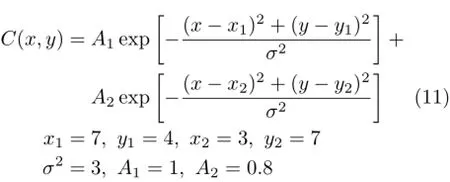
where(x1,y1)and(x2,y2)respectively represents coordinates of the twin peaks(the location of the pollution sources).A1and A2respectively represent peak concentration(maximum concentration).
B.The reconstruction quality
The performance and properties ofthe inversion algorithm have been measured by using d,which represents a small amount of big reconstruction error of concentration distribution,Prerepresents the reconstruction error of peak value,and r represents a large number of smallreconstruction error ofconcentration distribution, PE represents the average relative error of the projection data.They can be expressed by Eqs.(12)−(15) respectively.
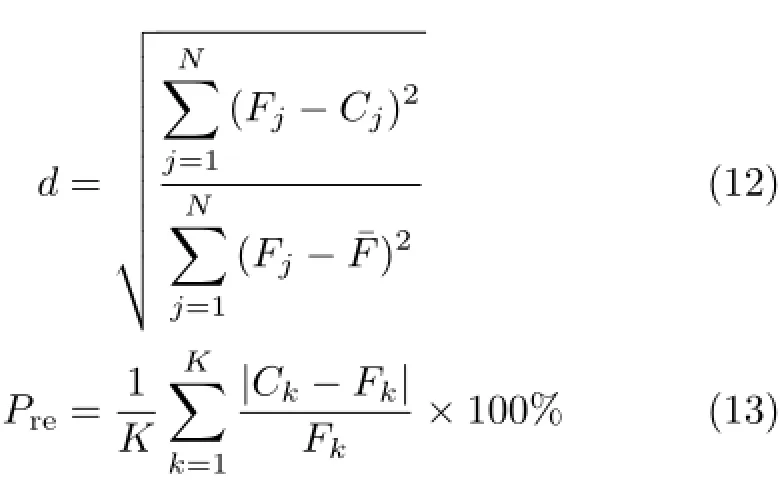
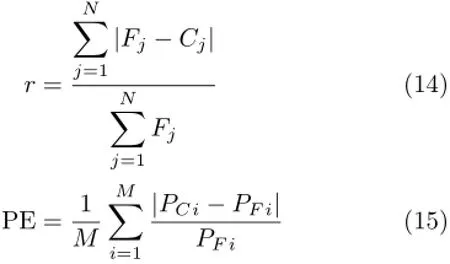
where Cjis the simulated concentration of pixel j in reconstruction image,Fjis the original concentration of pixel j,j=1,...,N.¯F is average concentration of all pixels in true image.Ckand Fkrespectively represent maxium peak concentration of peak k in reconstruction image and in true image.K represents the total of smoke plume peak,PFiand PCirespectively represent the measured integrated concentration of light path i in true image and in reconstruction image.
There are mainly light path geometries of one telescope,two telescopes,three telescopes and four telescopes in DOAS tomography,and every geometry can be divided into optical path emitted in 90◦fan beams and in 180◦fan beams.In order to reduce scanning time,light path emitted in 90◦fan beams is adopted in the work.With the increasing of telescope,the projection data increased in the same time,that is,the measured column density increased.Therefore,construction distribution in reconstruction is closer to reality. The ability of the reconstruction lies in the number of projection,however,the increased measurement cost, time and algorithm difficult limit its application.In short,these factors should be synthetically considered to choose the best scanning optical path in the process of reconstruction.
Figure 3 shows the experimental setup,beam geometry design and the overview of the measuring plane, smoke plume from plant stack is adopted as studied object,scanning angular is between 0◦and 90◦.Installation of MAX-DOAS is relatively easy,and the spatial distribution of trace gases is retrieved by measuring scattered sunlight from different viewpoints.
Geometry with two telescopes and optical path emitted in 90◦fan beams at uniform angular intervals is adopted in reconstruction simulation,and shown in Fig.3(a).The number of pixels used in the model of single peaks Gaussian plume is N=17×17,the totaloptical path is 2×90=180,two MAX-DOAS situated on the ground below the smoke plume is applied to scan, another one is set up on experimental building,With different relaxation factors and different iterative numbers,the reconstruction results of the MSIRT(β=0, λ=α)compared with ART are presented in Table I.
Table I shows the average relative error of the projection data decreases with iterative number increasing, and the average relative error of the projection data becomes smaller and smaller as the relaxation factor increases.We also see the average relative error of the projection data in MSIRT is much less than that of ART,the reconstructed speed of MSIRT is much better than that of CSIRT,especially whenλis greater than 1.
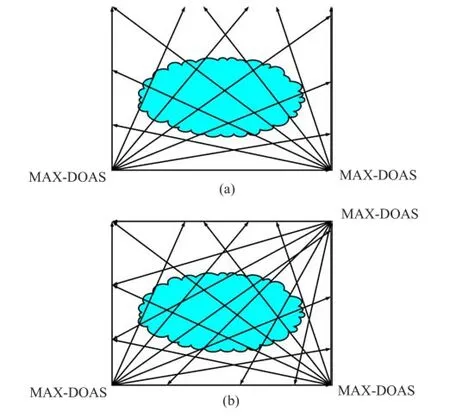
FIG.3 Geometries with(a)two telescopes and(b)three telescopes and light emitted in 90◦fan beams.
Geometry with three telescopes and optical path emitted in 90◦fan beams at uniform angular intervals is adopted in reconstruction simulation,and shown in Fig.3(b).The number of pixels used in the model of twin peaks Gaussian plume is N=11×11,a spectrum was collected every 1◦in the reconstruction simulations, the total optical paths is 3×90=270,Cconditionis less than a certain minimum 0.0001.The modified SIRT algorithm is called for short MSIRT,and conventional SIRT algorithm is called for short CSIRT.With different relaxation factors and different iterative numbers, the reconstruction results of the MSIRT compared with CSIRT are presented in Table II.
Table II shows the reconstruction error of concentration distribution decreases with iterative number increasing,and the reconstruction error of concentration distribution becomes smaller and smaller as the relaxation factor increases.That is,the quality of reconstructed images and operation speed can be improved by increasing the apposite relaxation factor,and as iterative number is less than a certain count,which began causing image distortion along with other imaging issues,especially in reconstruction algorithm of CSIRT. We also see the reconstructed quality of MSIRT is much better than that of CSIRT,the reconstructed speed of MSIRT is about ten times as much as that of CSIRT.
As mentioned above,the number of pro jection can be increased by increasing the number of instrument. While the number of instrument fixed,the number of pro jection can be increased by increasing the direction of scanning.
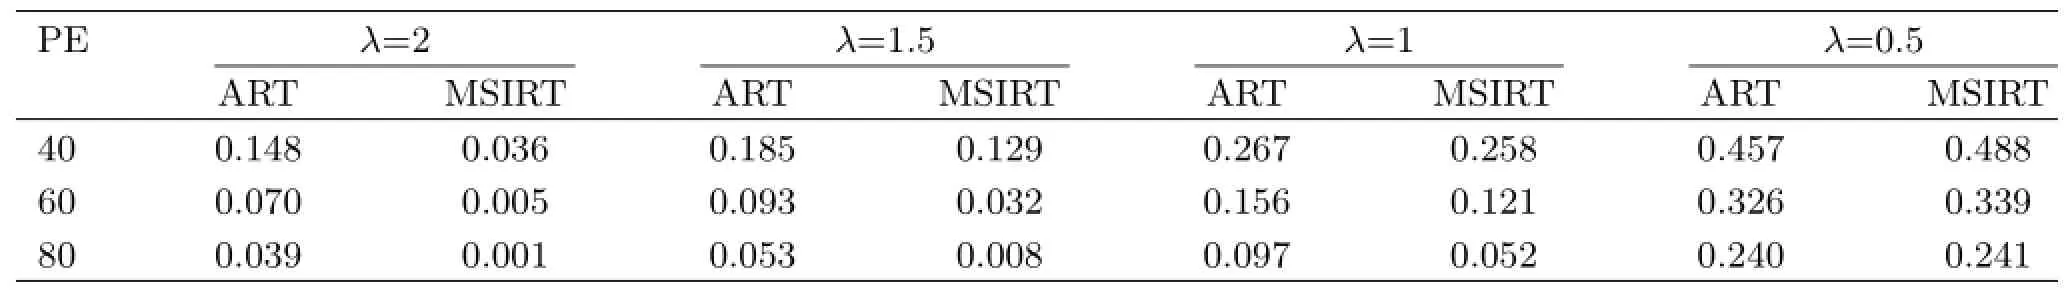
TABLE I Error PE value in comparison with ART algorithm and MSIRT algorithm in different iterations.
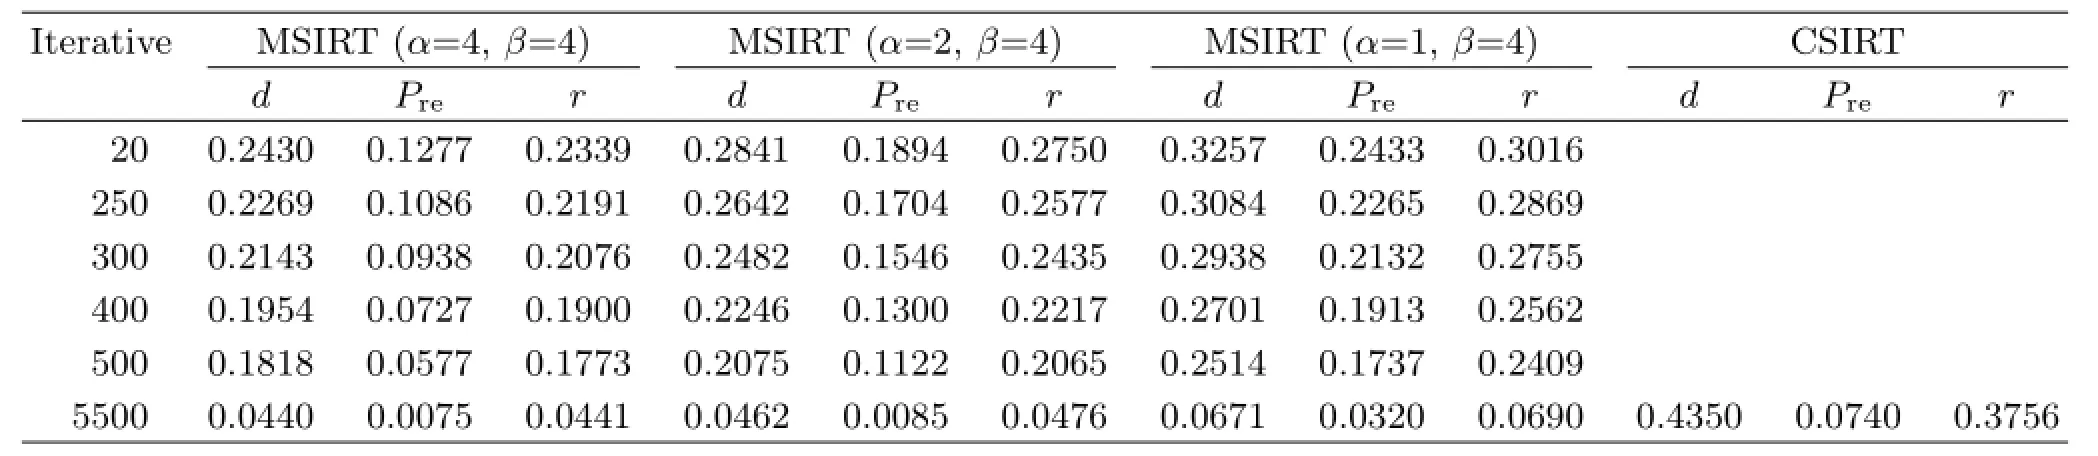
TABLE II Reconstruction errors of modified SIRT compared with conventional SIRT.
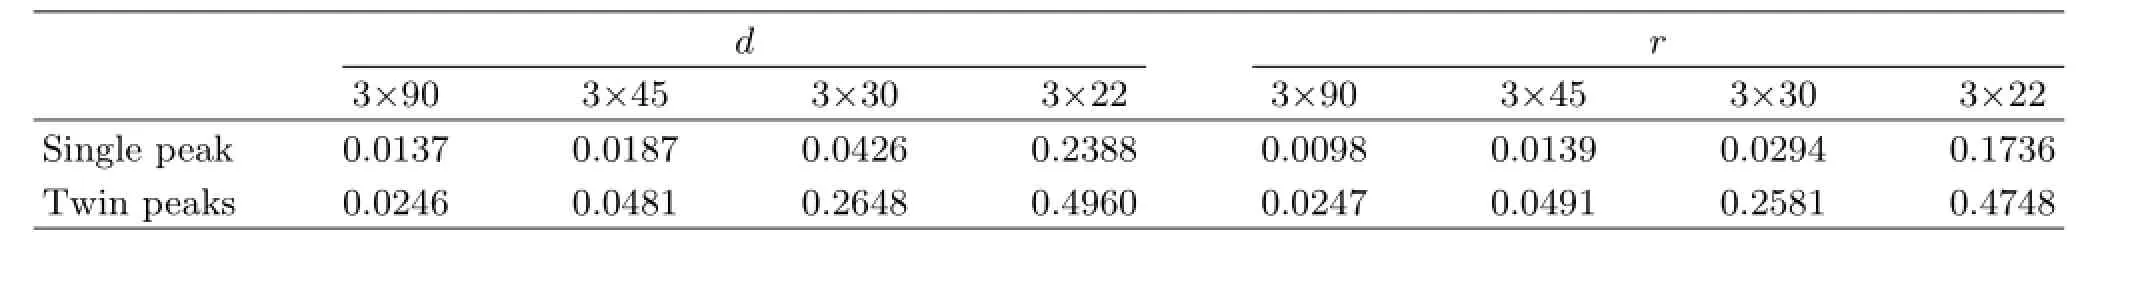
TABLE III Reconstruction errors of single peak and twin peaks Gaussian plume in different optical paths.
The number of pixels used in the model of single peak Gaussian plume is N=8×8,a spectrum was collected every 1◦,2◦,3◦,4◦respectively in the reconstruction simulations,the total optical paths is 3×90, 3×45,3×30,3×22 respectively,Cconditionis less than a certain minimum 0.00001,andα,βis 4 respectively. Figure 4 shows that the model of single peak and twin peaks Gaussian plume could be reconstructed by different optical paths.The reconstructed quality gets worse and worse as the scanning optical path decreases.Comparing Fig.4 with Fig.2,we can see that reconstruction results without noise are consistent basically with the Gaussian model,so algorithm reconstruction technique and layout plan of light path are feasible.
From Table III we can see that the reconstructed error becomes bigger and bigger as the scanning optical path decreases,and we also see that the reconstructed error of single peak Gaussian plume is less than that of twin peaks Gaussian plume when the number of optical path is fixed.All in all,the reconstructed quality of single peaks Gaussian plume is superior to that of twin peak Gaussian plume in the same geometry of optical path.
IV.EXPERIMENTS
Due to opticalremote sensing,monitoring results are inevitably affected by meteorological conditions.Generally good weather brings strong light intensity,and these will bring good monitoring results,that is,under good measurement conditions,the algorithm presented performs well and monitoring accuracy of MAXDOAS system will be improved.For increasing projection data,the rays scanned plume at angular intervals of1◦in the experiments,giving 5−10 min for a fullscan. Measurements were conducted using an available mini-MAX-DOAS instrument developed at Anhui Institute of Optics&Fine Mechanic.
Inclined column concentration SCD measured by MAX-DOAS is adopted to retrieve two dimension distribution of smoke plume,just as Eq.(5).Because MAX-DOAS is far away from smoke plume,a region is chosen to make measurement,which encloses the plume and covers the altitude range from the ground up to the expected top of the plume,angle concentrated between 30◦and 60◦.The reconstruction image of the smoke plume based on MSIRT is shown in Fig.5,andα,βrespectively is 5,4.Throughout the 2 h measurements, the plume rise height was very stable,which is about 360 m.Smoke plume mainly concentrated in the center of the scanning area,which is consistent basically withthe practical situation.From the reconstructed on line images a dynamic view of the concentration profile of the trace gas can be gleaned.
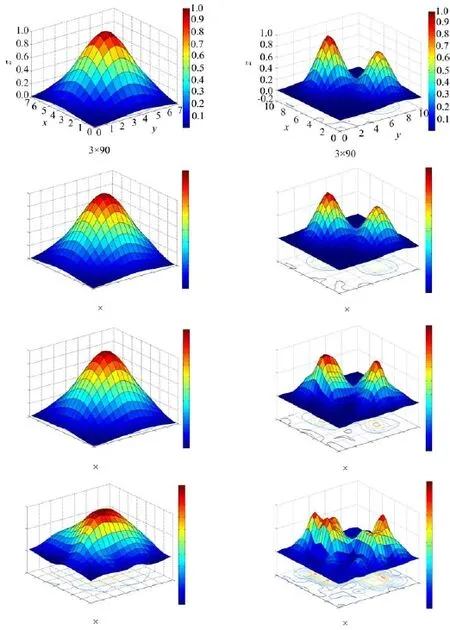
FIG.4 The reconstruction figure in different optical paths.Left panel:single peak,right panel:twin peaks.
Figure 6 shows the result of the measured column density compared to reconstructed column density in different angle,we can see the reconstructed column data are consistent basically with the measured column data.However,Fig.6(a)shows the consistency of the simulation value and the measured value is not very good in angle of 40◦−50◦.From Fig.6,we can see the measured column density in angle of 135◦−155◦is basically stable,on the contrary,the measured column density in angle of 40◦−50◦is obviously fluctuant.The measured data uncertainty can explain why the reconstruction result is bad.
V.CONCLUSION
Due to the influence of such factors as the location of the pollution sources and diffusion,the reconstruction effect is also different while using the same light path diagram to monitor.The reconstruction algorithm andits parameters should be chosen and set according to the purpose of monitoring and the situation of the monitoring area.

FIG.5 Reconstruction of the NO2plume from a power plant.
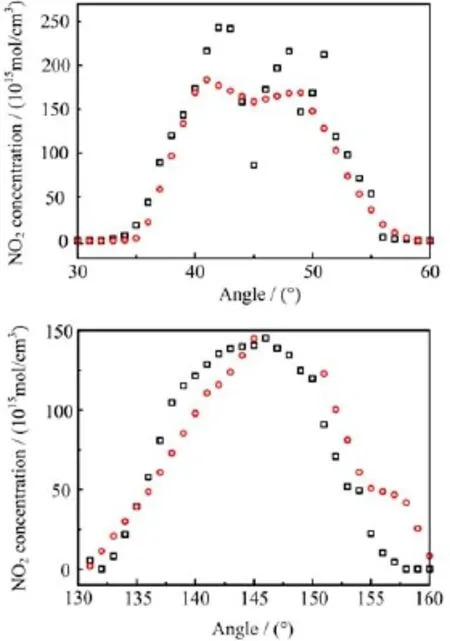
FIG.6 Line integral concentration in various angle of measured and reconstructed.Symbol and◦represent measured column density and reconstructed column density.
The ability of the reconstruction lies in the amounts of projections,the amounts of projections can be increased by increasing the number of DOAS or optical path,algorithm optimization can also do so.However, the increased measurement cost limits its application, these factors are open for further studies.The results help application research of atmospheric trace gas distribution.
Results show that the theory is conformed with the practice,the system can realize gas two-dimensional space reconstruction,optical tomography is feasible for monitoring atmospherical environment.The experimental result was consistent with actual situation.The tomography system described herein is believed to be applicable to other atmospherical measurements.
VI.ACKNOWLEDGMENTS
This work is supported by the National Natural Science Fundation of China(No.41275027 and No.41475017)and the Research Foundation of Education Bureau of Anhui Province of China (No.KJ2012ZD006 and KJ2015A069).The authors would like to thank the differential optical absorption spectroscopy group for their help.
[1]S.W.Li,W.Q.Liu,J.T.Wang,P.H.Xie,and X.D. Wang,Spectrosc.Spectra.Anal.33,444(2013).
[2]N.Li and C.S.Weng,Chin.Opt.Lett.9,061201 (2011).
[3]N.Li,X.J.Lv,and C.S.Weng,Chin.Opt.Lett.12, 121103(2014).
[4]A.Hartl,B.C.Song,and I.Pundt,Atmos.Chem.Phys. 6,847(2006).
[5]Y.Wang,A.Li,and P.H.Xie,Chin.Phys.B 21, 114211(2012).
[6]S.W.Li,P.H.Xie,E.H.Jiang,and Y.Zhang,Chin. J.Chem.Phys.25,739(2012)
[7]Y.Wang,A.Li,and P.H.Xie,Atmos.Meas.Tech.7, 1663(2014).
[8]M.Johansson,B.Galle,C.Rivera,and Y.Zhang,Bull. Volcanol.71,747(2009).
[9]L.Todd and G.Ramachandran,Am.Ind.Hyg.Assoc. J.55,403(1994).
[10]S.W.Li,P.H.Xie,M.H.Wei,and J.T.Wang,Chin. J.Chem.Phys.28,119(2015).
[11]L.F.Chen,D.Han,J.H.Tao,and L.Su,J.Remote Sensing 7,343(2009).
[12]J.Xu,P.H.Xie,F.Q.Si,F.C.Wu,Y.Wang,J.G.Liu, W.Q.Liu,A.Hartl,and Chan Ka Lok,Chin.Phys.B 23,094210(2014).
[13]A.Li,P.H.Xie,and C.Liu,Chin.Phys.Lett.24,2859 (2007).
[14]M.S.Wei,M.M.Tong,J.F.Hao,L.Cai,and J.Xu, Int.J.Mining Sci.Technol.22,514(2012).
∗Author to whom correspondence should be addressed.E-mail: swli@chnu.edu.cn
 CHINESE JOURNAL OF CHEMICAL PHYSICS2015年6期
- CHINESE JOURNAL OF CHEMICAL PHYSICS的其它文章
- Importance of Metal Cations and Water for Stability of MnO2Crystals
- Elastic Low-Energy Electron Collisions with Methanethiol
- Antireflective and Self-cleaning Properties of SiO2/TiO2Double-Layer Films Prepared by Cost-Effective Sol-Gel Process
- Effects of Sm Co-doping on Luminescent Properties of Sr4Al14O25:M (M=Mn4+,Cr3+)Phosphors
- Pyrene Derivate Functionalized with Acetylene for Organic Field Effect Transistors
- Miniature Boat Fabrication with Striking Loading Capacity in Seawater from Hydrophobic Steel Mesh