Bayesian method for system reliability assessment of overlapping pass/fail data
Zhipeng Hao,Shengkui Zeng,2,and Jianbin Guo,2,*
1.School of Reliability and Systems Engineering,Beihang University,Beijing 100191,China;
2.Science and Technology on Reliability and Environmental Engineering Laboratory,Beijing 100191,China
Bayesian method for system reliability assessment of overlapping pass/fail data
Zhipeng Hao1,Shengkui Zeng1,2,and Jianbin Guo1,2,*
1.School of Reliability and Systems Engineering,Beihang University,Beijing 100191,China;
2.Science and Technology on Reliability and Environmental Engineering Laboratory,Beijing 100191,China
For high reliability and long life systems,system pass/fail data are often rare.Integrating lower-level data,such as data drawn from the subsystem or component pass/fail testing, the Bayesian analysis can improve the precision of the system reliability assessment.If the multi-level pass/fail data are overlapping, one challenging problem for the Bayesian analysis is to develop a likelihood function.Since the computation burden of the existing methods makes them infeasible for multi-component systems,this paper proposes an improved Bayesian approach for the system reliability assessment in light of overlapping data.This approach includes three steps:fristly searching for feasible paths based on the binary decision diagram,then screening feasible points based on space partition and constraint decomposition,and fnally simplifying the likelihood function.An example of a satellite rolling control system demonstrates the feasibility and the effciency of the proposed approach.
system reliability assessment,Bayesian analysis,limited samples,overlapping pass/fail data.
1.Introduction
System pass/fail data are often rare for high reliablility and long life systems in the aeronautics and astronautics area due to the diffculty of testing,which brings a great challenge to the system reliability assessment.To improve the accuracy of assessment results,a direct and effcient method is to utilize data drawn from the subsystem or component pass/fail testing[1].Graves et al.investigated possible discrepancies between reliability estimates based on different levels of data[2].Wilson et al.studied uncertainty quantifcation in the system reliability assessment with multi-level data[3].Reese et al.[4]and Jackson et al.[5]incorporated multi-level lifetime data to estimate the system reliability.Guo and Wilson provided a Bayesian method to estimate the system reliability using heterogeneous multi-level information[6,7].Peng et al.also estimated the system reliability with multi-level heterogeneous data sets[8,9].
There are two distinct types of multi-level data:overlapping and non-overlapping[10].For‘overlapping’,it means that the data are drawn from the same system at the same time or during the same process[11,12].And vice versa. It would be a mistake to treat the overlapping data as nonoverlapping,which ignores the dependency and results in double-counting[10].For the scope of this paper,we focus on pass/fail data.
Approximate Bayesian techniques were developed to manage multi-level pass/fail data by Martz et al.[13,14]. Then,Martz et al.pointed out that the overlapping data have a unique feature[15].Johnson et al.[16]and Hamada et al.[10]proposed fully Bayesian techniques to deal with the non-overlapping data.Graves et al.frstly introduced an approach to assess the reliability of binary-state systems by adopting overlapping data[17].The approach is based on the disjoint generalized cut sets.It is suitable to process data in a single test.For distinct records in successive tests, the disjoint algorithm should be carried out over and over again,which would lead to intensive computation.Jackson and Mosleh proposed an alternative method to incorporate the distinct records as a whole[11,12].All combinations of component state vectors are enumerated and then screened individually according to the test results.Forthe series system composed of two components in[12],only two of the 286 combinations of component state vectors are consistent with the test result.Apparently,enumeration results in redundancy.Moreover,screening wastes computation resources on the judgment of the consistency between these combinations and the test result.For the situation where a system has more components,this approach will be infeasible,which leads to intensive or even unaffordable computation[12].
For the system reliability assessment in light of overlap-ping pass/fail data,an improved fully Bayesian approach is proposed to manage the computation burden.It includes three steps:frstly searching for the feasible paths,which defne the feasible space,based on the binary decision diagram(BDD);then screening the feasible points,which consist of the feasible sets,based on space partition and constraint decomposition;fnally simplifying the form of the likelihood function based on the frst two steps.An example of a satellite rolling control system demonstrates the feasibility and the effciency of the computation reduction and the likelihood function simplifcation of the proposed methodology.
2.Features of overlapping pass/fail data
The features of overlapping pass/fail data are described by two related cases below.And we defne 0 as the failure state and 1 as the success state.
Case 1The two-component series system is tested by 10 successive times.In three tests the system fails,while in the other tests it operates.For the three failure cases,the component state vectors could be(1,0),(0,1)or(0,0).For the other cases,the corresponding vector is(1,1).According to the test results,there are 10 possible combinations of these state vectors altogether,such as{2(1,0),1(0,1),0(0, 0),7(1,1)}and{1(1,0),1(0,1),1(0,0),7(1,1)}.
Case 2On the basis of Case 1,only one individual failure of component A is simultaneously detected.For the instance that both the system and component A fail,the possible component state vector is(0,1)or(0,0).For the other two instances that the system fails and component A operates,the vector is(1,0).Therefore the number of combinations decreases to two,which are{2(1,0),1(0,1), 0(0,0),7(1,1)}and{2(1,0),0(0,1),1(0,0),7(1,1)}.
As the preceding cases show,there are two remarkable features of overlapping data:the combination of the component state vectors and the variation of the number of a specifc vector in such a combination.In addition,overlapping data can give us some instructions to fnd out the failure locations and causes.
3.Likelihood function of overlapping data
One of the key issues of the Bayesian analysis is to defne the likelihood function.Generally speaking,the binomial distribution can be chosen as the likelihood function if the data are in the pass/fail form.However,when the pass/fail data are overlapping,the combinations of the component state vectors will be completely different.Then the likelihood function requires reformulation.
For limited samples of the high reliability and long life system,each sample has its own test records,i.e.,overlapping data.Then they need their own likelihood functions, which require to be integrated.And the integrated likelihood function is achieved according to the following three steps.
Step 1The feasible path,space and hyperplane
The generalized cut set method implements boolean calculation at each level where the data are collected.Then a disjoint solution can be achieved by employing the disjoint algorithm.For every independent sample and its test records,the Boolean calculation and the disjoint algorithm are executed repeatedly,which leads to intensive computation.
For enumeration,it lists all component state vectors. Each vector implies an instance of all level states of the system by the structure function.However for a specifc sample,enumeration introduces redundant state vectors, which confict with the multi-level states implied by the overlapping data.This results in intensive computation [12].
To reduce the computation workload,we propose a BDD-based searching method to eliminate those redundant vectors,which are inconsistent with the overlapping data. Here a low-pressure coolant injection(LPCI)system[17] is taken as an example to illustrate our approach.The reliability block diagram(RBD)and the corresponding BDD of this example are shown in Fig.1.
Note that the size of BDD heavily depends on the order of nodes,i.e.,components.According to our experience, the component with data records is chosen as the root node. If there is not any component that has data records,the sub-BDD of the lowest level subsystem is chosen,which has data records,as the frst building block.
For the eight instances of Table 3 in[17],the generalized cut set approach is employed eight times to obtain the disjoint solutions.On the contrary,the BDD illustrates the disjoint paths.Consider Instance 2 of[17]where success is detected at the system level,112 and 212.According to Fig.1(b),the corresponding paths are 1121→1122→121→122→2121→2122,1121→1122→121’→2121→2122→221→222 and 1121→1122→121→122’→2121→2122→221→222.Because of its abstract logic attribute,the BDD model can be suitable to all test instances and samples.Thus the BDD can uniformly incorporate all overlapping data of the population.
Note that the frst path consists of an original path of BDD,1121→1122→121→122,and a separated subpath,2121→2122.This implies that for some instances of over-lapping data,the original paths cannot fully cover the multi-level states.Some sub-paths or nodes need to combine with the original path.The integrated path is fnally achieved.

Fig.1 LPCI system


We observe that some paths in BDD confict with the multi-level states implied by the overlapping data.For example,the dashed paths in Fig.1(b)confict with the second instance of[17].To develop the proper likelihood function,these unqualifed paths ought to be eliminated.

In conclusion,the feasible paths are the basis to develop the likelihood function.Detecting the feasible paths by searching the BDD model can signifcantly reduce the computation workload for the development of the likelihood function.
Step 2The feasible points and set
For the given overlapping data,not all points in the feasible hyperplane coincide with the data.To develop the likelihood function,we need to identify the appropriate points.
In fact,the test result consists of two portions:the distinct instances of multi-level states,e.g.,eight instances of [17],and the occurrence times of a specifc instance,e.g., the assumption in the former step.Therefore the test result restricts the possible combinations of the feasible paths and the occurrence times of a specifc feasible path in the com-bination.Actually,it is the criterion to screen the points, i.e.,combinations,in the feasible hyperplane.Now the feasible point is defned by the selected point consistent with the test result in the feasible hyperplane.

Fig.2 Reduction of spaces
Since there are exactly two consequences of the pass/fail test,the feasible paths lead to either success or failure. Thus the feasible paths are classifed into two categories, the success paths and the failure paths.The feasible space is then divided into two subspaces,the success space and the failure space,respectively,denoted by S and F,as the two regions labeled by S and F in Fig.3.

Fig.3 Success space and failure space
The test result gives the number of system success k and system failure l(k+l=n),both of which are constraints. Each constraint defnes a hyperplane,which means that the feasible hyperplane is divided into two sub-hyperplanes,as the dot lines in S and F in Fig.3.
For the points(ki1,ki2,...,kis)in the success hyperplane,their coordinates satisfy k=ki1+ki2+···+kis,and the corresponding probability vector is(pi1,pi2,...,pis). For the points(lj1,lj2,...,ljf)in the failure hyperplane, their coordinates satisfy l=lj1+lj2+···+ljf,and the corresponding probability vector is(pj1,pj2,...,pjf).
After space partition and constraint decomposition,the screening workload is remarkably reduced.The feasible point can be obtained by pairing its counterparts in the success and failure spaces.All feasible points form the feasible set.The likelihood function is developed according to the feasible set.
Each sample has its own numbers of system success and failure,i.e.,a pair of constraints.Each pair leads to its own feasible points and feasible set.
Step 3The integrated likelihood function
Each feasible point corresponds to a specifc combination of the feasible paths.The coordinates of a feasible point are the occurrence times of the feasible paths.Thus the probability of a feasible point is


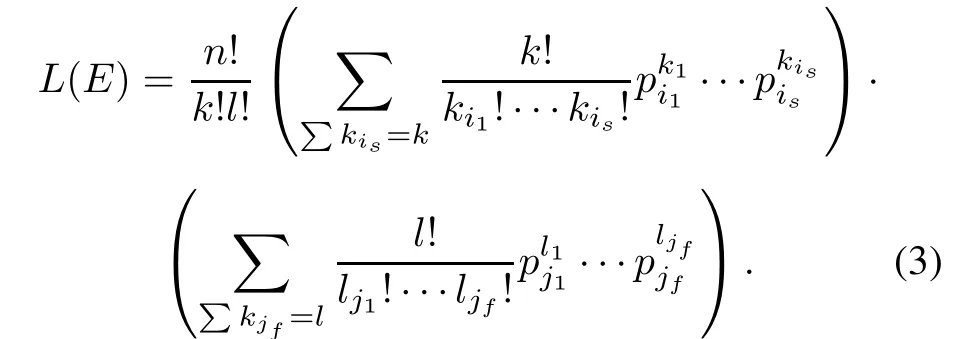
The likelihood function of a specifc sample is

According to Step 2,the likelihood function is simplifed as follows:

For the population,including z samples,the integrated likelihood function is

Based on the Bayesian theorem,the joint posterior distribution of uncertain parameters in the system reliability function is obtained.The posterior predictive distribution of the system reliability is also ascertained.

4.Reliability assessment of satellite rolling control system
Fig.4 illustrates RBD and BDD of a satellite rolling control system.It consists of dual-redundancy fight control computer C11/C21,electronic control unit C12/C22,engine control unit C31,and engine C32.With the aid of sensors, overlapping data are recorded for two samples in a ground test as shown in Table 1.

Fig.4 RBD and BDD of a satellite rolling control system

Table 1 Overlapping data of the rolling control system


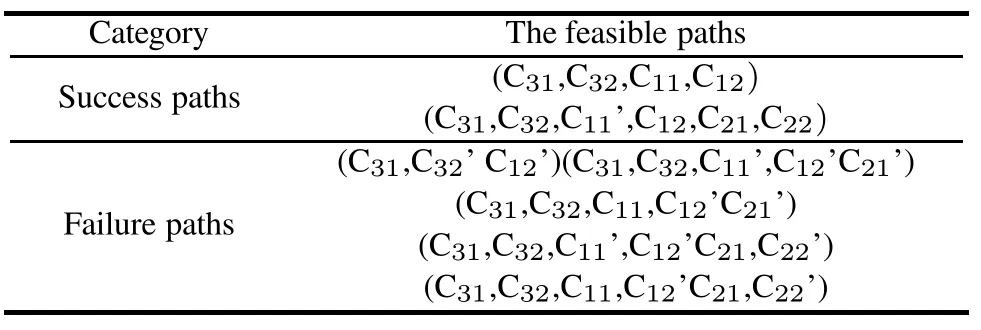
Table 2 Feasible paths of S1

Table 3 Feasible paths of S2
After space partition and constraint decomposition,the number of feasible points is presented in Table 4.The total screening workload is 162,which is nearly 7×10¹¹times less than enumeration.

Table 4 Number of feasible points
The likelihood function for S1 is

where p1s=p1s1+p1s2,p1f=(p1f1+p1f2+p1f3+ p1f4+p1f5).
The likelihood function for S2 is

where p2s=p2s1+p2s2,p2s′=p2s3+p2s4.
The integrated likelihood function is

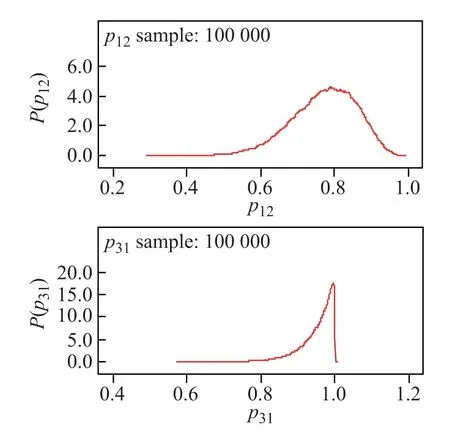
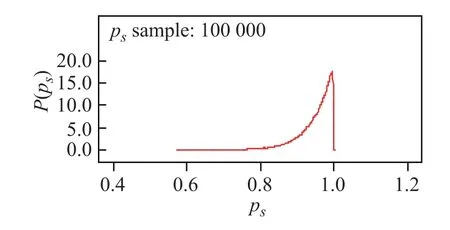
Assume that the prior distributions of C12and C31are both U(0,1),which makes the observations dominate the posteriors.Fig.5 and Fig.6 illustrate the posteriors of C12, C31and the system.The uncertainties of C12,C31and the system are presented in Table 5.It is obvious that C12is the weak point,which is consistent with the overlapping data in Table 1.Since C12and C22are identical,we can conclude that C22is also of relatively low reliability.However,thanks to the parallel confguration,which can provide high reliability with relatively low component reliability,the system is highly reliable.

Fig.5 Posterior distributions of C12and C31

Fig.6 Posterior distributions of the system

Table 5 Uncertainty of C12,C31and the system
5.Conclusions
For the system reliability assessment in light of overlapping pass/fail data,an improved fully Bayesian approach is proposed to manage the computation burden.The main advantage of this approach over alternative methods is the feasibility for multi-component systems,which is verifed by an example of a satellite rolling control system.For the six component control system,comparing with enumeration,the proposed Bayesian approach signifcantly reduces the computation workload by1229129451times and simplifes the form of the likelihood function.In addition,uncertainties of the parameters in the system reliability function can also be obtained.
[1]M.Huang,Y.Zhao.A numerical analysis method for the integrated reliability assessment.Systems Engineering and Electronics,2002,24(11):131–134.(in Chinese)
[2]T.L.Graves,C.M.Anderson-Cook,M.S.Hamada.Reliability models for almost-series and almost-parallel systems.Technometrics,2010,52(2):160–171.
[3]A.G.Wilson,C.M.Anderson-Cook,A.V.Huzurbazar.A case study for quantifying system reliability and uncertainty.Reliability Engineering and System Safety,2011,96(9):1076–1084.
[4]C.S.Reese,A.Wilson,J.Q.Guo,et al.A Bayesian model for integrating multiple sources of lifetime information in systemreliability assessments.Journal of Quality Technology,2011, 43(2):127–141.
[5]C.Jackson,A.Mosleh.Bayesian inference with overlapping data for systems with continuous life metrics.Reliability Engineering and System Safety,2012,106:217–231.
[6]J.Q.Guo,A.G.Wilson.Bayesian methods for estimating system reliability using heterogeneous multilevel information. Technometrics,2013,55(4):461–472.
[7]J.Q.Guo,A.G.Wilson.Bayesian methods for estimating the reliability of complex systems using heterogeneous multilevel information.Proc.of the Joint Statistical Meeting,2011.
[8]W.W.Peng,H.Z.Huang,M.Xie,et al.A Bayesian approach for system reliability analysis with multilevel pass-fail,lifetime and degradation data sets.IEEE Trans.on Reliability, 2013,62(3):689–699.
[9]W.W.Peng,Z.L.Xiao,Y.Y.Wang,et al.A combined Bayesian framework for satellite reliability estimation.Proc. of the International Conference on Quality,Reliability,Risk, Maintenance,and Safety Engineering,2011.
[10]M.S.Hamada,H.F.Martz,C.S.Reese,et al.A fully Bayesian approach for combining multilevel failure information in fault tree quantifcation and optimal follow-on resource allocation. Reliability Engineering and System Safety,2004,86(3):297–305.
[11]C.Jackson,A.Mosleh.Downwards propagating:Bayesian analysis of complex on-demand systems.Proc.of Annual Reliability and Maintainability Symposium,2010:1–6.
[12]C.Jackson,A.Mosleh.Downwards inference:Bayesian analysis of overlapping higher-level data sets of complex binarystate on-demand systems.Proc.of the Institution of Mechanical Engineers,Part O:Journal of Risk and Reliability,2012, 226(2):182–193.
[13]H.F.Martz,R.A.Wailer,E.T.Fickas.Bayesian reliability analysis of series systems of binomial subsystems and components.Technometrics,1988,30(2):143–154.
[14]H.F.Martz,R.A.Wailer.Bayesian reliability analysis of complex series/parallel systems of binomial subsystems and components.Technometrics,1990,32(4):407–416.
[15]H.F.Martz,R.G.Almond.Using higher-level failure data in fault tree quantifcation.Reliability Engineering and System Safety,1997,56(1):29–42.
[16]V.E.Johnson,T.L.Graves,M.S.Hamada,et al.A hierarchical model for estimating the reliability of complex systems.J. M.Bernardo.Bayesian Statistics 7.USA:Oxford University Press,2003:199–213.
[17]T.L.Graves,M.S.Hamada,R.M.Klamann,et al.Using simultaneous higher-level and partial lower-level data in reliability assessments.Reliability Engineering and System Safety, 2008,93(8):1273–1279.
Biographies

Zhipeng Hao was born in 1981.He is a Ph.D.candidate in systems engineering at School of Reliability and Systems Engineering,Beihang University.He also holds the master degree of applied mathematics.His current research interests are reliability assessment and integration design of system reliability and performance.
E-mail:haozhipeng@buaa.edu.cn

Shengkui Zeng was born in 1968.He received his Ph.D.degree from Beihang University in 2009.Now he is a professor,and a vice-dean of School of Reliability and Systems Engineering,Beihang University. His current research interests include integration design of system reliability and performance,comprehensive quality design,and physics of failure based reliability design and analysis.
E-mail:zengshengkui@buaa.edu.cn

Jianbin Guo was born in 1978.He received his Ph.D.degree from Beihang University in 2008.Now he is an assistant professor in School of Reliability and Systems Engineering,Beihang University.His current research interests include electromechanical system reliability simulation,integration design of reliability and performance,and comprehensive design of performance and reliability maintainability supportability.
E-mail:guojianbin@buaa.edu.cn
10.1109/JSEE.2015.00025
Manuscript received May 05,2014.
*Corresponding author.
This work was supported by the National Natural Science Foundation of China(61304218).
 Journal of Systems Engineering and Electronics2015年1期
- Journal of Systems Engineering and Electronics的其它文章
- Incorporating S-shaped testing-effort functions into NHPP software reliability model with imperfect debugging
- Novel electromagnetism-like mechanism method for multiobjective optimization problems
- EMMD-Prony approach for dynamic validation of simulation models
- Novel region-based image compression method based on spiking cortical model
- Workload-aware request routing in cloud data center using software-defned networking
- Model algorithm control using neural networks for input delayed nonlinear control system
