Gene expression profile in H4IIE rat hepatoma cells exposed to an antifouling booster biocide Irgarol-1051 degradation product
Xu Yan Lam Ka-Ho Lam Michael Hon-Wah
(1School of Civil Engineering, Southeast University, Nanjing 210096, China)(2Department of Biology and Chemistry, City University of Hong Kong, Hong Kong, China)
Gene expression profile in H4IIE rat hepatoma cells exposed to an antifouling booster biocide Irgarol-1051 degradation product
Xu Yan1,2Lam Ka-Ho2Lam Michael Hon-Wah2
(1School of Civil Engineering, Southeast University, Nanjing 210096, China)(2Department of Biology and Chemistry, City University of Hong Kong, Hong Kong, China)
To better understand the toxicity of an antifouling booster biocide Irgarol-1051 degradation product M2(3-[4-tert-butylamino-6-methylthiol-s-triazin-2-ylamino]pro-pionaldehyde), this study utilized a DNA microarray technique to explore the genotoxicity of M2. The Affymetrix, Inc. rat genome 230 2.0 GeneChip was employed to examine alterations in gene regulation in rat hepatoma cells exposed to 30 μmol/L of M2 for 96 h. The results showed that 38 genes were significantly (p<0.002 5) altered by M2 at two-fold changes in all the four possible control/exposure comparisons. Accn5 was the only well described gene consistently being suppressed, which likely altered the epithelial sodium channel (ENaC). 10 and 82 annotated genes were up- and down-regulated in at least one of the control/exposure comparisons, respectively. The induced genes were mainly involved in the nucleus belonging to the cellular component. The largest categories of suppression concerned G-protein coupled receptor protein signaling pathways belonging to the biological process and integral to membranes belonging to the cellular component.
Irgarol-1051; degradation product M2; microarray; gene expression; genotoxicity
Antifouling agents are utilized to reduce the attachment of living organisms to the submerged surfaces of aquatic infrastructures. The antifouling action is usually a result of biocide release[1]. Among the commercial antifouling booster biocides, Irgarol-1051 (2-methythio-4-tert-butylamino-6-cyclopropylamino-s-triazine) is specifically designed for use in marine antifouling coatings to replace the highly toxic organotin-base antifoulants[2]. Irgarol-1051 was believed to have low biological activity in animals in general. However, the toxicological information of dominant antifoulants such as Irgarol 1051 in particular, is required in view of reports of its broad distribution and its persistence in global coastal waters[2-4]. The high toxicity of Irgarol-1051 to phytoplankton and minimal toxicity to animals has been established by many studies[1, 5]. The predominant stable degradation product of Irgarol-1051 in natural waters is 2-methylthio-4-tert-butylamino-6-amino-s-triazine(M1 or GS26575), which is generally less toxic to aquatic phytoplankton, but more toxic to root elongation of terrestrial plants than Irgarol-1051[5]. Thereafter, M2 (3-[4-tert-butylamino-6-methylthiol-s-triazin-2-ylamino]propionaldehyde), a new Irgarol-1051 degradation product, was identified in coastal waters[4]. M2 is more polar than its parent Irgarol-1051, but less polar than M1. The average logKowvalues are 3.38, 2.54 and 2.92 for Irgarol-1051, M1 and M2, respectively[6]. M2 is readily decomposed to M1 upon heating or UV irradiation[4]. Although M2 cannot be regarded as a persistent compound in the environment, it has relatively high concentrations (11.09 to 20.28 μg/L) in coastal waters, which are comparable to the residual levels of M1 and more than ten times higher than its Irgarol-1051 parent[4]. Up to now, no toxicity study of this new s-triazine compound M2 has been undertaken. Therefore, the ultimate goal of the present study is to provide a preliminary screening for the genotoxicity of M2 using the genomewide expression analysis method based on the rat genome[7].
1 Materials and Methods
1.1 Cell culture
H4IIE-luc cells were cultured as described elsewhere[7]. Briefly, the cells were cultured in a Dulbecco’s Modified Medium (Sigma D-2902, Sigma, St. Louis MO) amended with 10% fetal bovine serum (FBS, Hyclone, Logan, UT) using 100 mm tissue culture plates. The incubation conditions were set at 37 ℃, under 5% CO2and a relative humidity of 90%. Culture media were refreshed every 48 h. At approximately 80% to 90% confluence, cells were released from the plate surface with typpsin/EDTA (Hyclone, Logan, UT), and split into five tissue culture plates. This subculture was carried out every four days. Cells between passages 5 and 10 were prepared for further study.
1.2 Chemical preparation
M2 was prepared in accordance with the literature method[4]. DMSO is usually used in exposure studies because of its low adverse effects on cells. In this study, a DMSO solution with a low concentration of M2 (100 μg/L) and a medium solution of M2 (100 μg/L) were stored under the same conditions of cell incubation for 72 h. No significant M2 degradation was observed.
1.3 Cytotoxicity test
The water solubility of Irgarol-1051 is around 7 mg/L (30 μmol/L)[8]. Therefore, 7 mg/L was used as the high test concentration to evaluate the cytotoxicity of M2. Cells were suspended from the tissue culture plate and transferred onto a 96-Well ViewPlate. (Packard Instruments, Meriden, CT, USA) (0.25 mL/well). The cell concentration in each well was 7.5×10⁴cells/mL. Cells were incubated for 24 h, prior to M2 dosing. Solvent control wells were exposed to 2.5 μL of solvent (DMSO, ACS Sigma, USA). Test wells received a dilution series of M2 (final concentrations were 100, 30, 10, 3, 1 and 0.3 μmol/L) while blank wells received no dose. The final concentration of solvent in each well was 1%. The Triplicate wells were prepared for each concentration. After 72 h of exposure, cell viability assays were conducted using the LIVE/DEAD Viability/Cytotoxicity Kit (Invitrogen, CA, USA) following the manufacture manual. Two recognized parameters of cell viability, intracellular esterase activity and plasma membrane integrity, were determined. No significant cytotoxicity was produced in the 30 μmol/L treatment and other more diluted ones.
1.4 M2 treatment
The stock M2 solution used in the exposure was 30 mmol/L in DMSO. 10 cm tissue culture plates were used in all exposure experiments. First, cells were split into sixteen tissue culture plates. 24 h later, after all cells attached to the plate surfaces, eight of the sixteen plates were exposed to 12 mL of the dosing solution (12 mL of culture medium with 12 μL of M2 stock). The finial concentration 30 μmol/L was comparable to the water solubility of Irgarol-1051. The control groups were treated with 12 mL medium and achieved a final concentration of 0.1% DMSO only. All the cells were incubated for 72 h at 37 ℃ with 5% CO2and a relative humidity of 90%.
1.5 Total RNA extraction and purification
Total RNA was isolated from H4IIE cells with the Trizol Reagent (Invitrogen, CA, USA) following manufacturer procedures. Prior to extraction, cell conditions were checked and rinsed twice with ice-cold 1×PBS (phosphate buffer saline). The purity of the extracted RNA was evaluated by the ratio of the optical densities measured at 260 and 280 nm and the total RNA concentrations were determined by the absorbance at 260 nm. The quality of RNA was evaluated by the appearance of the distinct 18S and 28S ribosomal RNA bands in 1% agarose gel electrophoresis. High quality RNA shows the 28S RNA band with twice the intensity of the 18S rRNA band. Duplicate samples of total RNA from each of the four identical plates, which were exposed to the same dose of M2 or DMSO, were pooled for subsequent GeneChip analysis immediately after RNA purification using the RNeasy Total RNA Mini Kit (Qiagen, CA, USA). The final total RNA samples had absorbance ratios of 260/280 nm between 1.90 and 2.00 and concentrations greater than 1 μg/μL.
1.6 Microarray analysis
The microarray experimental procedures were as previously described[9]. In brief, single and double stranded cDNA were synthesized from the total RNA using the SuperScript II (Invitrogen, CA, USA). 16 μg of high-quality total RNA were used as the template and 2 μL of 50 μmol T7-Oligo(dT)24(5′-GGCCAGTGAATTGTAATACGACTCACTATAGGGAGGCGG-(dT)24-3′ Operon, HPLC purified DNA) was used as the primer. The double stranded cDNA was further cleaned up, followed by biotin-labeled complementary RNAs synthesis with the Enzo Bioarray HighYield RNA Transcript Labeling Kit (Affymetrix, CA, USA). The synthesized cRNA purification was conducted using the RNeasy Mini Kit (Qiagen, CA, USA) and fragmented for hybridization analysis. A 15 μg of aliquant of the fragmented cRNA was hybridized with the Rat Genome 230 2.0 array (Affymetrix, CA, USA) in a hybridization cocktail. Hybridization lasted for 16 h at 45 ℃. Thereafter, automated washing and staining, with streptavidin-phycoerythrin (SAPE, Molecular Probes, OR, USA), were conducted following the Affymetrix GeneChip Expression Analysis Technical Manual. Probe arrays were scanned with the G2500A GeneArray Scanner (Affymetrix, CA, USA) and the distribution of fluorescent material on the array was obtained using the Microarray Suite (MAS) version 5.0 and GeneChip Operating Software (GCOS) supplied by Affymetrix to perform gene expression analysis. A total of four chips were obtained in this study: two control samples (0.1% DMSO) and two exposure samples (30 μmol/L M2 and 0.1% DMSO).
1.7 Gene tree, condition tree and pathway analysis
GeneChip data was retrieved using the Affymetrix “data mining” tool (Affymetrix, CA, USA). The hierarchical dendrogram was constructed with the gene tree algorithm of GeneSpring 7.2 (Silicongenetics, CA, USA) as described elsewhere[9]. The gene tree was created by clustering genes according to their expression responses. Genes that greatly correlated with each other tend to be clustered together. The location/distance of a branch indicates the similarity of the gene expression. Similarly to gene trees, condition trees examine the relationships of the expression levels among different treatments. In this study, the horizontal axis showed the clustering of the genes based on their expression profile affected by the treatments and the vertical axis showed the clustering according to their gene expression across treatments. The gene map annotator and pathway profiler (GenMAPP) was applied to visualize the gene expression data associated with metabolic and signaling pathways, as well as gene clusters on maps.
1.8 Statistical analysis
In the present study, the GeneChip probe arrays designed to be each gene were represented by 11 to 20 probe pairs (each probe is 25 bp in length). For each probe pair, one was a perfect match probe and the other was a mismatch probe. The mismatch probe was almost identical to the perfect match one, except for the base difference at nucleotide 13. The probe pair was designed as an internal control to evaluate the cross hybridizations between closely related target sequences. Sensitivity and specificity of the GeneChips were achieved by the relative spot intensity between all perfect match probes and between each match and mismatch probe pair. The signal detectionp-value was generated by the One-Sided Wilcoxon’s Signed Rank test. A smallp-value was obtained when the overall intensity of a perfect match was much greater than that of a mismatch. Here, ap-value less than 0.04 indicated the presence of a probe set, whereas ap-value greater than 0.06 indicated the absence of a probe set.
In the commonly used comparison analysis mode of the Affymetrix GeneChip system, two samples were hybridized to two GeneChip probe arrays. They were compared to each other to reveal the changes in gene expression. One GeneChip was set as the control GeneChip and the other was set as the treated GeneChip. To minimize the uncertainties, all the data were scaled and normalized with the rat230-2norm.msk to 2000 automatically to correct for variations in the overall intensity and heterogeneity between the two GeneChip probe arrays. In the data comparison analysis, each probe pair on the treated GeneChip was compared to its corresponding probe pair on the control array. Moreover, the one-sided Wilcoxon’s signed rank test was used to discover the “changep-value”, which represented an “increase”, “decrease” or “no change” in gene expression (Microarray Suite (MAS) version 5.0, Affymetrix, CA, USA). The degree of alteration in gene expression was evaluated by the signal log ratio using the one step Turkey’s Biweight method by taking a mean of the log (base 2) ratios of the probe pair intensity across the two GeneChips. Following the above algorithms, the level of gene expression in the present study was regarded as a significant increase when its changep-value was less than 0.002 5 and as a significant decrease when its changep-value was greater than 0.997 5. A change inp-value between 0.002 5 and 0.997 5 indicated no significant gene expression alteration. The gene expression fold change was calculated by “fold change=2 (signal log ratio)” and a two-fold cut-off for significance was applied to the present GeneChip analysis. This statistical analysis method was commonly used in other studies[7,9].
2 Results and Discussion
The Rat Genome 230 2.0 array includes 31 042 gene probes made of 25-mer single strand oligonucleotides. Four chips were generated in this study including duplicate DMSO controls and duplicate M2 exposures (30 μmol/L). Over 200 genes were found to be significantly altered (p<0.002 5) by at least two-fold after M2 treatment (see Tab.1). C1-1 and C1-2 represent control sample 1 and control sample 2, respectively, while M2-1 and M2-2 represent M2 treated sample 1 and M2 treated sample 2, respectively. Regular numbers represent up-regulated genes. Bold numbers represent down-regulated genes.

Tab.1 Number of significantly altered genes (p<0.002 5)
When a gene tree analysis was used to create several clusters among all samples, the M2 treated ones exhibited a profile different from the control ones. Moreover, the similarity within the two controls and the two exposures was clearly indicated by nodes automatically (see Fig.1). Samples with a similar banding pattern showed similar gene expression patterns. The dendrogram linked samples were based on gene expression patterns. The scale represents the intensity of expression of a particular gene in a sample relative to the mean expression value of all samples. 1.0 indicates little or no change, and expressions over 1.0 and below 1.0 denote increase and decrease, respectively.

Fig.1 Gene tree dendrogram comparison of duplicate samples (M2-1, M2-2) exposed to M2 and duplicate control samples (C1-1, C1-2) in H4IIE cell line
Among all the altered genes, five of them were found to be consistent when induced in all the four possible control/exposure comparisons, while 33 genes were significantly decreased in the four comparisons. In these 38 consistently altered genes, only one in the suppressed group has its gene title and annotation. Others are all expressed as sequence tags (ESTs). Meanwhile, 10 annotated genes were listed in the significantly induced (p<0.002 5) group, if at least one two-fold-change (signal log ratio≥1) had been observed in the four comparisons (see Tab.2). 82 annotated genes were significantly suppressed (p>0.997 5) in at least one two-fold-change (signal log ratio≤-1). Among them, the genes suppressed in three or more comparisons were tabulated in Tab.3.
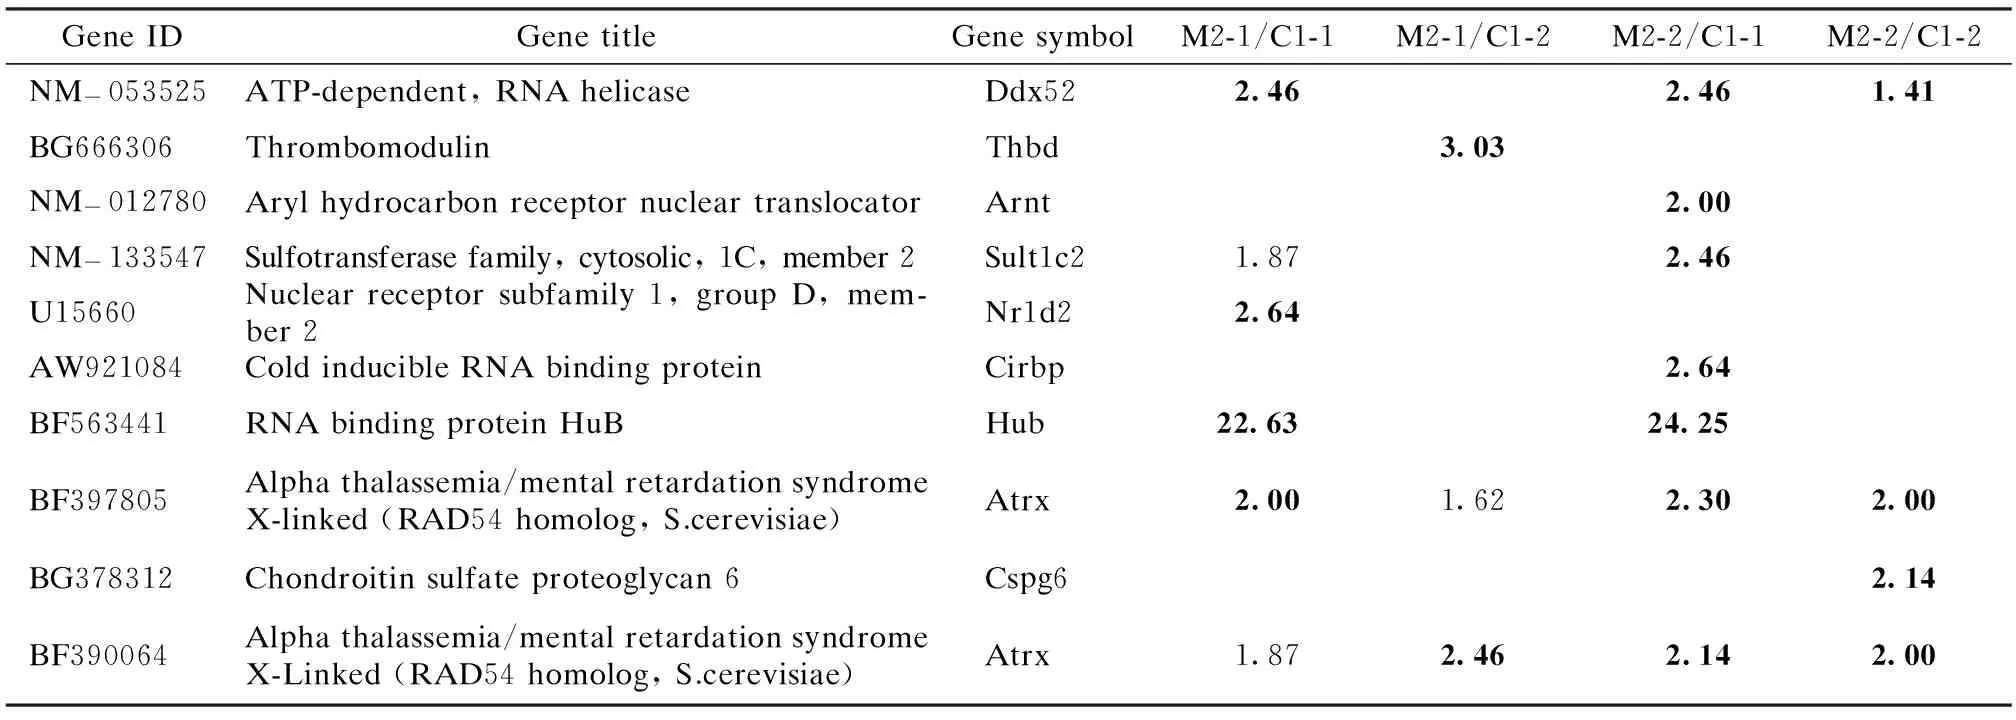
Tab.2 List of genes induced significantly (p<0.002 5) by M2 in at least one control/exposure comparison
Note: The bold values indicate significant fold-change (signal log ratio≥1).

Tab.3 List of genes decreased significantly (p>0.997 5) by M2 in at least three control/exposure comparison
Note: The bold values indicate significant fold-change (signal log ratio≤-1).
The gene ontology (GO) consortium developed a controlled vocabulary that describes the biological processes, molecular functions, and cellular components associated with a particular gene product, and so acts as a repository of the known functional biological information for each gene[15]. Based on the gene ontology vocabulary, 9 in the 10 induced genes and 62 in the 82 suppressed genes had defined annotations. These two groups of genes can be divided into several selectively functional categories according to the annotation information. Genes which did not fit into the selected categories were classified as the others (see Tabs.4 to 7). The 10 induced genes were found to be involved in 13 biological processes, 8 cellular components and 12 molecular functions. Two or more genes were involved in the regulation of transcription, DNA repair, signal transduction (biological process); nucleus, cytoplasm (cellular component); helicase activity, DNA/RNA/protein binding, transcription factor activity and receptor activity (molecular function). The larger group of genes suppressed were involved in metabolism/biosythesis/catabolism, transport and G-protein coupled receptor protein signaling pathway (biological process), membrane especially to integral to membrane and extracellular (cellular components), receptor activity especially G-protein coupled receptor activity (rhodopsin-like receptor activity), DNA/protein/ion binding, and catalytic(hydrolase)/transporter/growth factor/oxidoreductase/ion channel activity (molecular function). Several genes in the down-regulation group also played roles in apoptosis, cell adhesion/cycle/proliferation, intracellular signaling cascade, signal transduction, regulation of transcription and synapsis (biological process), nucleus, kinesin complex, endoplasmic reticulum, microsome, Golgi apparatus, cytosol (cellular component), phospholipid binding, hormone/transferase/protein kinase, and ligase activity (molecular function).
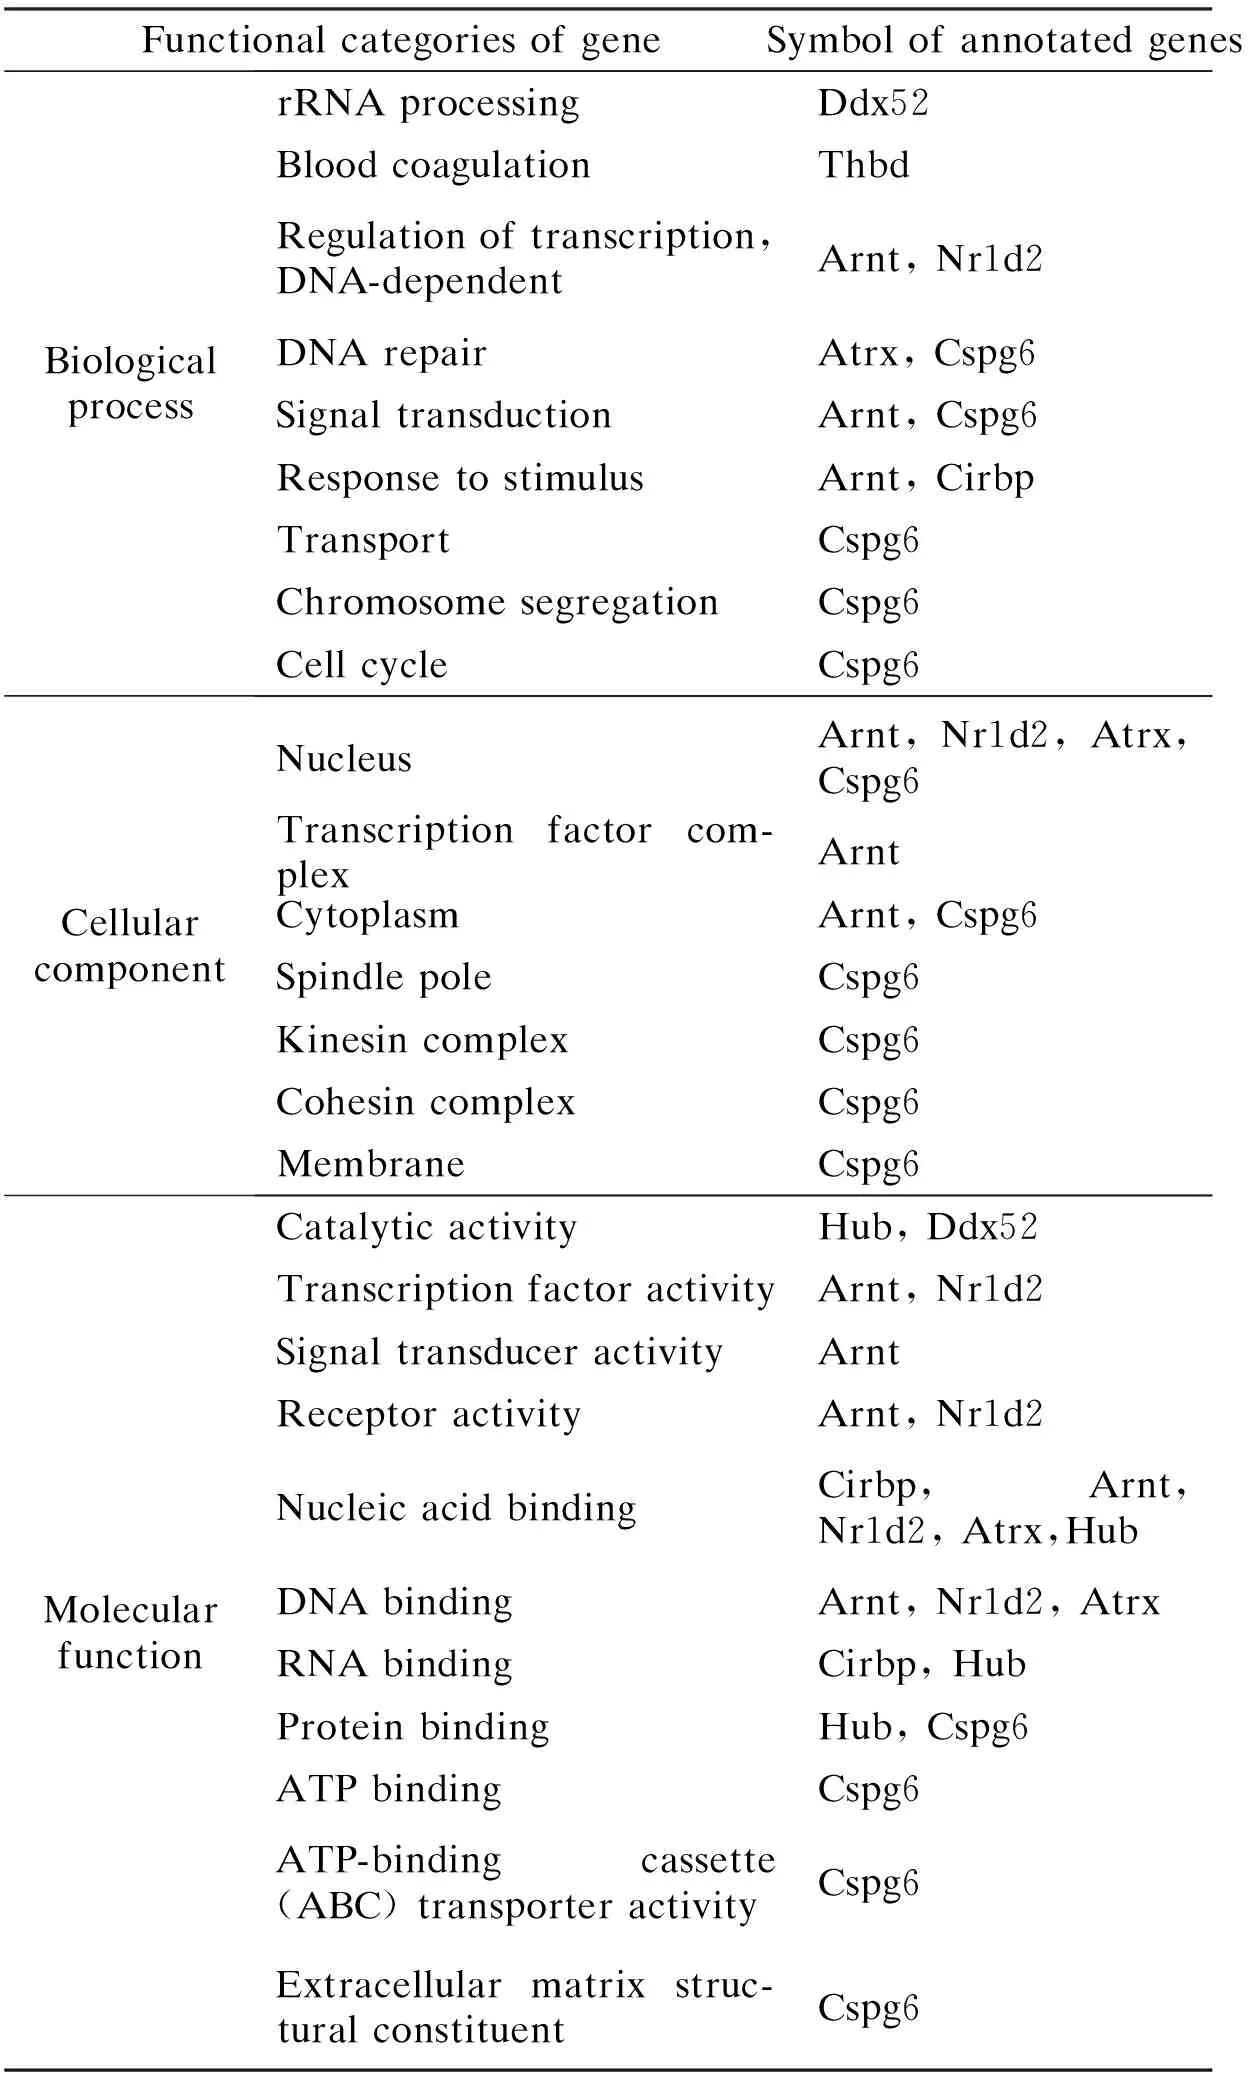
Tab.4 A summary of the functions of the 10 up-regulated genes by M2

Tab.5 A summary of the down-regulated genes relating to biological process functions
Pathway analysis was conducted by overlapping the genes with the known gene pathway maps in the GenMAPP organization and the Kyoto Encyclopedia of Genes and Genomes. The number of common genes with each pathway and the random overlapp-value of the gene list against pathways were obtained from the Genespring pathway analysis. GenMAPP pathways of the G-protein cou-pled receptor protein signaling pathway (GPCRs Class A Rhodopsin-like, Monoamine GPCRs and Small ligand GPCRs), fatty acid degradation (3 genes) appeared to be altered.
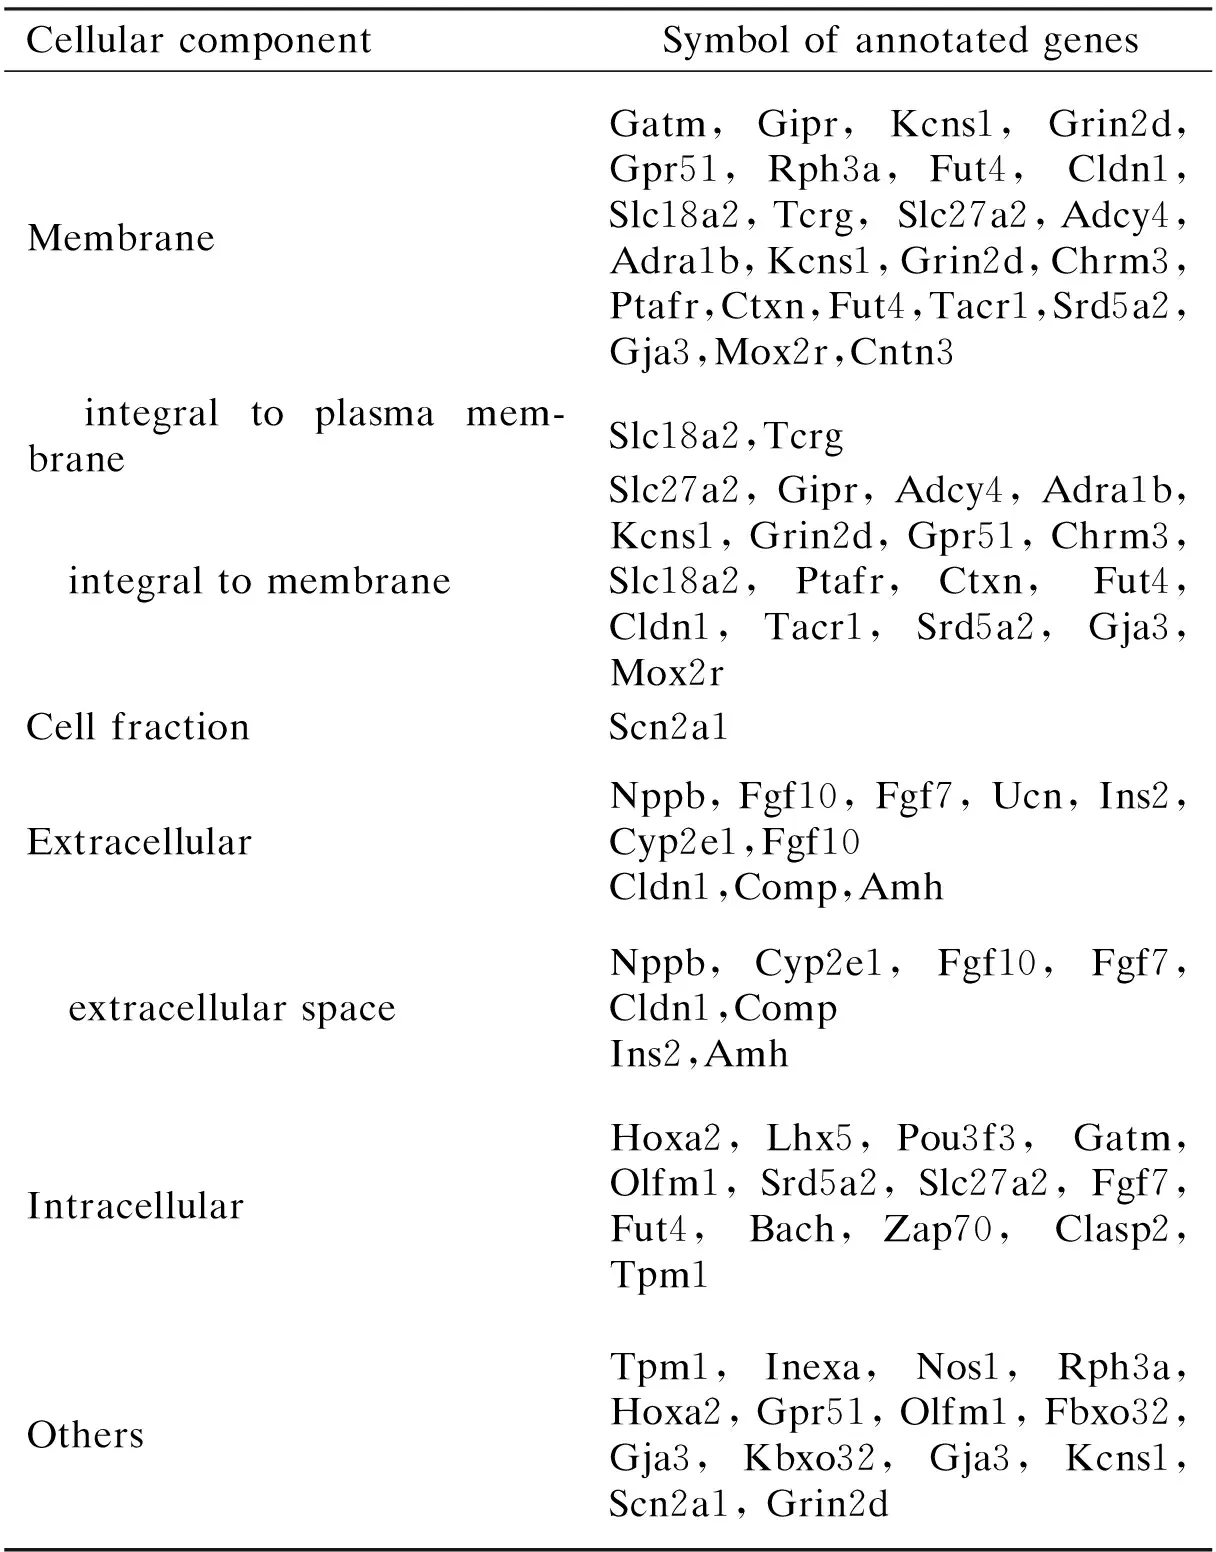
Tab.6 A summary of the down-regulated genes relating to cellular component functions

Tab.7 A summary of the down-regulated genes relating to molecular functions
The above results suggest that microassay is a useful tool to screen the toxicological effects of an absolutely unknown compound. However, the major challenge in the interpretation of toxicogenomic data was to define how chemically induced changes in gene expression were related to conventional toxicological endpoints[10]. Later, gene expression analysis was used to identify genes involved in specific biochemical pathways and allow classification of toxicants and provide further insights into mechanisms of action[7,9]. Despite that some mRNA changes cannot be translated to the corresponding changes in enzyme concentration or activity. The alteration of a group of genes involved in a particular biochemical pathway can provide strong evidence of the chemical effects.
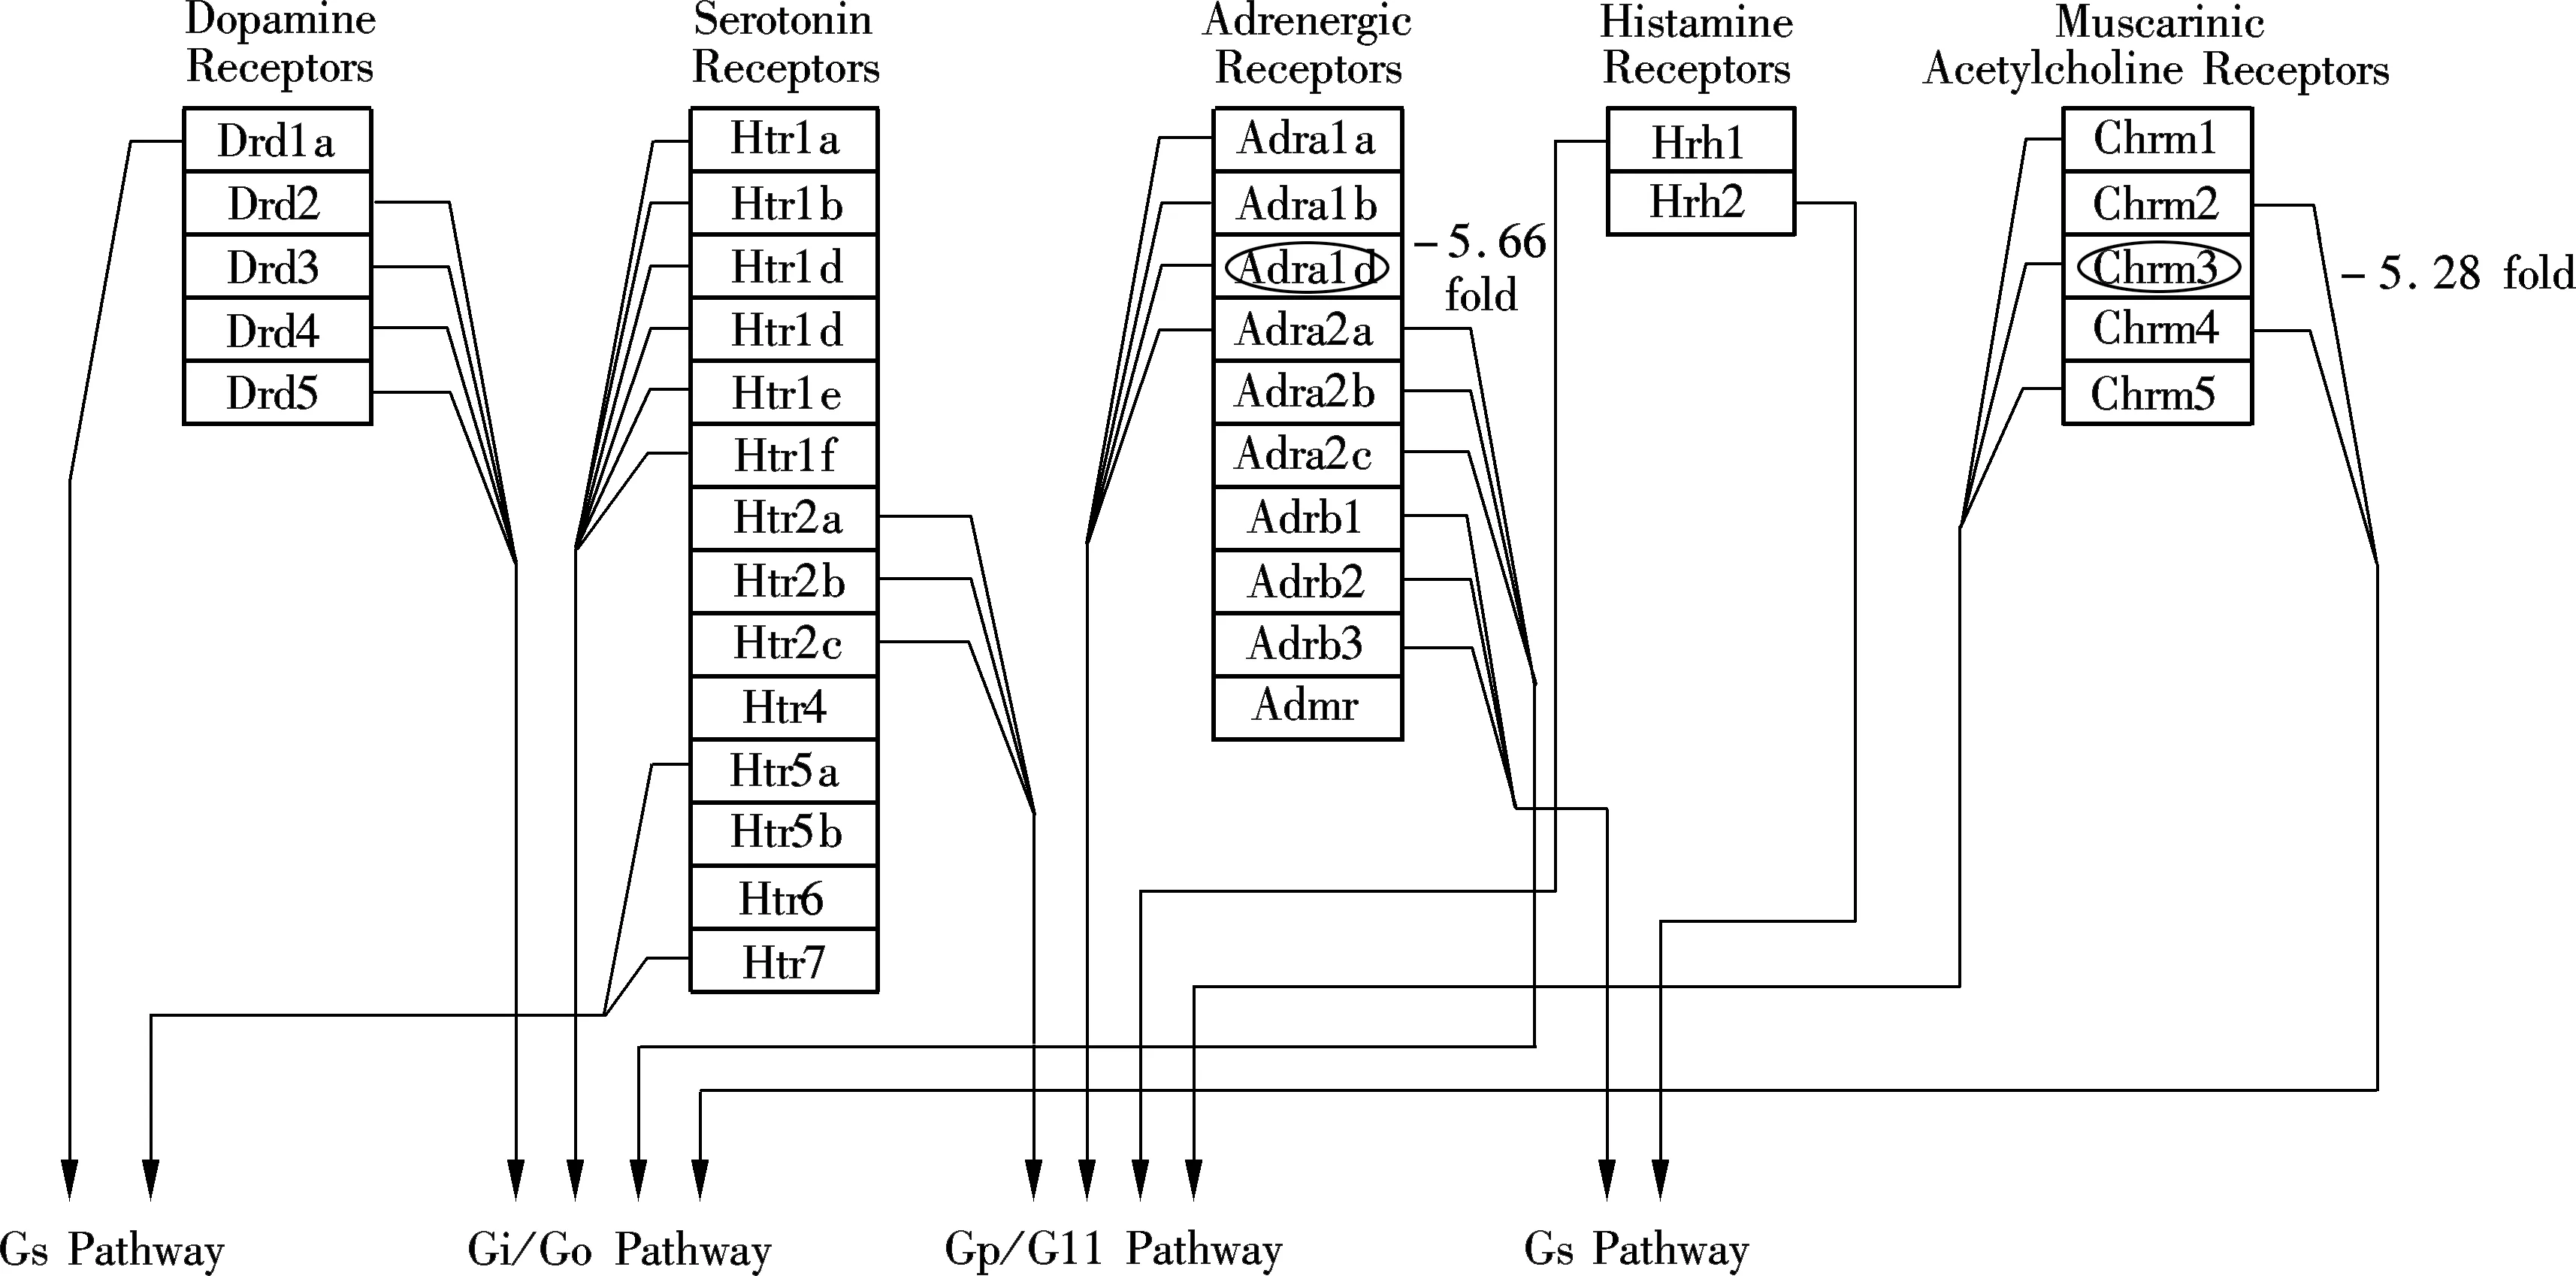
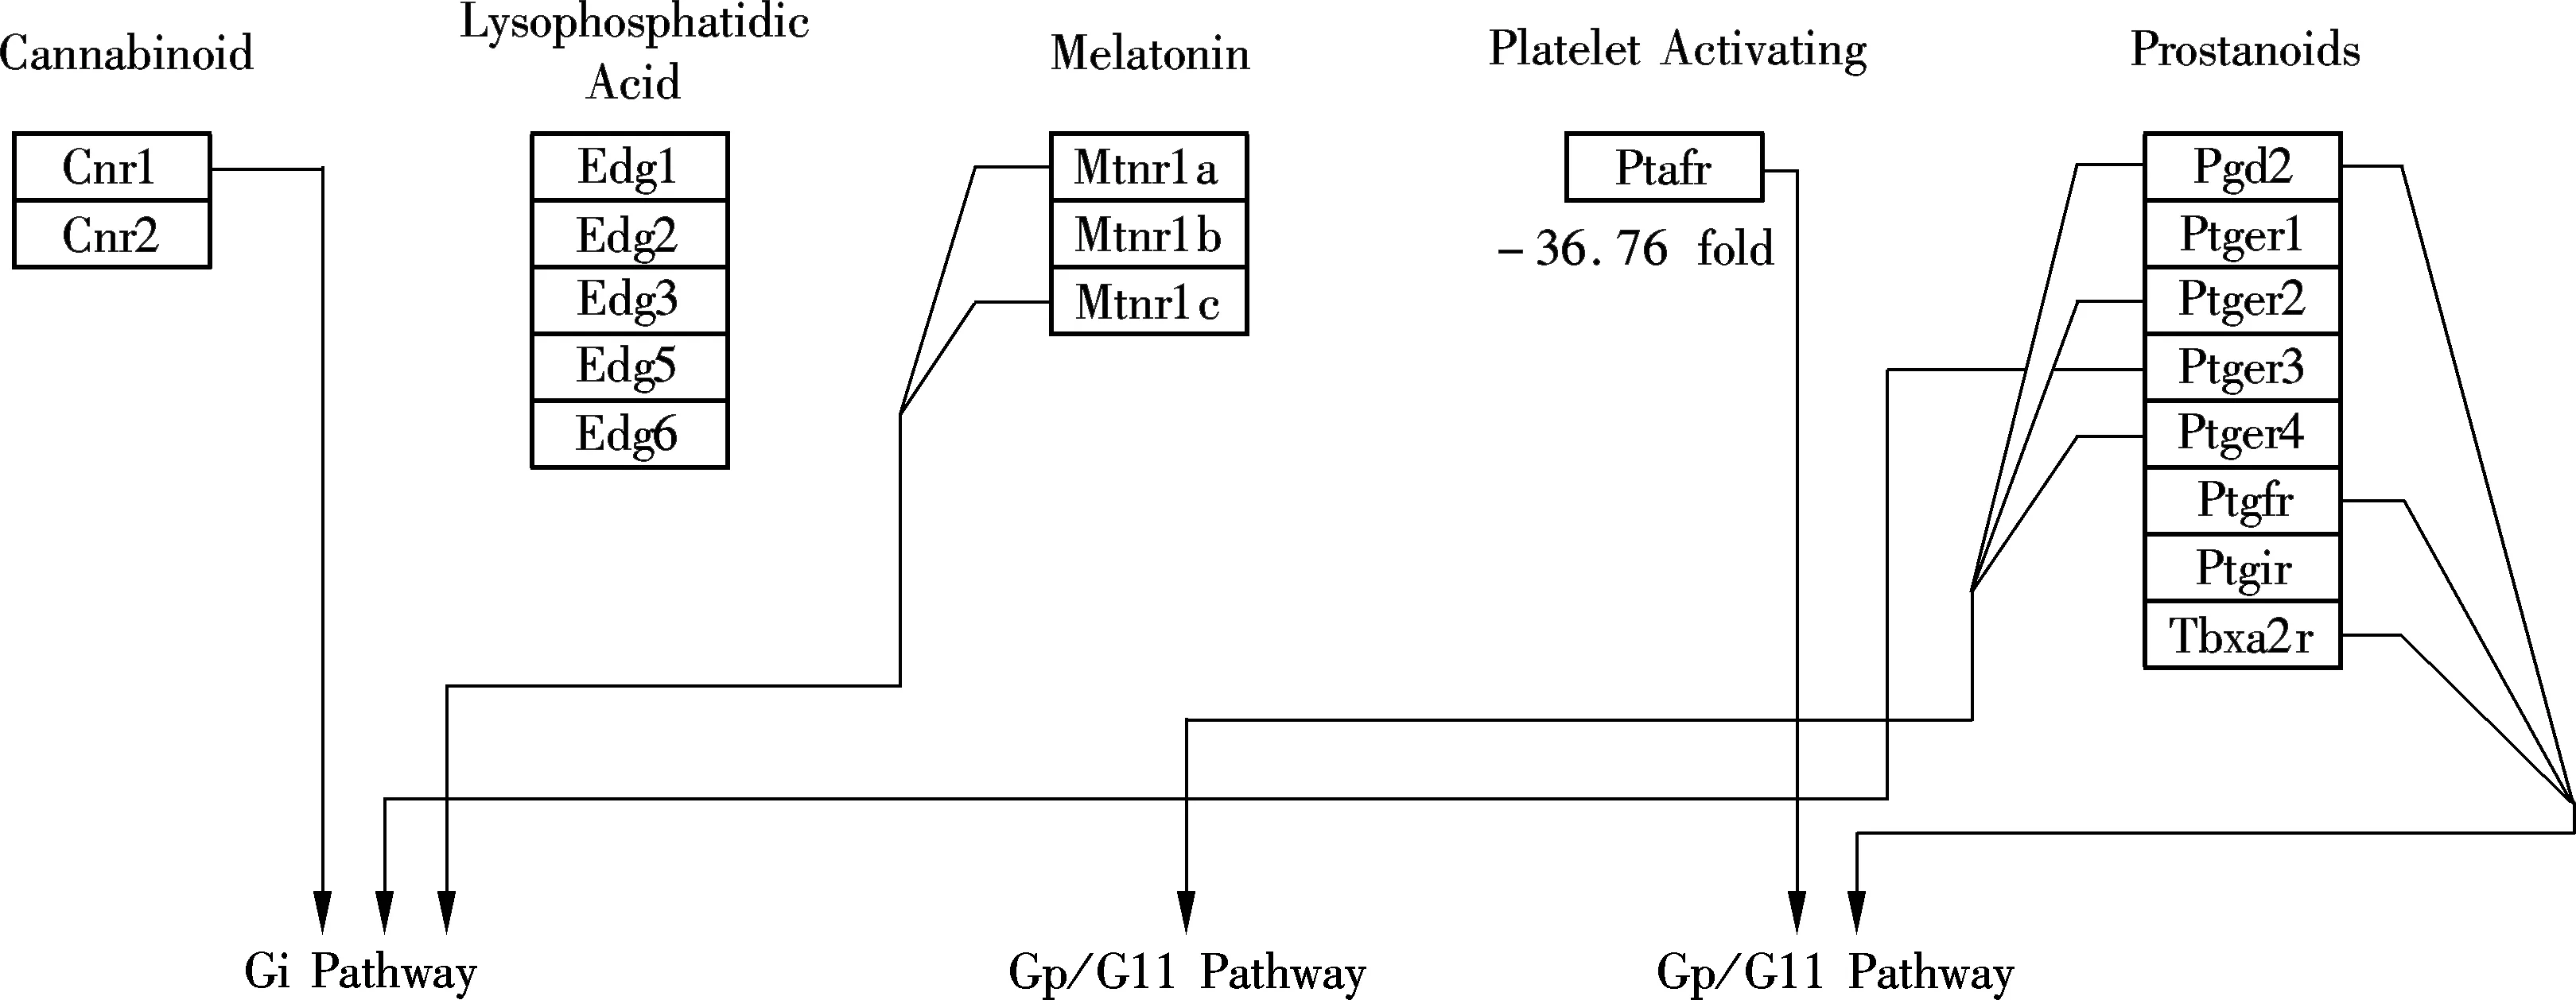
Of the total 30 000 functionally annotated genes and ESTs analyzed in the present microarray study, less than 1% responded to M2 with a greater than two-fold change in expression. Differences between control/exposure gene expression profiles were limited. The largest altered gene group (17 down-regulated genes) was found to relate to the integral to membrane (see Tab.5), which indicated that M2 may be incorporated into cell membranes and affect physical effects on membrane processes. For the down-regulated genes, pathway analysis revealed relatively M2-dependent transcriptional responses associated GPCRs Class A Rhodopsin-like, Monoamine GPCRs and Small ligand GPCRs (belonging to the G-protein coupled receptor protein signaling pathway) (see Fig.2, the altered genes were located with ellipse). Eight down-regulated genes are related to the G-protein coupled receptor protein signaling pathway (see Tabs.5, 6 and 7) in total, 1 759 G-protein coupled receptor protein signaling pathway related genes. The definition of this biological process includes a series of molecular signals generated as a consequence of a G-protein coupled receptor binding to its physiological ligand. Alteration of this pathway related gene expressions was also observed in other studies[7,11]. The suppression of G-protein associated signaling pathway genes such as Gipr may cause some diseases. For example, the decreased effectiveness of Glucose-dependent insulinotropic polypeptide (GIP) in the Vancouver diabetic fatty Zucker (VDF) rat and in type 2 diabetes was likely due to a decreased receptor (Gipr) expression in the islet[12]. G protein-coupled receptors (GPCRs) represent the most abundant drug targets. Research on the interaction of GPCRs with different molecules in the signal transduction pathways, and further studies on receptor dimerization, may lead to the discovery of new drugs[13].
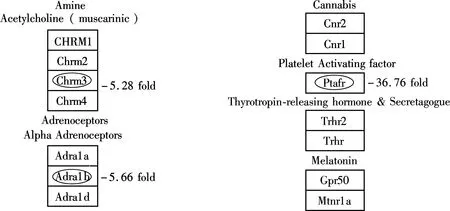
(a)
(b)
(c)
In the present study, Accn5 (amiloride-sensitive cation channel 5, intestinal) was the only annotated gene significantly down-regulated (-3.03- to -59.71-fold) among all the control/exposure comparison pairs (see Tab.3). The gene was found to express in the whole brain, liver, small intestine (duodenum, jejunum and ileum) and testis and its product belongs to the amiloride-sensitive Na+channel and degenerin family (NaC/DEG), an expanding family of cationic channels associated with a variety of functions in organisms[14]. Despite their functional diversity, all these channels show common properties, such as permeability to Na+, inhibition by the diuretic amiloride and voltage-independent gating[14]. Moreover, the NaC/DEG family contains constitutively active channels such as the epithelial Na+channel (ENaC)[15]. The biological process of Accn5 is believed to modulate ENaC, a rate-limiting step for Na+reabsorption across epithelial tissues to maintain the fluid and electrolyte homeostasis[15]. Therefore, the significant down-regulation of Accn5 was very likely to cause some alterations to the regulatory mechanisms of the amiloride-sensitive epithelial sodium channel (ENaC).
3 Conclusion
To summarize, M2 is not likely to be a serious genotoxic chemical. However, the potential gene risks relating to amiloride-sensitive epithelial sodium channel (ENaC) and some functions involving the nucleus (cellular component), G-protein coupled receptor protein signaling pathways (biological process) and integral to membrane (cellular component) are of concern.
[1]Lambert S J, Thomas K V, Davy A J. Assessment of the risk posed by the antifouling booster biocides Irgarol 1051 and diuron to freshwater macrophytes [J].Chemosphere, 2006, 63(5):734-43.
[2]Thomas K V. Environmental fate and behaviour of antifouling paint booster biocides: a review[J].Biofouling, 2001, 17(1): 73-86.
[3]Zhou J L. Occurrence and persistence of antifouling biocide Irgarol 1051 and its main metabolite in the coastal waters of Southern England[J].ScienceoftheTotalEnvironment, 2008, 406(1/2):239-246.
[4]Lam K H, Lam M H W, Lam P K S, et al. Identification and characterization of a new degradation product of Irgarol-1051 in mercuric chloride-catalyzed hydrolysis reaction and in coastal waters[J].MarinePollutionBulletin, 2004, 49(4): 361-367.
[5]Okamura H, Aoyama I, Takami T, et al. Phytotoxicity of the new antifouling compound Irgarol 1051 and major degradation product[J].MarinePollutionBulletin, 2000, 40(9): 754-763.
[6]Lam K H, Wai H Y, Leung K M Y, et al. A study of the partitioning behavior of Irgarol-1051 and its transformation products[J].Chemosphere, 2006, 64(7): 1177-1184.
[7]Hu W, Jones P D, Celius T, et al. Identification of genes responsive to PFOS using gene expression profiling[J].EnvironmentalToxicologyandPharmacology, 2005, 19(1):57-70.
[8]Ciba-Geigy. Irgarol 1051 in Antifouling paints[R]. Basle, Switzerland: Giba-Geigy Ltd, 1995.
[9]Yeung L W, Gurugea K S, Yamanaka N, et al. Differential expression of chicken hepatic genes responsive to PFOA and PFOS[J].Toxicology, 2007, 237(1/2/3):111-125.
[10]Heinloth A N, Irwin R D, Boorman G A, et al. Gene expression profiling of rat livers reveals indicators of potential adverse effects[J].ToxicologicalSciences, 2004, 80(1): 193-202.
[11]Guruge K S, Yeung L W, Yamanaka N, et al. Gene expression profiles in rat liver treated with perfluorooctanoic acid (PFOA)[J].ToxicologicalSciences, 2006, 89(1): 93-107.
[12]Lynn F C, Pamir N, Ng E H, et al. Defective glucose-dependent insulinotropic polypeptide receptor expression in diabetic fatty zucker rats[J].Diabetes, 2001, 50(5): 1004-1011.
[13]Heilker R, Wolff M, Tautermann C S, et al. G-protein-coupled receptor-focused drug discovery using a target class platform approach[J].DrugDiscoveryToday, 2009,14(5/6):231-240.
[14]Alvarez R D, Canessa C M, Fyfe G K, et al. Structure and regulation of amiloride-sensitive sodium channels[J].AnnualReviewofPhysiology. 2000, 62:573-94.
[15]Butterworth M B. Regulation of the epithelial sodium channel (ENaC) by membrane trafficking[J].BiochimicaetBiophysicaActa(BBA)-MolecularBasisofDisease, 2010, 1802(12):1166-1177.
防污损涂料添加剂Irgarol-1051降解产物对H4IIE鼠肝癌细胞的基因影响
许 妍1,2林家豪2林汉华2
(1东南大学土木工程学院, 南京 210096)(2香港城市大学生物与化学系,中国香港)
为研究海洋防污损涂料添加剂Irogarol-1051的降解产物M2的基因毒性,应用微阵列技术,选取Affymetrix公司鼠基因组230 2.0基因芯片检测30 μmol/L M2暴露下的鼠肝癌细胞基因表达变化.实验结果显示,96 h的M2暴露导致了38个基因在全部4组可能的对照/暴露中均发生显著变化(p<0.002 5),其中只有Accn5基因研究较为透彻,该基因表达的抑制可能影响上皮钠通道的功能.此外,分别有10和82个功能注释基因在至少一组对照/暴露组中上调和下调.M2诱导的基因主要和细胞核(细胞成分)相关.M2抑制的基因则主要影响生物过程中的G蛋白偶联信号通路功能和细胞成分中的细胞膜内整合功能.
Irgarol-1051;降解产物M2; 微阵列;基因表达;基因毒性
X55
Received 2014-04-22.
Biography:Xu Yan (1980—), female, doctor, lecturer, xuxucalmm@seu.edu.cn.
s:The Research Grants Council of Hong Kong SAR, China (No.CityU, 1445/05M), the National Natural Science Foundation of China (No.41301546).
:Xu Yan, Lam Ka-Ho, Lam Michael Hon-Wah.Gene expression profile in H4IIE rat hepatoma cells exposed to an antifouling booster biocide Irgarol-1051 degradation product[J].Journal of Southeast University (English Edition),2014,30(4):506-513.
10.3969/j.issn.1003-7985.2014.04.018
10.3969/j.issn.1003-7985.2014.04.018
 Journal of Southeast University(English Edition)2014年4期
- Journal of Southeast University(English Edition)的其它文章
- Simulation of urban affordable housing land-use evolution based on CA-MAS model
- Dynamical chiral symmetry breaking in QED3
- A decision model of optimal production reliability and warranty length in an imperfect production system
- Metal cation crosslinking of TiO2-alginate hybrid gels
- One-pot facile synthesis of highly photoluminescent graphene quantum dots with oxygen-rich groups
- Modeling household car ownership using ordered logistic regression model
