
Study on the Influence of Ni Modifying on Phase Transformation and Photocatalytic Activity of TiO2
2014-07-25 10:01WangYanZhangJingLiuShiyangYanSongWuWeichengXuQianLiCan
中国炼油与石油化工 2014年3期
Wang Yan; Zhang Jing; Liu Shiyang; Yan Song; Wu Weicheng; Xu Qian; Li Can
(1. Liaoning Shihua University, College of Chemistry, Chemical Engineering and Environmental Engineering, Fushun 113001; 2. Olefin Division of SINOPEC Tianjin Branch, Tianjin 300270; 3. Dalian Institute of Chemical Physics, Chinese Academy of Sciences, State Key Laboratory of Catalysis, Dalian 116023)
Study on the Influence of Ni Modifying on Phase Transformation and Photocatalytic Activity of TiO2
Wang Yan1; Zhang Jing1; Liu Shiyang2; Yan Song1; Wu Weicheng1; Xu Qian3; Li Can3
(1. Liaoning Shihua University, College of Chemistry, Chemical Engineering and Environmental Engineering, Fushun 113001; 2. Olefin Division of SINOPEC Tianjin Branch, Tianjin 300270; 3. Dalian Institute of Chemical Physics, Chinese Academy of Sciences, State Key Laboratory of Catalysis, Dalian 116023)
The Ni-modified TiO2was synthesized using two methods including co-precipitation (Ni doped TiO2, Ni-TiO2) and wet impregnation (Ni loaded TiO2, Ni/TiO2). The surface and bulk crystalline phases of Ni-modified TiO2were investigated by using X-ray diffractometry (XRD), UV Raman spectroscopy, TEM, and SEM. It is observed that Ni doping can promote the phase transition and grain size growth of TiO2. Moreover, the propagation of the rutile phase from the bulk into the surface region of TiO2is increased when the Ni doping amount reaches up to 3%. However, in Ni/TiO2, it is found out that the surface and bulk phase transformation of TiO2can be inhibited after impregnation of 1% of Ni on the TiO2. Compared with the co-precipitation method, Ni species may be more enriched in the surface of the Ni/TiO2sample upon adoption of the impregnation method, and the direct contact of anatase particles of TiO2is avoided. As a consequence, the phase transition in the surface and bulk region of TiO2can be effectively inhibited by Ni loading. Additionally, the activity of the photocatalytic degradation of RhB on the 3Ni-TiO2-600 ℃ sample is higher than that on the 3 Ni/TiO2-600 ℃ sample. The phase junction formed between anatase and rutile in the surface region of 3Ni-TiO2-600 ℃ may the main reason for its high photocatalytic activity.
TiO2; Ni modifying; wastewater treatment; UV Raman spectroscopy; phase transformation
1 Introduction
In petroleum and petrochemical industries, a petroleum refinery can be a large consumer of water and can generate significant volumes of wastewater. Wastewater from petroleum refinery has high concentration of aliphatic and aromatic hydrocarbons[1-2]. The traditional treatment of refinery wastewater is based on physicochemical and mechanical methods, followed by further biological treatment in the integrated activated sludge treatment unit. However, these traditional methods become inadequate because there are many non-biodegradable and highconcentration organic substances. The heterogeneous photocatalytic oxidation process using TiO2has emerged as a new route for the degradation of organic substances, which can produce less toxic substances[3-5].
The common crystallite phases of TiO2are anatase and rutile. TiO2exists in the anatase phase in a ground state and TiO2undergoes phase transition to rutile at a temperature well in excess of 600 ℃[6]. It is well known that the optical and electrical properties of anatase phase and rutile phase are different. As a result, the crystalline phase is vital for the performance of TiO2in many applications. Anatase has been found to be more efficient as photocatalyst than rutile[7]and pure rutile has been found to be rarely active for the photodegradation of organic species in aqueous solutions[8]. Therefore, control of the phase content of TiO2and transformation between these two phases are of great importance to control its properties.
Many researchers have attempted to understand and control the crystalline phase and phase transformation of. It is found out that the phase transition from anatase to rutile depends on many factors such as preparation technique, particle size, atmosphere, and dopants[10-11]. Among these methods, ion doping was widely used for modifying the crystallite phase in TiO2. Reidy,et al.[11]have reported the elevation of the phase transformationtemperature of TiO2with addition of dopants such as Si, Al, and Zr, while the temperature for the transformation of anatase to rutile decreases by addition of Co, Mn and V dopants. Gole,et al.[12]studied the effects of Ni doping on phase change of TiO2. It is found out that Ni doping may accelerate the transformation of TiO2from anatase phase to rutile phase at room temperature.
Although ion doping has been extensively investigated for tuning the phase of TiO2, the study on the influence of the ion doping on its surface crystalline phase is still rarely studied. Our previous results indicate that the UV Raman spectroscopy is more sensitive to the surface region of TiO2than XRD and the visible Raman spectroscopy because TiO2can strongly absorb UV light[13-14]. Moreover, the different phases in the surface region of TiO2make big difference in its photocatalytic performance[15]. Therefore, it is necessary to systematically investigate the influence of ion doping on the phase content and the phase transformation both in the surface and in the bulk region of TiO2.
In this study, we tried to investigate the effect of Ni modifying on the surface crystalline phase, bulk crystalline phase, and crystallite growth of TiO2. Two different methods including the co-precipitation and wet impregnation methods, were used to prepare the Ni doped TiO2(Ni-TiO2) and the Ni loaded TiO2(Ni/TiO2) samples. Furthermore, we preliminary discuss the mechanism of the effect of Ni modifying on the phase transformation of TiO2and the photocatalytic activity of TiO2for the above two preparation methods.
2 Experimental
2.1 Materials
Nickel nitrate, titanium (IV)n-butoxide, anhydrous ethanol, and ammonia solution were all of analytical reagent grade and were used without further purification.
2.2 Synthesis of Ni-modified TiO2
Ni-doped TiO2(Ni-TiO2) was prepared by the co-precipitation method. A variable amount of Ni(NO3)2·6H2O was dissolved in 40 mL of anhydrous ethanol. This solution was added slowly to a solution containing a mixture of 20 mL of titanium (IV)n-butoxide (Ti(OBu)4) and 100 mL of anhydrous ethanol. An ammonia solution was added to the mixture drop by drop under constant stirring until the pH of the solution reached 9.0. The resulting white precipitate was stirred for 24 h, it was then washed twice with deionized water and anhydrous ethanol and subsequently dried at 110 ℃ for 12 h to obtain the amorphous Ni-TiO2. For comparison with the Ni-TiO2sample, the amorphous TiO2was prepared via the same procedure without adding the Ni dopant. Amorphous TiO2and Ni-TiO2were then further calcined in air at 600 ℃ for 2 h. The TiO2samples containing 0.5%, 1%, and 3% of Ni, respectively, are denoted as 0.5Ni-TiO2-600 ℃, 1Ni-TiO2-600 ℃, and 3Ni-TiO2-600 ℃, respectively.
Ni-loaded TiO2(Ni/TiO2) was prepared by the wet impregnation method[13]. The above as-prepared amorphous TiO2was calcined at 500 ℃ (TiO2-500 ℃) prior to being used as a support for Ni/TiO2(500 ℃). The support was impregnated with a solution containing various concentrations of Ni(NO3)2·6H2O, and was then subsequently stirred in a hot water bath until it was dried. After the sample was kept at 110 ℃ overnight, these Ni/TiO2samples were also calcined at 600 ℃ in air for 2 h. The Ni/TiO2samples with 0.5%, 1%, and 3% of Ni were labeled as 0.5Ni/TiO2-600 ℃, 1Ni/TiO2-600 ℃, and 3Ni/TiO2-600 ℃, respectively.
2.3 Characterization
X-ray powder diffraction (XRD) patterns were obtained on a Rigaku MiniFlex diffractometer using Cu Kα radiation. Diffraction patterns were collected at scanning angle (2θ) ranging from 20° to 60° with a scanning speed of 5°/min. The relative weight fractions of rutile phase,WR, are calculated using the integrated intensity of the (101) peak of anatase and the (110) peak of rutile and the relationshipWR=1/[1+0.884(Aana/Arut)] as used by Gribb and Banfield[16]in samples. The UV Raman spectra were measured with a Jobin-Yvon T64000 triple-stage spectrograph with a spectral resolution of 2 cm-1. The 325 nm line of a He-Cd laser was used as an excited source with an output power of 25 mW. The spectra of all samples were recorded at room temperature. Transmission electron micrographs were taken on a JEOL 2000EX for estimating the particle size and morphology. The morphology of samples was also examined by scanning electron microscopy (SEM) taken with a Quanta 200 FEG scanning electron microscope.
2.4 Photocatalytic experiment
The RhB was used as the representative organic substance to evaluate the photoactivity of Ni-TiO2and Ni/TiO2samples. The detailed process was as follows: 50 mg of Ni-TiO2sample (or Ni/TiO2sample) was added to 60 mL of 20 mg/L RhB solution. The suspension was stirred in the dark for 30 min to obtain the adsorption-desorption equilibrium of dye before illumination. A 250-W high voltage mercury lamp (λ=365 nm, made by Shanghai Yaming Lighting Co.) was used as the light source. At a defined time interval, 3 mL of suspension was removed and immediately centrifuged. Then, the concentration of RhB was analyzed using the UV–vis spectrophotometer (22PC spectrophotometer, made by Shanghai Lengguang Technology Co., Ltd.).
3 Results and Discussion
3.1 The bulk and surface crystalline phase of Ni-TiO2-600℃
In this work, the surface crystalline phases of Ni-TiO2and Ni/TiO2were characterized by UV Raman spectroscopy, while XRD was used to characterize their bulk crystalline phases[13]. Figure 1a shows the XRD patterns of Ni-TiO2-600 ℃ samples. When the TiO2sample was calcined at 600 ℃ (TiO2-600 ℃), clear and strong peaks assigned to anatase phase at 2θ=25.5°, 37.9°, 48.2°, 53.8° and 55.0° were observed. These peaks represented the indices of (101), (004), (200), (105), and (211) planes of anatase phase[17], respectively. In addition, some weak peaks were also observed at 2θ= 27.6°, 36.1°, 41.2° and 54.3°, corresponding to the indices of (110), (101), (111), and (211) planes of rutile phase[17], respectively. These results indicate that the bulk region in TiO2-600 ℃ samples is dominated by the anatase phase along with some rutile phase, and the bulk rutile mass fraction is 8.3%.
With respect to the 0.5Ni-TiO2-600 ℃ sample, the diffraction peaks of rutile phase increased in intensity, and the bulk rutile content was increased to 16.8%. The diffraction peaks of anatase phase gradually diminished in intensity and the diffraction patterns of rutile phase became predominant with an increasing Ni content. When the Ni amount reached up to 3%, the bulk rutile content increased to 56.4%. These results clearly show that the phase transformation in the bulk region of TiO2is promoted after doping Ni into TiO2. Other researchers[12,18]found the similar results showing that Ni doping accelerates the anatase-to-rutile transformation. Additionally, there are no detectable diffraction peaks of Ni or its oxides evinced by the XRD patterns. This may be ascribed to the low concentration of dopant and the fraction of Ni or its oxides which are probably too low to be detected by XRD.
UV Raman spectroscopy was used to study the surface crystalline phase of TiO2and Ni-TiO2samples. Figure 1b shows the Raman scattering spectra. The anatase phase of TiO2has six Raman active modes, while the rutile phase of TiO2has four active modes. Only typical bands (144 cm-1, 395 cm-1, 515 cm-1and 635 cm-1) relating to anatase phase are observed in the TiO2-600 ℃ sample. These bands can be attributed to the four Raman-active modes of anatase phase with the symmetries of Eg, B1g, A1g, and Eg, respectively[19]. This result shows that the surface region of TiO2-600 ℃ sample is dominated by the anatase phase. Upon combining the results of XRD analysis and UV Raman spectra, we conclude that the bulk region of TiO2-600 ℃ is mainly composed of anatase phase with small amounts of rutile (8.3%) (Figure 1a), while its surface region is dominated by the anatase phase (Figure 1b).
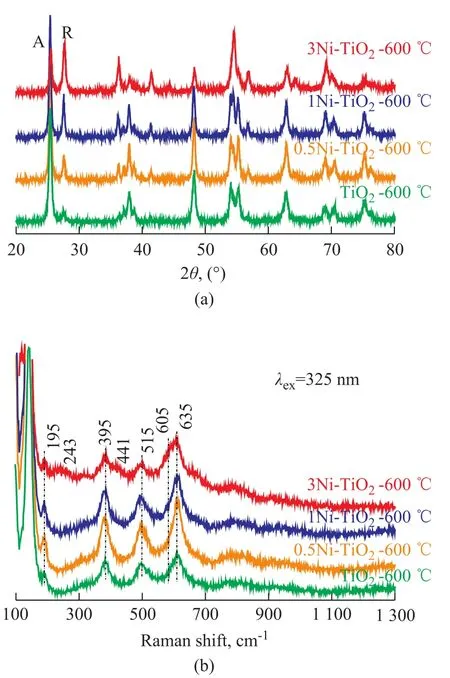
Figure 1 XRD patterns (a) and UV Raman spectra (b) of Ni-TiO2-600℃ samples
The anatase phase is the only crystalline phase observed in the surface region of the 0.5Ni-TiO2-600 ℃ and 1Ni-TiO2-600 ℃ samples. However, the XRD results (Figure 1a) show that the mixed phases of anatase and rutile are observed in the bulk region in 0.5Ni-TiO2-600 ℃ and 1Ni-TiO2-600 ℃ samples. It is obvious that there are different results between XRD and UV Raman spectra for Ni-TiO2samples. The disagreement between UV Raman spectra and XRD patterns suggest that the crystal phase in the surface region is different from that in the bulk during the phase transformation of Ni-TiO2, which is similar to that of the undoped TiO2[13]. The weak Raman bands assigned to rutile phase (243 cm-1, 441 cm-1and 605 cm-1) were observed only when the Ni content was increased to 3%, i.e., the surface rutile phase in Ni-TiO2sample was formed when the Ni content reached up to 3%.
3.2 The bulk and surface crystalline phase of Ni/TiO2-600℃sample
The XRD patterns of Ni/TiO2-600 ℃ samples are shown in Figure 2a. It is obvious that the bulk region of TiO2-500 ℃support is composed of the anatase phase. With regard to the 0.5Ni/TiO2-600 ℃ sample, the weak peaks assigned to rutile phase were also observed in addition to the strong peaks assigned to anatase phase in Figure 2a. The bulk rutile content in the 0.5Ni/TiO2-600 ℃ sample was 10.5%, and the bulk rutile content of the 1Ni/TiO2-600 ℃sample decreased to 8.4%, which was similar to the bulk rutile content of TiO2-600 ℃ (8.3%). When the Ni loading increased to 3%, the bulk rutile content was decreased to 4.3%. Thus, it can be concluded that Ni retards the phase transformation in the bulk region of the 3Ni/TiO2-600 ℃sample. This result shows that the effect of Ni on the phase transformation of TiO2is different when the co-precipitation method and impregnation method are adopted.
As revealed by the UV Raman spectra of the TiO2-500 ℃support and the Ni/TiO2-600 ℃ samples (Figure 2b), the surface region of the TiO2-500 ℃ support is composed of the anatase phase. Moreover, the surface region of Ni/TiO2-600 ℃ samples is composed of the anatase phase because only characteristic bands (143 cm-1, 235 cm-1, 445 cm-1and 612 cm-1) assigned to anatase phase are identified. Upon comparing Figure 2a with Figure 2b, different crystalline phases between surface and bulk region in Ni/TiO2are observed.

Figure 2 XRD patterns (a) and UV Raman spectra (b) of Ni/TiO2-600℃ samples
In addition, as compared with the undoped TiO2(TiO2-600 ℃), the characteristic bands of the anatase phase become broader for the Ni/TiO2-600 ℃ sample. The broadening of the diffraction peak may be mainly caused by the small crystallite size of the Ni/TiO2-600 ℃ sample[20](the effect of Ni on the particle size of TiO2will be discussed in the following section 3.3). The another possibility is that the structural disorder introduced by dopants may be responsible for the observed broadening of the Raman bands[21]. Thus, the UV Raman data, which provides an information on the surface region of TiO2, may suggest that the structural disorder is formed in the surface region of Ni/TiO2-600 ℃.
3.3 Morphology of Ni-TiO2and Ni/TiO2
Figure 3 show the TEM images of TiO2-600 ℃, 0.5Ni-TiO2-600 ℃, and 3Ni-TiO2-600 ℃. TiO2-600 ℃ and Ni-TiO2-600 ℃ samples displayed similar spherical form. On the other hand, remarkable agglomeration was observed for the TiO2-600 ℃ and Ni-TiO2-600 ℃ samples. This was caused by particles sintering and aggregation at hightemperature. It was observed that the crystallites of the Ni-doped TiO2were larger than those of the pure TiO2. Moreover, the crystallite size of Ni-TiO2-600 ℃samples increased with an increasing Ni content. Upon combining the results from Figure 1, Ni doping promoted both the TiO2anatase to rutile phase transformation and the grain growth. Surface morphology of TiO2-500 ℃ and Ni/TiO2-600 ℃ samples was studied as well using SEM micrographs. Figure 4 shows that the particle shape and the particle size of TiO2-500 ℃ and 3Ni/TiO2-600 ℃ samples do not show much difference. It is worth noting that Ni loading does inhibit the growth of primary particles of TiO2effectively.

Figure 3 TEM images of Ni-TiO2-600∶ (a) TiO2-600(b) 0.5Ni-TiO2-600(c) 3Ni-TiO2-600

Figure 4 SEM images of TiO2-500(a) and 3Ni/TiO2-600
3.4 A preliminary discussion on the mechanism of the phase transformation of Ni-modified TiO2
Figure 5 compares the bulk rutile content in the Ni-TiO2-600 ℃ and Ni/TiO2-600 ℃ samples. It is observed that the bulk rutile content increased with an increasing Ni doping amount when the co-precipitation method was used. Obviously, these results indicate that Ni doping promotes the phase transformation of TiO2from anatase to rutile. We have noted that the valance state between Ni2+and Ti4+is different, thus, substitution of Ti4+ions by Ni2+distorts the TiO2lattice and generates oxygen vacancies to maintain charge neutrality. The existence of oxygenvacancy drives the temperature of the phase transformation of TiO2to a lower value[22]. Moreover, the oxygen vacancies content may increase with an increasing Ni content. According to Rath’s results[22], the higher the oxygen vacancy content is, the lower the temperature for the transition from anatase phase to rutile phase would be. Therefore, increase in Ni doping amount could increase the fraction of rutile phase in Ni-TiO2-600 ℃. In addition, the mechanism of Ni doping for promoting the phase transformation of TiO2may originate from the similar ionic radius between Ni2+and Ti4+[23]and the linear chain of Ni atom[6].
Additionally, as discussed in 3.1, we have observed the phenomena showing that the crystalline phase in the bulk region is different from that in the surface region of the Ni-TiO2-600 ℃ samples during the phase transformation. According to our previous work, the mechanism of phase transition is a nucleation and growth process. It was found out that the rutile phase nucleates in the bulk region of the agglomerated TiO2particles and then develops toward the surface region of the agglomerated TiO2particles. The rutile phase, which is formed in the bulk region of TiO2, needs high temperature or enough time to propagate into the surface region of TiO2. Our results indicate that Ni doping significantly promotes the transformation of the bulk phase from anatase to rutile. However, the propagation of the rutile phase from the bulk region to surface region may not be effectively accelerated when the Ni content is low. Therefore, the bulk region of 0.5Ni-TiO2-600 ℃ (or 1Ni-TiO2-600 ℃) is composed of the mixed phases of anatase and rutile, while its surface region is composed of the anatase phase. When the Ni doping amount reaches up to 3%, Ni can effectively promote the propagation of the rutile phase from the bulk region into surface region. Therefore, the surface rutile phase can be observed in the 3Ni-TiO2-600 ℃ sample.
As shown in Figure 5, the bulk rutile content of the 0.5Ni/TiO2-600 ℃ sample is almost the same as that of TiO2-600 ℃, and then a further increase of Ni content can lead to a decrease in the bulk rutile phase. It is worth noting that the phase transformation of TiO2was retarded when the amount of Ni loading was increased to 1% upon adoption of the impregnation method. We can conclude from the above-mentioned results that the phase transformation of TiO2can be effectively inhibited in the Ni/TiO2sample. However, the phase transformation of TiO2is promoted by Ni in the Ni-TiO2sample.
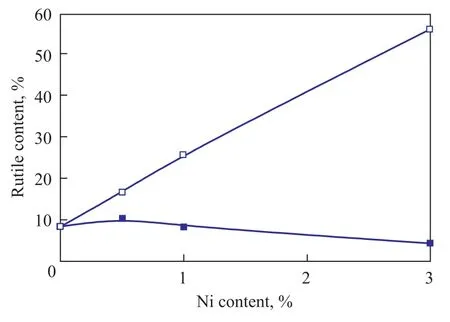
Figure 5 The rutile content in the bulk region of the Ni-TiO-600and Ni/TiO-600with different Ni contents22
As already mentioned above, the UV Raman results (Figure 2b) indicate that a structural disorder may form in the surface region of the Ni/TiO2-600 ℃ sample. Thus, compared with the co-precipitation method, Ni species could be more enriched on the surface of TiO2when the impregnation method is adopted. The Ni species on the surface of TiO2in Ni/TiO2sample may effectively avoid the contact between anatase particles. Therefore, the nucleation of the rutile phase, which occurs at the interface between the anatase particles, could be inhibited. However, the contact between the anatase particles may not be avoided when the amount of Ni2+is low (0.5%), thus the 0.5Ni/TiO2-600 ℃ sample shows the similar bulk rutile content as the TiO2-600 ℃ support. Further work is in progress to study the mechanism of inhibition (or promotion) of the phase transition of TiO2in Ni/TiO2-600 ℃ (or Ni-TiO2-600 ℃) by Ni species.
3.5 Photocatalytic performance
Figure 6 compares the photocatalytic degradation of RhB on the 3Ni-TiO2-600 ℃ and the 3Ni/TiO2-600 ℃samples. The degradation of RhB could be described by a first-order kinetic equation of -ln(Ct/C0) versus reaction time (t):

wherekappis the apparent reaction rate constant, andC0andCtare the initial concentration and the concentrationof RhB at the reaction timet, respectively. In the photodegradation studies of Rhodamine B (Figure 6), the 3Ni-TiO2-600 ℃ sample shows higher photocatalytic activity than the 3Ni/TiO2-600 ℃ sample.

Figure 6 The photocatalytic activity of degradation of Rhodamine B on the 3Ni-TiO2-600and 3Ni/TiO2-600samples
It can be seen from the UV Raman results (Figure 1 and Figure 2) that the surface region of the 3Ni-TiO2-600 ℃sample is composed of the mixed phases of anatase and rutile, while the 3Ni/TiO2-600 ℃ sample shows the anatase phase in the surface. These results may suggest the existence of a phase junction between surface anatase and rutile phase in the 3Ni-TiO2-600 ℃ sample. Our previous results indicate that the phase junction between anatase and rutile in the surface region favors the photo-induced charge separation[15], and then improves the rate of photocatalytic degradation of RhB. This result shows that the surface crystalline phase of TiO2can be tuned by Ni species, and the TiO2species with different surface phases display the different activities of photodegradation of organic pollutants. The 3Ni-TiO2-600 ℃ sample with mixed phases of anatase and rutile shows higher photocatalytic activity than the 3Ni/TiO2-600 ℃ sample composed of the surface anatase phase.
4 Conclusions
The effect of Ni doping (Ni-TiO2) or Ni loading (Ni/TiO2) on the bulk crystalline phase, surface crystalline phase, and the phase transformation of TiO2was investigated by XRD, UV Raman spectroscopy, TEM, and SEM. The TiO2, Ni-TiO2, and Ni/TiO2particles show the similar morphology. The influence of Ni species on the phase transformation of TiO2from anatase to rutile is different depending on different preparation methods. When the co-precipitation method was adopted, the crystallites of the Ni-doped TiO2were larger than those of the pure TiO2because Ni doping promoted the phase transformation. However, Ni species prevented the phase transformation of TiO2and inhibited the growth of primary particles effectively when the impregnation method was used. Additionally, the UV Raman spectra and XRD patterns suggest that the crystal phase in the surface region is different from that in the bulk during the phase transformation of Ni-TiO2or Ni/TiO2, which is similar to the case of the undoped TiO2. In addition, the photocatalytic experiment on degradation of RhB shows that Ni-TiO2with mixed phases of anatase and rutile shows higher photocatalytic activity than Ni/TiO2composed of surface anatase phase.
Acknowledgements:This project is financially supported by the National Natural Science Foundation of China (No. 20903054) and is also sponsored by the Scientific Research Foundation for the Returned Overseas Chinese Scholars, State Education Ministry (The project is sponsored by SRF for ROCS, SEM).
[1] Muftah H E-N, Manal A A, Sulaiman A-Z. Evaluation of a three-step process for the treatment of petroleum refinery wastewater [J]. Journal of Environmental Chemical Engineering, 2014, 2: 56-62
[2] WBG (World Bank Group), Pollution Prevention and Abatement Handbook: Toward Cleaner Production [M]. Washington, D. C., USA, 1999
[3] Oller I, Gernjak W, Maldonado M I. Solar photocatalytic degradation of some hazardous water-soluble pesticides at pilot-plant scale [J]. Journal of Hazardous Materials, 2006, 138: 507-517
[4] Chin S, Park E, Kim M. Photocatalytic degradation of methylene blue with TiO2nanoparticles prepared by a thermal decomposition process [J]. Powder Technology, 2010, 201: 171-176
[5] Shahrezaei F, Mansouri Y, Zinatizadeh A A L. Process modeling and kinetic evaluation of petroleum refinery wastewater treatment in a photocatalytic reactor using TiO2nanoparticles [J]. Powder Technology, 2012, 221: 203-212
[6] Li S, Jena P. Origin of the anatase to rutile conversion of metal-doped TiO2[J]. Physical Review B, 2009, 79:201204-1201204-4
[7] Ding Z, Lu G Q, Greenfield P F. Role of the crystallite phase of TiO2in heterogeneous photocatalysis for phenol oxidation in water [J]. Journal of Physical Chemistry B, 2000, 104: 4815-4820
[8] Sakatani Y, Grosso D, Nicole L, et al. Optimised photocatalytic activity of grid-like mesoporous TiO2films: effect of crystallinity, pore size distribution, and pore accessibility [J]. Journal of Materials Chemistry, 2006, 16: 77-82
[9] Zhang L, Li X, Chang Z X. Preparation, characterization and photoactivity of hollowN, Co co-doped TiO2/SiO2microspheres [J]. Materials Science in Semiconductor Processing, 2011, 14: 52-57
[10] Zhang Y R , Li Q. Synthesis and characterization of Fedoped TiO2films by electrophoretic method and its photocatalytic activity toward methyl orange [J]. Solid State Science, 2013, 16: 16-20
[11] Reidy D J, Holmes J D , Morris M A. The critical size mechanism for the anatase to rutile transformation in TiO2and doped-TiO2[J]. Journal of the European Ceramic Society, 2006, 26: 1527-1534
[12] Gole J L, Sharka M P, Orest J G. Efficient room-temperature conversion of anatase to rutile TiO2induced by highspin ion doping [J]. Journal of Physical Chemistry C, 2008, 112: 1782-1788
[13] Zhang J, Li M J, Feng Z C. UV Raman Spectroscopic Study on TiO2. I. Phase transformation at the surface and in the bulk [J]. Journal of Physical Chemistry B, 2006, 110: 927-935
[14] Zhang J, Xu Q, Li M J. UV Raman Spectroscopic Study on TiO2. II. Effect of Nanoparticle Size on the Outer/Inner Phase Transformations [J]. Journal of Physical Chemistry C, 2009, 113: 1698-1704
[15] Zhang J, Xu Q, Feng Z. Importance of the relationship between surface phases and photocatalytic activity of TiO2[J]. Angewandte Chemie International Edition, 2008, 47: 1766-1769
[16] Gribb A A, Banfield J F. Particle size effects on transformation kinetics and phase stability in nanocrystalline TiO2[J]. American Mineralogist, 1997, 82: 717-728
[17] Chen X, Mao S S. Titanium dioxide nanomaterials: synthesis, properties, modifications, and applications [J]. Chemical Review, 2007, 107: 2891-2925
[18] Tian J J, Gao H P, Deng H M. Structural, magnetic and optical properties of Ni-doped TiO2thin films deposited on silicon (100) substrates by sol–gel process [J]. Journal of Alloys and Compounds, 2013, 581: 318-323
[19] Brojčin M G, Šćepanović M G, Dohčević-Mitrović Z D. Infrared study of laser synthesized anatase TiO2nanopowders[J]. Journal of Physics D: Applied Physics, 2005, 38: 1415-1420
[20] Jakovljevic J K, Radoicic M, Radetic T. Presence of room temperature ferromagnetism in Co2+doped TiO2nanoparticles synthesized through shape transformation [J]. Journal of Physical Chemistry C, 2009, 113(50): 21029-21033
[21] Choudhury B, Choudhury A. Oxygen vacancy and dopant concentration dependent magnetic properties of Mn doped TiO2nanoparticle [J]. Current Applied Physics, 2013, 13: 1025-1031
[22] Rath C, Mohanty P, Pandey A C. Oxygen vacancy induced structural phase transformation in TiO2nanoparticles [J]. Journal of Physics D: Applied Physics, 2009, 42: 205101-1205101-6
[23] Hwang D S, Lee N H, Lee D Y. Phase transition control of nanostructured TiO2powders with addition of various metal chlorides [J]. Smart Materials and Structures, 2006, 15(1): S74-S80
Received date: 2014-02-24; Accepted date: 2014-08-05.
Zhang Jing, E-mail: jingzhang_dicp@ live.cn.

- 中国炼油与石油化工的其它文章
- Preparation of Tungsten Film and Its Tribological Properties under Boundary Lubrication Conditions
- Preparation of Spherical MgCl2/SiO2/THF-Supported Late-Transition Metal Catalysts for Ethylene Polymerization
- Spray Characteristics Study of Combined Trapezoid Spray Tray
- Viscoelastic Characteristics of Asphalt Binders at Softening Point Temperature
- Solvothermal Synthesis of V2O3Catalysts for Oxidative Desulfurization of Dibenzothiophene
- Synergetic Effect of Y Zeolite and ZSM-5 Zeolite Ratios on Cracking, Oligomerization and Hydrogen Transfer Reactions