
Quantitative analysis of γ-oryzanol content in cold pressed rice bran oil by TLC-image analysis method
2014-03-23 07:31ApirakSakunpakJirapornchaiSuksaereeChaowalitMontonPathamapornPathompakKrisanaKraisintu
Apirak Sakunpak, Jirapornchai Suksaeree, Chaowalit Monton, Pathamaporn Pathompak, Krisana Kraisintu
1Faculty of Pharmacy, Rangsit University, Pathum Thani, 12000, Thailand
2Sino-Thai Traditional Medicine Research Center, Herbal Medicinal Products Research and Development Center (Cooperation between Rangsit University and Harbin Institute of Technology and Heilongjiang University of Chinese Medicine), Rangsit University, Pathum Thani, 12000, Thailand
3Faculty of Oriental Medicine, Rangsit University, Pathum Thani, 12000, Thailand
Quantitative analysis of γ-oryzanol content in cold pressed rice bran oil by TLC-image analysis method
Apirak Sakunpak1,2*, Jirapornchai Suksaeree1,2, Chaowalit Monton1,2, Pathamaporn Pathompak1,2, Krisana Kraisintu2,3
1Faculty of Pharmacy, Rangsit University, Pathum Thani, 12000, Thailand
2Sino-Thai Traditional Medicine Research Center, Herbal Medicinal Products Research and Development Center (Cooperation between Rangsit University and Harbin Institute of Technology and Heilongjiang University of Chinese Medicine), Rangsit University, Pathum Thani, 12000, Thailand
3Faculty of Oriental Medicine, Rangsit University, Pathum Thani, 12000, Thailand
PEER REVIEW
Peer reviewer
Associate Prof. Dr. Nijsiri Ruangrungsi, Faculty of Pharmaceutical Sciences, Chulalongkorn University, Bangkok 10330, Thailand.
Tel: +6681-9179541 (mobile)
E-mail: Nijsiri.R@chula.ac.th
Comments
The author attempts to used image analysis as a new method for determination the content of γ-oryzanol which is never been reported elsewhere. The result from this valuable research paper should be introduced to commercial section to use this method instead of the usual one.
Details on Page 123
Objective:To develop and validate an image analysis method for quantitative analysis of γ-oryzanol in cold pressed rice bran oil.
γ-Oryzanol, TLC-densitometric method, TLC-image analysis method, Rice bran oil, Quantitative analysis
1. Introduction
The people of Thailand have been using the brown outer layer of the rice kernel, known as rice bran, for generations. Rice bran is rich in oil and frequently sold as a dietary supplement. It is a plentiful source of many bioactive compounds, including γ-oryzanol, phytosterols, ferulic acid and phytic acid[1]. Previous reports have shown various biological actions of γ-oryzanol, including antiinflammatory, antioxidant and anti-tumor activities[2]. The reported values for γ-oryzanols range from 0.2% to 2.72%, depending on the method of extraction, rice variety, weather, and area of cultivation[3,4]. A simple, rapid and low-cost method for screening and quantitative analysis of γ-oryzanol in rice bran oil is important for consumers. Nowadays, several methods for quantitative determination of γ-oryzanolin rice bran oil and dietary supplements have been used, including high performance liquid chromatography and high performance thin layer chromatography[5]. Although, the crucial advantages of these methods are highly sensitive and specific, the analytical instruments are quite costly and expertise is usually required[6]. Recently, scanning densitometers have become commonly used for quantitation of thin layer chromatography (TLC), but the equipment does not cost less than that of high performance liquid chromatography. Commercial digital imaging and analyzing systems have developed software for quantitative analysis in gel electrophoresis, which also applies to the quantitation of TLC[7,8]. The cost is less than that of the TLC scanning densitometer, so a combination of TLC and image analysis software has been developed and applied for quantitative analysis. Thus, the aim of this study was to develop and validate this image analysis system for quantitative analysis of γ-oryzanol in cold pressed rice bran oil.
2. Materials and methods
2.1. Standards and samples
The solvents used for chromatography were hexane (analytical grade) and ethyl acetate (analytical grade), both obtained from Merck (Darmstadt, Germany). A standard of γ-oryzanol (analytical grade) was purchased from TCI, Tokyo, Japan. Rice bran samples were provided by a local milling company in Thailand. The rice bran samples were used from different Thai rice varieties (Hom-Pathum, Hom-Mali and Sang-Yot). The samples were passed though sieve number 20 and immediately extracted under cold press conditions.
2.2. Standard solutions
Standard γ-oryzanol stock solutions were prepared in ethyl acetate and subsequently diluted to obtain a series of the standard, ranging from 0.2 to 0.7 µg/mL to construct a calibration curve.
2.3. TLC-densitometric method
A TLC precoated silica gel 60 F254plate measuring 20×20 cm (Merck, Darmstadt, Germany) was used. Samples were applied with a 100 µL sample syringe using the Linomat V system (Camag, Muttenz, Switzerland). CAT 4 software and TLC scanner were used for sample application and quantitative evaluation. A total of 10 µL of sample solution was applied as 8 mm bands with a 15 mm distance between the bands. Chromatography was developed in a pre-saturated state for 30 min in a vertical twin trough glass chamber (Camag, Muttenz, Switzerland), using ethyl acetate and hexane (1:9 v/v) as mobile phases. After development, the plate was dried at room temperature for 10 min. γ-Oryzanol was quantified by direct densitometric scanning of a developed plate at 365 nm without derivatization.
2.4. TLC-image analysis method
TLC conditions for determination of γ-oryzanol content used are described as in section 2.3 above. After the TLC plate was developed in a twin trough glass chamber, the plate was dried at room temperature. A photo to document the TLC plate was taken with a TLC visualiser (Camag, Muttenz, Switzerland) at 366 nm. The image was saved in joint photographic experts group format. The image was opened with the Adobe Photoshop program, converting the digital color photo into black and white. It was then resized and cropped according to the plate dimension at 20×10 cm, and saved at a resolution of 50 pixels cm-1for image analysis of γ-oryzanol content with Image (National Institute of Mental Health, USA).
2.5. Method validation
Various amounts of the stock solution (0.2-0.7 µg/mL) were analyzed by TLC-densitometric method as described above, and calibration curves were made by plotting peak areas against concentration. The repeatability of the scanning method was tested by replicating the standard γ-oryzanol six times after application to a TLC plate; then the relative standard deviation percentage (% RSD) was calculated. The variability of the method was studied by analyzing aliquots of different concentrations of standard solutions of γ-oryzanol (200, 300 and 400 ng/spot) on the same day (intraday-precision) and on different days (interday-precision) and % RSD values were calculated. Accuracy was evaluated by means of recovery assays carried out by adding known amounts of the reference compounds to the sample solutions. Robustness of the methods was determined by small changes in the mobile phase proportions (hexane-ethyl acetate (9:1, v/v), (8:2, v/ v), (7:3, v/v)). Each experiment was performed in triplicate. In order to obtain estimates of LOD and LOQ, a series of concentrations of γ-oryzanol were spotted on TLC plates. LOD and LOQ were determined by considering the signal to noise ratio (S/N). LOD was considered as S/N 3:1, while LOQ was S/N 10:1.
2.6. Determination ofγ-oryzanol content in cold pressed rice bran oil
Twenty five milligrams of rice bran oil was dissolved with ethyl acetate and adjusted to 5 mL in a volumetric flask. A 10 µL of each sample was spotted onto TLC plates and analyzed by the methods described in section 2.3 and 2.4. The content of γ-oryzanol in the rice bran oil was analyzed by the TLC-image analysis and TLC-densitometry. Each sample was analyzed in triplicate.
2.7. Statistical analysis
Values were expressed as a mean±SD. The statisticalsignificance was calculated by pairedt-test (P<0.05).
3. Results
3.1. Method optimization and method validations
The chromatographic condition for determination γ-oryzanol in rice bran oil was achieved on a TLC precoated silica gel 60 F254plate, with a mixture of ethyl acetate and hexane (1:9) as the mobile phase. After the TLC plate was developed, the presence of γ-oryzanol peak was clearly observed by TLC-densitometric and TLC-image analysis methods in the TLC chromatograms of rice bran oil samples with aRfvalue of 0.15 (Figures 1 and 2). A multiple wavelength detector was used to produce UV absorption spectra to identity the bands of γ-oryzanol in rice bran oil, which were in good agreement with the spectrum of pure γ-oryzanol (Figure 3).
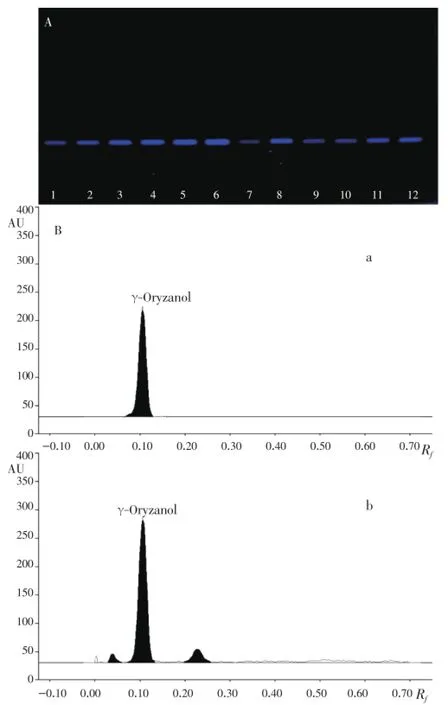
Figure 1. A: TLC photo-documentation at 366 nm (tracks 1-6 were standard γ-oryzanol of 200 to 600 ng/spot; tracks 7-8 Hom-Pathum rice bran oil; tracks 9-10 Sang-Yot rice bran oil; tracks 11-12 Hom-Mali rice bran oil); B: TLC-chromatograms, of standard γ-oryzanol (a) and cold pressed rice bran oil (b) by TLC-densitometric method.

Figure 2. TLC-chromatograms obtained by ImageJ software. A: Standard γ-oryzanol; B: Cold pressed rice bran oil sample.
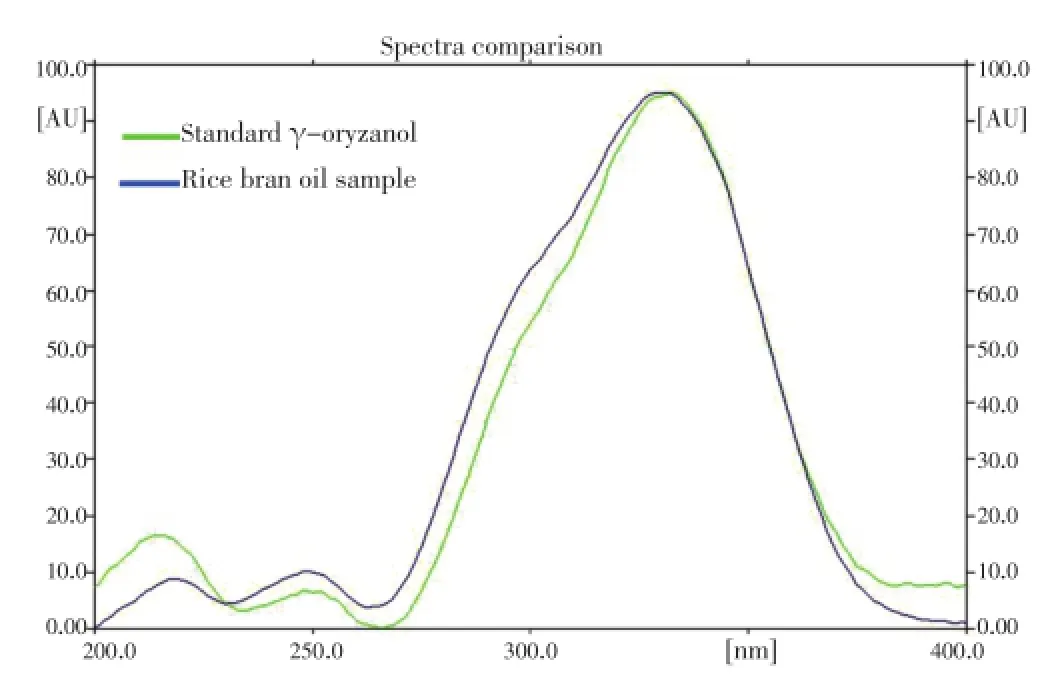
Figure 3. UV spectra of standard γ-oryzanol overlayed with γ-oryzanol in cold pressed rice bran oil sample (maximum absorption at 365 nm).
The calibration curves of TLC-densitometric and TLC-image analysis methods were found to be a straight line, and the polynomial regression data showed good linear relationship over the concentration range of 200 to 600 ng/ spot from both methods. The regression equations wereY= 124.67X+26 426 (R2=0.995 7) andY=1.233 4X+4 276.3 (R2=0.993 6), respectively (Figure 4). The low value of standard deviation of the two methods showed that both were precise. The relative standard deviation values for both intraday and interday analysis of γ-oryzanol were found to be less than 2%, ensuring repeatability and reproducibility of the procedure. The recovery rates were determined to be 95% to 105%. Both methods showed % RSD of peak areas calculatedfrom robustness studies for all variations of less than 0.91% and 0.73%, respectively. The LOD and LOQ were found to be 25 and 10 ng/spot, and 50 and 100 ng/spot, respectively. All of the validated data is shown in Table 1.

Figure 4. Standard curve of γ-oryzanol produced by (A) TLC-densitometric method and (B) TLC-image analysis method.

Table 1 Validation data of TLC-densitometric and TLC-image analysis methods.
3.2. Determination ofγ-oryzanol in cold pressed rice bran oil
The TLC-densitometric and TLC-image analysis methods were used to determine the γ-oryzanol content in rice bran oil. The contents of γ-oryzanol are shown in Table 2. The result of the pairedt-test (P<0.05) indicated that there was no significant difference between the mean values of γ-oryzanol content. Therefore, both TLC-densitometric and TLC-image analysis methods were found to be equal, and can be used for the determination of γ-oryzanol in cold pressed rice bran oil.

Table 2 γ-Oryzanol content in cold pressed rice bran oil samples determined by TLC-densitometric and TLC-image analysis methods.
4. Discussion
This is the first report of the validated TLC-image analysis method using a common computer technology for detection and quantitation of γ-oryzanol in cold pressed rice bran oil. Both TLC-densitometric and TLC-image analysis methods provided a similar reproducibility, accuracy and selectivity for the quantitative determination of γ-oryzanol in cold pressed rice bran oil. A statistical comparison of the quantitative determinations of γ-oryzanol in samples did not show any statistical significant difference between TLC-densitometric and TLC-image analysis methods. The results indicate that this TLC-image analysis method can be used for quantitative analysis of the γ-oryzanol content in rice bran oil. Therefore, it can also be useful for small rice bran oil manufacturers due to its simplicity and low operating costs. However, the TLC-image analysis system is not applicable for quantitative assays requiring high accuracy and high confidence[8].
Conflict of interest statement
We declare that we have no conflict of interest.
Acknowledgements
The authors wish to thank the Faculty of Pharmacy and Sino-Thai Traditional Medicine Research Center, (Cooperation between Rangsit University and Harbin Institute of Technology and Heilongjiang University of Chinese Medicine), Rangsit University, Pathum Thani, Thailand for all chemicals and instruments. We would also like to express our gratitude to KI Tull from Rangsit University for assistance with the English in this paper. Foundation Project was supported by the Research Institute of Rangsit University, Pathum Thani, Thailand (Grant No.73/55).
Comments
Background
Rice brand oil has γ-oryzanol as a bioactive compound. To develop and validate a new method for quantitative analysis of γ-oryzanol in cold pressed rice brand oil in order to minimize the cost and maximize the quality of research work.
Research frontiers
The present investigation demonstrates the comparison of TLC-densitometric and TLC-image analysis methods for determination of γ-oryzanol contents in rice brand oil. Results have shown no significant difference between these two methods.
Related reports
Since γ-oryzanol content in rice brand oil has been reported from several methods for quantitative determination, this is the first reported using image analysis system.
Innovations and breakthroughs
Image analysis method gives a promising result of γ-oryzanol content in parallel with TLC-densitometric method. Image analysis system provides simple, rapid, inexpensive, and accurate when compare with other instruments.
Applications
It could be suggested that the image analysis should be used for γ-oryzanol content determination in commercial rice brand oil.
Peer review
The author attempts to used image analysis as a new method for determination the content of γ-oryzanol which is never been reported elsewhere. The result from this valuable research paper should be introduced to commercial section to use this method instead of the usual one.
[1] Lerma-Garcia MJ, Herrero-Martinez JM, Simo-Alfonso EF, Mendonca Carla RB, Ramis-Ramos G. Composition, industrial processing and applications of rice bran γ-oryzanol. Food Chem 2009; 115: 389-404.
[2] Cho JY, Lee HJ, Kim GA, Kim GD, Lee YS, Shin SC, et al. Quantitative analyses of individual γ-oryzanol (steryl ferulates) in conventional and organic brown rice (Oryza sativa L.). J Cereal Sci 2012; 55: 337-343.
[3] Butsat S, Siriamornpun S. Antioxidant capacities and phenolic compounds of the husk, bran and endosperm of Thai rice. Food Chem 2010; 119: 606-613.
[4] Zullaikah S, Melwita E, Ju YH. Isolation of γ-oryzanol from crude rice bran oil. Bioresour Technol 2009; 100: 299-302.
[5] Pestana-Bauer VR, Zambiazi RC, Mendonça CRB, Beneito-Cambra M, Ramis-Ramos G. γ-Oryzanol and tocopherol contents in residues of rice bran oil refining. Food Chem 2012; 134: 1479-1483.
[6] Phattanawasin P, Sotanaphun U, Sukwattanasinit T, Akkarawaranthorn J, Kitchaiya S. Quantitative determination of sibutramine in adulterated herbal slimming formulations by TLC-image analysis method. Forensic Sci Int 2012; 219: 96-100.
[7] Afinisha Deepam LS, Soban Kumar DR, Sundaresan A, Arumughan C. A new method for simultaneous estimation of unsaponifiable constituents of rice bran oil using HPTLC. J Sep Sci 2007; 30: 2786-2793.
[8] Tie-xin T, Hong W. An image analysis system for thin-layer chromatography quantification and its validation. J Chromatogr Sci 2008; 46: 560-564.
10.1016/S2221-1691(14)60219-7
*Corresponding author: Apirak Sakunpak, Faculty of Pharmacy, Rangsit University, Pathum Thani, 12000, Thailand, Sino-Thai Traditional Medicine Research Center, (Cooperation between Rangsit University and Harbin Institute of Technology and Heilongjiang University of Chinese Medicine), Rangsit University, Pathum Thani, 12000, Thailand.
Tel/Fax: +66-2997-2222
E-mail: apirak.s@rsu.ac.th
Foundation Project: Supported by the Research Institute of Rangsit University, Pathum Thani, Thailand (Grant No. 73/55).
Article history:
Received 10 Nov 2013
Received in revised form 18 Nov, 2nd revised form 25 Nov, 3rd revised form 30 Nov 2013
Accepted 18 Jan 2014
Available online 28 Feb 2014
Methods:TLC-densitometric and TLC-image analysis methods were developed, validated, and used for quantitative analysis of γ-oryzanol in cold pressed rice bran oil. The results obtained by these two different quantification methods were compared by paired t-test.
Results:Both assays provided good linearity, accuracy, reproducibility and selectivity for determination of γ-oryzanol.
Conclusions:The TLC-densitometric and TLC-image analysis methods provided a similar reproducibility, accuracy and selectivity for the quantitative determination of γ-oryzanol in cold pressed rice bran oil. A statistical comparison of the quantitative determinations of γ-oryzanol in samples did not show any statistically significant difference between TLC-densitometric and TLC-image analysis methods. As both methods were found to be equal, they therefore can be used for the determination of γ-oryzanol in cold pressed rice bran oil.
 Asian Pacific Journal of Tropical Biomedicine2014年2期
- Asian Pacific Journal of Tropical Biomedicine的其它文章
- Comparative assessment of physicochemical properties of unripe peach (Prunus persica) and Japanese apricot (Prunus mume)
- Hibiscus sabdariffa extract inhibits in vitro biofilm formation capacity of Candida albicans isolated from recurrent urinary tract infections
- Lupeol: An antioxidant triterpene in Ficus pseudopalma Blanco (Moraceae)
- Pancreatic islet regeneration and some liver biochemical parameters of leaf extracts of Vitex doniana in normal and streptozotocin-induced diabetic albino rats
- A pharmacobotanical study of two medicinal species of Fabaceae
- Investigation of in vivo neuropharmacological effect of Alpinia nigra leaf extract