Experimental study and stress analysis of rock bolt anchorage performance
Yu Chen
Department of Geology and Mineral Resources Engineering,Norwegian University of Science and Technology(NTNU),Trondheim 7491,Norway
Experimental study and stress analysis of rock bolt anchorage performance
Yu Chen*
Department of Geology and Mineral Resources Engineering,Norwegian University of Science and Technology(NTNU),Trondheim 7491,Norway
A R T I C L EI N F O
Article history:
Received 18 March 2014
Received in revised form
13 June 2014
Accepted 25 June 2014
Available online 7 August 2014
Rock bolt
D-Bolt
Pull-and-shear
Stress
Bending
Joint gap
Rock strength
A new method was developed to apply pull-and-shear loads to the bolt specimen in order to evaluate the anchorage performance of the rebar bolt and the D-Bolt.In the tests,f i ve displacing angles(0°,20°,40°, 60°,and 90°),two joint gaps(0 mm and 30 mm),and three kinds of host rock materials(weak concrete, strong concrete,and concrete-granite)were considered,and stress—strain measurements were conducted.Results show that the ultimate loads of both the D-Bolt and the rebar bolt remained constant with any displacing angles.The ultimate displacement of the D-Bolt changed from 140 mm at the 0°displacing angle(pure pull)to approximately 70 mm at a displacing angle greater than 40°.The displacement capacity of the D-Bolt is approximately 3.5 times that of the rebar bolt under pure pull and 50%higher than that of the rebar bolt under pure shear.The compressive stress exists at 50 mm from the bolt head,and the maximum bending moment value rises with the increasing displacing angle.The rebar bolt mobilises greater applied load than the D-Bolt when subjected to the maximum bending.The yielding length(at 0°)of the D-Bolt is longer than that of the rebar bolt.The displacement capacity of the bolts increased with the joint gap.The bolt subjected to joint gap effect yields more quickly with greater bending moment and smaller applied load.The displacement capacities of the D-Bolt and the rebar bolt are greater in the weak host rock than that in the hard host rock.In pure shear condition,the ultimate load of the bolts slightly decreases in the hard rock.The yielding speed in the hard rock is higher than that in the weak rock.
©2014 Institute of Rock and Soil Mechanics,Chinese Academy of Sciences.Production and hosting by Elsevier B.V.All rights reserved.
1.Introduction
Rock bolts have been widely used as the primary support element to stabilise the rock masses around tunnels,mines,slopes, and other structures in association with rock masses.For better understanding of rock bolt performance,several studies have been carried out by laboratory and f i eld tests,analytical methods,and numerical analysis(Stille et al.,1989;Indraratna and Kaiser,1990; Stillborg,1994;Stjern,1995;Huang et al.,2002;Cai et al.,2004; Malmgren and Nordlund,2008;Carranza-Torres,2009;Bobet and Einstein,2011;Li,2014;Lin et al.,2014).According to practical engineering experiences,rock bolts may be subjected to pull-andshear loadings in f i eld.Following this point of view,many studies focused on rock bolt performance under shearloading and different grout media(Bjurstroem,1974;Hibino and Motojima,1981;Spang and Egger,1990;Holmberg,1991;Jalalifar et al.,2006;Jalalifar and Aziz,2010).There may be installation shortage of these tests if the angle between the bolt and the joint plane is less than 45°.The friction on the joint surfaces is not negligible as well.
The strain and stress distributions on the bolt surface are another interesting issue,and many researchers have examined the strain and stress distributions using either pull or shear conditions by laboratory tests and analytical methods(Ferrero,1995;Stjern, 1995;Grasselli,2005).Farmer(1975)carried out fundamental work on studying the axial behaviour of the bolt subjected to tensile load and demonstrated that the shear stress at the bolt—grout interface would attenuate exponentially from the loading point to the far end of the bolt before decoupling occurs.Li and Stillborg(1999)presented a model of the shear stress distribution along a fully encapsulated rock bolt in tension.In their model,the elastic,softening,and debonding zones were taken into account. Grasselli(2005)analysed the strain gauge data recorded during shear testand verif i ed that the plastic hingesoperate asobstacles to stress propagation.The formation of hinges is characterised by compression and tension on both sides of the bolt.
The aim of this paper will concentrate on the performance of rebar bolt and D-Bolt with the inf l uence of displacing angle,rock strength,and joint gap.A new method is developed to apply acombined pull-and-shear loading to the bolt specimens,and strain distribution on the bolt surface is recorded during the test.
2.Analytical aspect
When a bolted rock joint is subjected to pull-and-shear loading,the bolt deforms with increasing joint displacement, and this can mobilise an axial load N and a lateral load Q(Fig.1) (Marenˇce and Swoboda,1995).In the elastic region,the bolt deforms as a curve and has two critical points:one in the bolt-joint intersection with zero bending moment(point O)and the other with the maximum bending moment with zero shear stress(point A)(Jalalifar et al.,2006;Jalalifar and Aziz,2010).The stress resultants are decided by the bending moment M,the axial load N, and the lateral load Q.On the basis of the beam theory,the uniform stress distribution“σ=N/A”exists along the bolt.The bending moment produces a linearly varying stressσ=±(My/I), with tension(positive)on the upper part of the bolt and compression(negative)on the lower part.The f i nal distribution of axial stress is obtained as follows:
whereσ1andσ2are the axial stresses acting on the upperand lower bolt surfaces,respectively;A is the area of bolt cross-section;I is the moment of inertia;and y is the distance to neutral axis.
By combining Eqs.(1)and(2),the bending moment can be calculated by

The resulting strains and stresses in the bolt are directly related to the curvature of the def l ected bolt(Fig.1).Strain value was recorded by strain gauges in the bolt test.According to the stress—strain curve of standard tensile test,stress value can be calibrated from strain value.Thus,the bending moment can be obtained via Eq.(3).As the pull-and-shear loading increases,the surrounding medium generates a reaction on the bolt length.It increases progressively until the bolt reaches the yield limit.
3.Test design
3.1.Testing method and conf i guration
A new test method was developed to simulate the pull-andshear loading condition on the NTNU/SINTEF bolt test rig(Fig.2). The pull-and-shear loads are applied separately by two hydraulic cylinder systems.The angle between the pull displacement and the shear displacement is def i ned as displacing angle(α).The angle between the pull load and the shear load is def i ned as loading angle (θ).Previous shear tests of rock bolts(Ludvig,1984;Spang and Egger,1990;Jalalifar et al.,2006)showed that the angle between the bolt and the joint surface(i.e.displacing angle)may not be less than 45°practically for installation.In order to overcome this shortage,the displacing angle(α)in our study is designed to be adjusted in the range from 0°(pure pull)to 90°(pure shear)by distributing the pressurised oil to the pull-and-shear cylinders individually.Another advantage of this test method is that no joint friction is involved because two concrete blocks are apart from each other during testing.
The rock mass is simulated by two cubic concrete blocks with a side length of 0.95 m.The concrete cubes were placed in the frame of the test rig after a curing period of at least 30 days.Boreholes were then pneumatically drilled with 33-mm drill bits.After that, cement mortar with a water-to-cement ratio of 0.32 was pumped into the boreholes,and the bolt specimen was inserted into the hole.The strength of the cement grout is about 65 MPa after 3 days of curing.The plate load was recorded by a load cell under the bolt plate.Roller bearings were installed between the blocks and the frame of the rig,aiming to get rid of the frictional resistance between them as well as to guide the blocks.The roller bearings and frame can also prevent the rotation of the concrete blocks during the test.The loading capacity of the two axial cylinders for pull is 500 kN(2×250 kN),and the capacity of the lateral cylinder for shear is 600 kN.
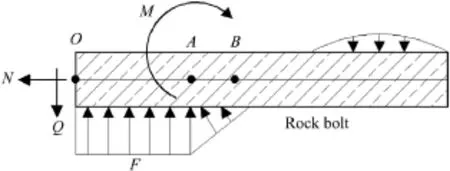
Fig.1.Loading condition of bolt during pull-and-shear loading(Marenˇce and Swoboda,1995).

Fig.2.SINTEF/NTNU bolt test rig.(a)Full-scale test rig in laboratory;(b)Top view sketch.
3.2.Bolt specimens and strain gauge layout
Two types of rock bolts,i.e.the rebar bolt and the D-Bolt,were tested in this study.The rebar bolt is a conventional rock bolt with tightly spaced small ribs,high load capacity,and small deformation. It is bonded to the grout/rock along its entire length through the mechanical interlock between the bolt ribs and the grout.The DBolt(Fig.3a)is a type of energy-absorbing rock bolt developed recently at the NTNU(Li,2010,2012;Li and Doucet,2012).It is characterised by both high load and large deformation capacities. The D-Bolt is made of a smooth steel bar with several deformed sections that act as anchor points along its length.Both the rebar and the D-Bolt specimens were 20 mm in diameter and 2 m in length,with a thread section of 150—200 mm at one end.The DBolt specimens for this study had two anchors spaced by a distance of 1 m.
In order to obtain detailed information about the stress condition along the bolt,strain gauges were mounted at different locations according to Fig.3b.For most of the tests,six pairs of strain gauges were equally placed at 50 mm,150 mm,and 300 mm from the bolt head.For some other tests,an additional pair of strain gauges was placed at 100 mm from the bolt head.To further guarantee protection of strain gauges,the smooth shank of the DBolt was coated with plastic pipe(Fig.3a).However,test results(Li, 2010)showed that the coating media have a limited effect on the anchorage performance of the D-Bolt.It is vital that the D-Bolt is able to detach from the grout media,permitting full use of the bar’s elongation capacity.Even if the D-Bolt is fully grouted with cement, the diameter of the D-Bolt decreases with the increase in axial tensile load.Because of the Poisson effect,the cross-sectional contraction allows the D-Bolt to be detached from the grout.
3.3.Test plan
Four groups of bolt specimens were arranged in this study (Table 1).In group 1,the bolts were installed in strong concrete blocks with a uniaxial compressive strength(UCS)of 110 MPa and were tested by varying displacing angles from 0°(pure pull)to 90°(pure shear).The strong concrete blocks are usually used for bolt tests in the laboratory.In group 2,the bolts were installed in concrete-granite blocks in order to compare the bolt performances in the granite and strong concrete blocks.The block was made by casting an Iddefjord granite block(0.75 m×0.75 m×0.40 m, UCS=136 MPa)in concrete(UCS=110 MPa)(Fig.4).The granite sides of the two blocks faced each other so that the bolt was loaded by the granite blocks during testing.In group 3,weak concrete blocks with the UCS of 30 MPa were used to evaluate the effect of block strength on bolt performance.The joint gap between the two blocks was nominally zero at the beginning of testing for groups 1—3.The tests in group 4 were carried out with ajoint gap of 30 mm in order to examine the inf l uence of the joint gap.The concrete blocks in group 4 are the same as those in group 1.During testing,strains were recorded via strain gauges for each type of test.

Fig.3.D-Bolt specimen and strain gauge layout.(a)Anchor detail and bolt shank with plastic pipe;(b)Strain gauge positions on the bolt.
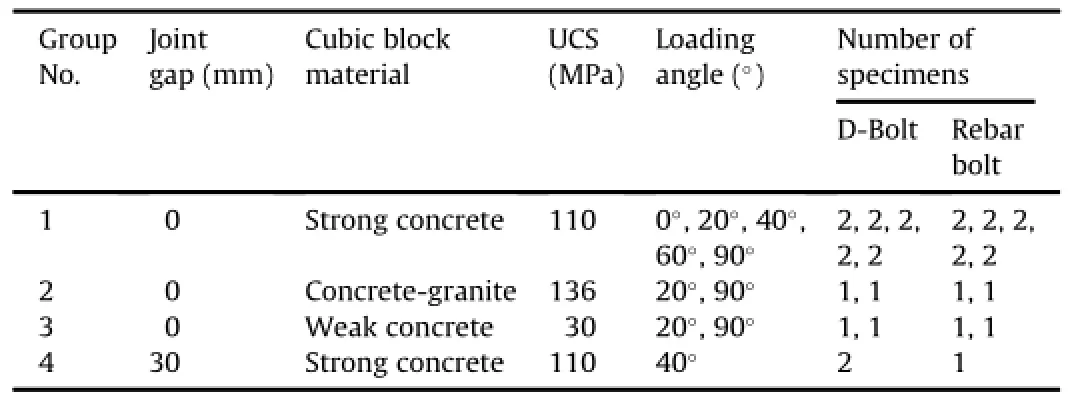
Table 1Grouping of the bolt specimens.
4.Test results
Some test results of total load and total displacement are presented in detail in Chen and Li(2014a,b).A short summary of them is presented in this section.The total load and total displacement used in the study below are def i ned as follows:

where Ftotis the total load,Fpis the pull load,Fsis the shear load, Dtotis the total displacement,Dpis the pull displacement,and Dsis the shear displacement.

Fig.4.The concrete-granite block for test in group 2.

Fig.5.Stress—strain behaviour of D-Bolt steel material under standard tensile test.
4.1.Standard tensile test
The standard tensile tests were carried out in the laboratory to examine the stress—strain relationship of the steel material.This relationship is unique for each material and can be found by recording the amount of deformation(strain)at different intervals of tensile loading(stress).Test samples were prepared from the rebar bolt and the D-Bolt in this study.They had a dog-bone shape, with a 12-mm diameter and a 90-mm length for the middle stretch section.The tensile test results of these two bolts were similar.As a representative,Fig.5 shows the result of the D-Bolt.Under tensile loading,the sample was elongated elastically until the strain reached approximately 0.25%and then yielded at 450 MPa for the rebar bolt and 510 MPa for the D-Bolt.It became hardened afterwards,reaching the ultimate tensile strength at 610 MPa for the rebar bolt and 650 MPa for the D-Bolt at a strain of approximately 10%.The sample continued to elongate at the level of the tensile strength until the initiation of necking at a strain of approximately 18%.Finally,the sample failed at an ultimate strain of approximately 24%.According to this stress—strain diagram of standard tensile test,each stress value at the strain gauge position can be obtained exactly.
4.2.Strain gauge data recording
The strain and load data recorded bygauges at all positions from a representative test demonstrate how the bolts respond to pulland-shear loading(Fig.6).The upper strain gauges Nos.2,4,6, and 8,which lay 50 mm,100 mm,150 mm,and 300 mm,respectively,from the bolt head,show increases in axial strain.As common in all tests,the lower strain gauges near the bolt head,i.e.No.1 (50 mm from the joint surface),respond with an obvious decrease in strain.Some test results show that the strains of gauges Nos.3 and 5,which are 100 mm and 150 mm from the bolt head, respectively,are also negative at the beginning of loading.For all bolts,the magnitude of the negative strain is consistently less than the opposing positive strain on the other side of the bolt and was reversed as the test continued.The strain of the gauge No.3 becomes positive when the load reached approximately 125 kN.The strains of the last four gauges(Nos.5—8)go up with similar increment.However,signals are lost at the gauges Nos.1 and 2 before the ultimate load is reached.It is because that the bending at approximately 100 kN is quite large and the strain gauges are stretched seriously.
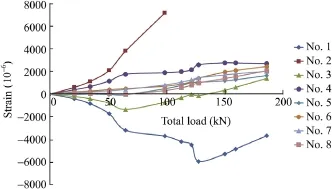
Fig.6.Strain versus total applied load of a D-Bolt specimen(group 2,90°displacing angle).
4.3.Tests of the displacing angle
Total load—total displacement relationships with different selected displacing angles are displayed in Fig.7.The ultimate loads (0°,20°,40°,60°,and 90°)are in the range of 200—219 kN for the DBolt and 195—217 kN for the rebar bolt.As shown in Fig.8,the ultimate displacement of the D-Bolt decreases by approximately 30%when the displacing angle is changed from 0°(pure pull)to 20°.It varies from 140 mm at the 0°displacing angle(pure pull)to approximately 70 mm at a displacing angle greater than 40°.The ultimate displacement of the rebar bolt smoothly increases from 29 mm to 53 mm with an increase in the displacing angle within the range from 20°to 90°.
4.4.Tests of the host rock materials
Three types of blocks(corresponding to groups 1,2,and 3 in Table 1)were used to compare bolt anchorage performances in different host rock materials.In group 2,two Iddefjord granite blocks were utilised to be cast in the concrete blocks tosimulate the real rock condition in f i eld.
The test results of the load—displacement behaviour of the bolts are shown in Fig.9 for the bolts tested at the 20°displacing angle and installed in the different types of blocks.The total failure loads of the D-Bolt and the rebar bolt are in the range of 206—209 kN and 209—217 kN,respectively.The total failure displacement varies from 111 mm to 92 mm for the D-Bolt and from 55 mm to 30 mm for the rebar bolt.In terms of the 90°displacing angle(Fig.10),the slopes of all the curves suddenly become smaller at the displacement of approximately 8 cm.The total failure load,varying from 187 kN to 210 kN for the D-Bolt and from 188 kN to 203 kN for the rebar bolt,rises with the decrease in host rock strength.The total failure displacement,which varies from 59 mm to 97 mm for the D-Bolt and from 40 mm to 68 mm for the rebar bolt,increases with the decrease in host rock strength.

Fig.7.Total load versus total displacement for the rock bolt specimens in group 1.
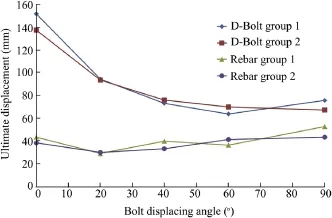
Fig.8.Failure displacements versus displacing angles for the D-Bolt and rebar bolt specimens.
4.5.Tests of the joint gap effect
With the 40°displacingangle,failure occurred at the joint gapin a combined pull-and-shear mode.As indicated in Fig.11,there is no major load capacity difference between the D-Bolt and the rebar bolt.The maximum total loads of all bolts are in the range of 201—209 kN.On the contrary,the joint gap slightly increases the displacement capacity of both the bolts.The maximum total displacement increases from 76 mm to approximately 83.5 mm for the D-Bolt and from 33 mm to 48 mm for the rebar bolt.
5.Discussion and analysis
5.1.Displacing angle effect
As shown in Figs.7 and 8,the load capacity,dependent on the strength of the bolt steel,remains approximately constant no matter what the displacing angle is.On the contrary,the displacement capacity of the D-Bolt decreases with increasing displacing angle.The displacement capacity of the 1-m-long D-Bolt section is approximately 3.5 times that of the rebar bolt under pure pull and still morethan 50%higher under pure shear.Because of the structure of the rebar bolt,the displacing angle has a minor impact on the displacement capacity.When a rebar is subjected to pure pull,for instance,the weak rib bond fails in the bolt section close to the joint gap,while the bolt section located far from the joint gap is not affected at all.When subjected to pull-and-shear condition,the host material underneath the bolt will be crushed under the shear force.The bolt has apossibility tobe stretched and bent,resulting in failure of theweak rib bond between these two“bending points”.In other words,the inf l uence of the joint gap,with any displacing angle,is distributed over the relatively short portion close to the joint gap of thewhole rebarbolt.Only this short portion’s extension capacity can be mobilised.
The bonding condition between the bolt and the grout is an important issue for bolt performance.It is very weak for D-Bolt and strong for rebar bolt.When the D-Bolt is subjected to small displacing angles(0°and 20°,Fig.7),its linear-elastic stiffness mainly depends on the deformation modulus of the bolt steel and the length of the bolt section.However,the linear-elastic stiffness of the rebar bolt is also mainly dependent on the bolt steel,but it is slightly larger(or stiffer)than the D-Bolt because its freely deforming section is much shorter than the section length of the DBolt.Grout crushing may occur underneath the bolt shank,leading to a smaller stiffness afterwards until the bolt steel yields.It can be conf i rmed by the curves of 90°in Fig.7.
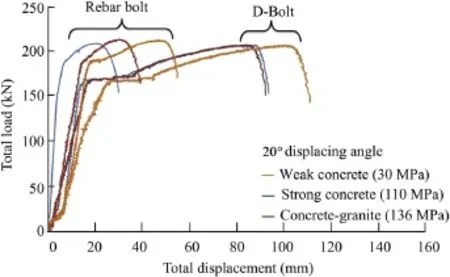
Fig.9.Total load versus total displacement for different host rock materials(20°displacing angle,groups 1,2 and 3).
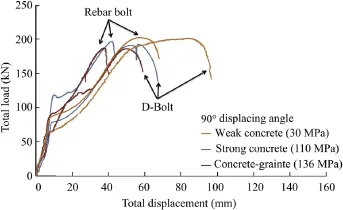
Fig.10.Total load versus total displacement for different host rock materials(90°displacing angle,groups 1,2 and 3).
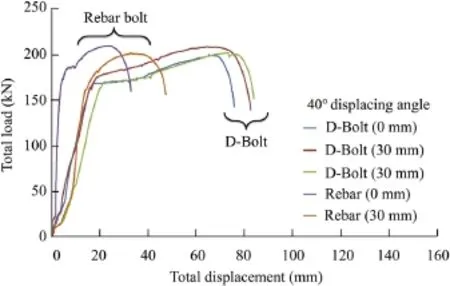
Fig.11.Joint gap effect of D-Bolts and rebar bolts(40°displacing angle,groups 1 and 4).
According to strain gauge data recorded during the test,strain was generated along the bolt surface as the applied load increased. The stress distributions of the rebar bolt and the D-Bolt at the same displacing angle are compared,as shown in Fig.12.In terms of rebar bolt,the axial stresses on the upper and the lower surfaces quickly decrease beyond 150 mm from the bolt head.Stress variation at 300 mm is negligible.On the one hand,the tensile stresses for displacing angles from 20°to 90°on the upper surface increase with increasing applied load.It is substantially close to thetheoretical stress distribution of rock bolt under pull-out test(Li and Stillborg,1999).At 50 mm,the upper stress of the 20°displacing angle is 450 MPa with an applied load of 100 kN,which is greater than that of other displacing angles.It is believed that there is mainly pull effect rather than bendingon the rebar bolt under the 20°displacing angle.On the other hand,compressive stresses are observed at 50 mm and never exist at 150 mm and 300 mm.At the 90°displacing angle,the lower stress at 50 mm is-171 MPa when the load is 100 kN,suggesting that the bolt def l ects obviously.
In terms of D-Bolt,the basic trends of upper and lower stress distributions are similar to those of the rebar bolt.However,the tensile stress at 300 mm is not negligible.The stress distribution of the 20°displacing angle is unique as the bolt failed with a relatively long displacement(94 mm,Fig.7).Only about one-half of the displacement capacity was mobilised when the load is 100 kN.It is evident,therefore,that with an applied load of 100 kN,the upper gauges at 50 mm from 40°to 90°displacing angles reach the yield limit(510 MPa).It is interesting to note that the upper gauge at 150 mm of the 90°displacing angle yields as well.The range of the yielding of the D-Bolt is larger than that of the rebar bolt when subjected to pure shear.One strain gauge failed during the test of the 90°displacing angle.Compressive stresses are observed at 50 mm and never exist at 150 mm and 300 mm for the 40°and 60°displacing angles,respectively.The lower gauge at 50 mm for the 60°displacing angle reaches the yield limit(510 MPa).It can be assumed that the gauge at the same position for the 90°displacing angle will also yield according to Fig.13.
Bending is a characteristic of bolt def l ection.A greater bending moment indicates a greater difference between upper and lower stresses.Because onlya small bendingof bolt is recorded at 150 mm or 300 mm,the maximum bending at 50 mm from the bolt head with various bolt displacing angles is analysed typically in Fig.13.In terms of the D-Bolt,the maximum bending moment value of the bolt at the 50-mm position increases from 0°to 90°.The D-Boltreaches the maximum value(400 N m)and the pairs of strain gauges reach the yield limit when the bolt is subjected to a 60°displacing angle(Fig.12c).In terms of the rebar bolt,there is no obvious trend,and the moment values are 96 N m(40°)and 330 N m(90°).Only the upper strain gauge at 50 mm of the rebar bolt reaches the yield limit.

Fig.12.Distributions of the axial stress along D-Bolts and rebar bolts with varying displacing angles.(a)20°,(b)40°,(c)60°,(d)90°.
In Fig.14,the mobilised total load and total displacement when the bolt reaches the maximum bending moment are compared.In general,the rebar bolt suffers a greater level of applied load than the D-Bolt in order to reach the maximum bending.The mobilised loads are maintained at the range of 50—100 kN for the D-Bolt and 100—130 kN for the rebar bolt with varying displacing angles. However,the magnitudes of displacement are small obviously in the linear stress—strain region of the bolt.Similarly,the mobilised displacement of D-Bolt basically keeps constant between 7 mm and 12 mm with any displacing angle.However,the mobilised displacement of the rebar bolt increases from 3 mm(20°and 40°) to 13 mm(90°).
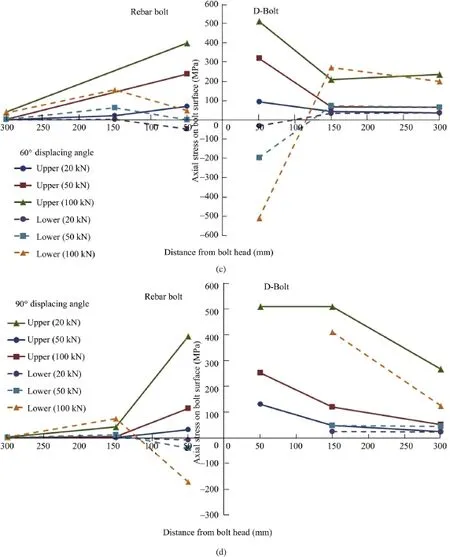
Fig.12.(continued).

Fig.13.Maximum bending moment at 50 mm from bolt head versus varying displacing angles.

Fig.14.Mobilised total load and total displacement of bolts versus varying displacing angles when bolts are subjected to maximum bending moment.(a)Total load;(b)Total displacement.
5.2.Host rock material effect
As shown in Figs.9 and 10,four deformation stages of all bolts can be observed:linear-elastic deformation,yielding,plastic deformation,and necking failure.In general,the strength of the host rock material has a minor inf l uence on the bolt load contribution.The ultimate load varies in a narrow range of 190—220 kN for the two types of bolts with any displacing angle and any type of host rock materials.
It is interesting to note the steady decrease trends in ultimate failure displacement associated with the increase in host rock strength(Fig.15).The parallel trend lines have similar slopes, except for the rebar bolt with a 20°displacing angle.The bolts in the weak rock are more deformation tolerable,suggesting that they would sustain longer time and could suffer larger rock dilations. The test results also indicate that the strength of the host rock is one of the important parameters for the shear resistance of the bolted joint,especially in case that the bolt is perpendicular to the joint surface where the bolt bends and a considerable tensile force is induced.
In order to demonstrate how the stress develops with different host rock strengths,two representative tests are compared with applied total loads of 20 kN,50 kN,and 100 kN(Fig.16).On the upper part of the D-Bolt,the axial stress situation along the bolt varies throughout the test and decreases exponentially from the point of loading to the far end.On the lower part,the negative stresses at 50 mm,100 mm,and 150 mm are observed from the beginning of loading.The reading at 20 kN of applied load shows that both compressive and tensile stresses are lower than 100 MPa. When the total load is 50 kN,the stresses at 50-mm position are 425 and-350 MPa for the hard block condition(UCS=136 MPa), and324and-267MPafortheweakblockcondition (UCS=30 MPa).It is shown that the bolt subjected to pure shear loading reaches the yield limit more quickly in hard rock.While the total load is 100 kN,the two pairs of gauges at the 50-mm position with different block strengths reach the yield limit(±510 MPa) totally.However,the stress at 150 mm of the lower part becomes positive with the total load of 100 kN,indicating that the bolt at this position deforms from compression to tension.
Moreover,there are no signif i cant changes in the maximum bending moment along the bolt with different host rock materials. For instance,the maximum bending moment values at the 50-mm position are 400 N m(90°,D-Bolt)and 330 N m(90°,rebar bolt), regardless of varying block strengths.It is because there is no meaningful change in induced stress beyond the yield limit along the bolt axis with increasing rock strength.The gauges yield totally at this position,and the bending moment value keeps the same.
5.3.Joint gap effect
The combined pull-and-shear failure at the 40°displacing angle for the rock bolts is shown in Fig.11.Two types of bolts have similar load capacities no matter how the joint of the blocks is tightly closed or opened with gap.On the contrary,the joint gap increases the displacement capacity of the bolts.However,the displacement increment of the D-Bolt is smaller than that of the rebar bolt.It is because when a rebar is subjected to joint gap opening,the weak rib bond fails in the bolt section close tothe joint gap,while the bolt section located far from the joint gap is not affected at all.Thus,the displacement capacity of the bolt section near the joint gap is mobilised as large as possible.This phenomenon could result in premature failure of the rebar bolt.The D-Bolt,however,has long smooth sections between anchors,which can freely deform when subjected torock dilation.It can sustain the joint gap inf l uencewith its entire length of the bolt section(2 m).Therefore,the D-Bolt performs more reliably than the rebar bolt with the joint gap.
As illustrated in Fig.17,two representative tests of D-Bolt are selected to compare the stress distribution difference in the joint gap effect with applied total loads of 20 kN,50 kN,and 100 kN.On the upper part,all the tensile axial stresses increase exponentially with the increase in the applied load.On the lower part,the compressive stresses are developed at the 50-mm position for these two bolts,whereas the tensile stresses exist at 150-mm and 300-mm positions during the test.When the total load is 50 kN, the stresses of the upper and lower parts at the 50-mm position are 510 MPa and-375 MPa for the D-Bolt with joint gap and 354 MPa and-144 MPa for the D-Bolt without joint gap.While the total load is 100 kN,the upper gauges at the 50-mm positionfor the two types of tests reach the yield limit(510 MPa),and the lower stresses at the 50-mm position are-150 MPa and-81 MPa, respectively.It shows that the bolt subjected to joint gap reaches the yield limit more easily with applied load.Thus,the mobilised bendingmomentisgreater withjointgap,whichcanbe conf i rmed according to Table 2.The bending moments at 150-mm and 300-mm positions are relatively small and can be disregarded. The bolt subjected to joint gap suffers greater bending moment (350 N m)than that without joint gap(280 N m)at the 50-mm position.In conclusion,the bolt with joint gap can mobilise greater bending moment with smaller applied total load and approximately the same total displacement.

Fig.15.Ultimate displacement versus host rock material strength(groups 1,2 and 3).

Fig.16.Distribution of the axial stress along D-Bolts with different host rock strengths.

Fig.17.Distribution of the axial stress along D-Bolts with joint gap effect.
6.Conclusions
A new test method was developed to evaluate the rock bolt performance with the effects of varying displacing angles,different host rock materials,and different joint gap openings.The load canbe applied easily to specimens with any displacing angle in the range from 0°(pure pull)to 90°(pure shear).Strain gauges were mounted on bolt surface in order to examine the stress distribution. The axial stress on the upper bolt surface decreases exponentially from the loading point to the far end with any displacing angle.The stress of the rebar bolt beyond 150 mm from the bolt head decreases quickly and is negligible at 300 mm.The compression on the lower surface only exists at 50 mm.The strain gauges(50 mm and 150 mm)of the D-Bolt yield when subjected to pure shear.The range of yielding of the D-Bolt is larger than that of rebar bolt when subjected to pure shear.The bending moment of the D-Bolt reaches the maximum value(400 N m)at a displacing angle greater than 60°.The maximum bending moment value rises gradually with the increasing displacing angle.The rebar bolt suffers greater applied load than the D-Bolt in order to reach the maximum bending.The mobilised loads are maintained at the range of 50—100 kN for the D-Bolt and 100—130 kN for the rebar bolt from 20°to 90°.

Table 2Bending performance comparison of joint gap(D-Bolt,40°displacing angle).
Theweakconcrete(UCS=30MPa),strongconcrete (UCS=110 MPa),and concrete-granite blocks(UCS=136 MPa) were used to study the effect of the rock strength on the rock bolt performance.The ultimate displacement of the rock bolt is greater in the weak blocks than that in the strong blocks.In the case of pure shear,bolt bending is signif i cantly large when the bolt is subjected to a harder rock condition.The yielding speed of bolt in harder rock is quicker than that in weaker rock.When the bolt is subjected to pure shear,it deforms from compression to tension at the 150-mm position.With a 40°displacing angle,there is no obvious joint gap effect on the load capacity of the rock bolts.The displacement increments of the 30-mm joint gap effect are 7 mm for the rebar and 15 mm for the D-Bolt.The bolt subjected to joint gap reaches the yield limit more quickly and has a greater bending moment with a smaller applied load than the normal one.
Conf l ict of interest
The author wishes to conf i rm that there are no known conf l icts of interest associated with this publication and there has been no signif i cant f i nancial support for this work that could have inf l uenced its outcome.
Acknowledgements
The work is f i nancially supported by Luossavaara-Kiirunavaara AB and Boliden Mineral AB,Sweden.The author is thankful to Prof. Charlie C.Li for his supervision and Mr.Torkjell Breivik and Mr. Gunnar Vistnes for their skilful assistance in laboratory testing.
Bjurstroem S.Shear strength of hard rock joints reinforced by grouted untensioned bolts.In:Proceedings of the 3rd ISRM Congress.Denver;1974.p.1194—9.
Bobet A,Einstein HH.Tunnel reinforcement with rockbolts.Tunnelling and Underground Space Technology 2011;26(1):100—23.
Cai Y,Esaki T,Jiang Y.An analytical model to predict axial load in grouted rock bolt for soft rock tunneling.Tunnelling and Underground Space Technology 2004;19(6):607—18.
Carranza-Torres C.Analytical and numerical study of the mechanics of rockbolt reinforcement around tunnels in rock masses.Rock Mechanics and Rock Engineering 2009;42(2):175—228.
Chen Y,Li CC.Inf l uences of loading condition and rock strength to the performance of rock bolts.Geotechnical Testing Journal 2014a(in press).
Chen Y,Li CC.Performance of fully encapsulated rebar bolts and D-Bolts under combined pull-and-shear loading.Tunnelling and Underground Space Technology 2014b(in press).
Farmer IW.Stress distribution along a resin grouted rock anchor.International Journal of Rock Mechanics and Mining Sciences and Geomechanics Abstracts 1975;12(11):347—51.
Ferrero AM.The shear strength of reinforced rock joints.International Journal of Rock Mechanics and Mining Sciences and Geomechanics Abstracts 1995;32(6): 595—605.
Grasselli G.3D behaviour of bolted rock joints:experimental and numerical study. International Journal of Rock Mechanics and Mining Sciences 2005;42(1):13—24.
Hibino S,Motojima M.Effects of rock bolting in jointy rocks.In:Proceedings of the International Symposium on Weak Rock.Tokyo;1981.p.1052—62.
Holmberg M.The mechanical behaviour of untensioned grouted rock bolts.PhD Thesis.Stockholm,Sweden:Royal Institute of Technology;1991.
Huang Z,Broch E,Lu M.Cavern roof stability—mechanism of arching and stabilizationbyrockbolting.TunnellingandUndergroundSpaceTechnology 2002;17(3):249—61.
Indraratna B,Kaiser PK.Analytical model for the design of grouted rock bolts.International Journal for Numerical and Analytical Methods in Geomechanics 1990;14(4):227—51.
Jalalifar H,Aziz N,Hadi M.The effect of surface prof i le,rock strength and pretension load on bending behaviour of fully grouted bolts.Geotechnical and Geological Engineering 2006;24(5):1203—27.
Jalalifar H,Aziz N.Experimental and 3D numerical simulation of reinforced shear joints.Rock Mechanics and Rock Engineering 2010;43(1):95—103.
Li C,Stillborg B.Analytical models for rock bolts.International Journal of Rock Mechanics and Mining Sciences 1999;36(8):1013—29.
Li CC,Doucet C.Performance of D-Bolts under dynamic loading.Rock Mechanics and Rock Engineering 2012;45(2):193—204.
Li CC.A new energy-absorbing bolt for rock support in high stress rock masses. International Journal of Rock Mechanics and Mining Sciences 2010;47(3):396—404.
Li CC.A review on the performance of conventional and energy-absorbing rockbolts.Journal of Rock Mechanics and Geotechnical Engineering 2014;6(4):315—27.
Li CC.Performance of D-Bolts under static loading.Rock Mechanics and Rock Engineering 2012;45(2):183—92.
Lin H,Xiong Z,Liu T,Cao R,Cao P.Numerical simulations of the effect of bolt inclination on the shear strength of rock joints.International Journal of Rock Mechanics and Mining Sciences 2014;66:49—56.
Ludvig B.Shear tests on rock bolts.In:Proceedings of the International Symposium on Rock Bolting.Rotterdam,Netherlands:A.A.Balkema/Taylor&Francis;1984. p.113—23.
Malmgren L,Nordlund E.Interaction of shotcrete with rock and rock bolts—a numerical study.International Journal of Rock Mechanics and Mining Sciences 2008;45(4):538—53.
Marenˇce M,Swoboda G.Numerical model for rock bolts with consideration of rock joint movements.Rock Mechanics and Rock Engineering 1995;28(3): 145—65.
Spang K,Egger P.Action of fully-grouted bolts in jointed rock and factors of infl uence.Rock Mechanics and Rock Engineering 1990;23(3):201—29.
Stillborg B.Professional users handbook for rock bolting.2nd ed.Clausthal-Zellerfelt:Trans.Tech.Publications;1994.
Stille H,Holmberg M,Nord G.Support of weak rock with grouted bolts and shotcrete.International Journal of Rock Mechanics and Mining Sciences and Geomechanics Abstracts 1989;26(1):99—113.
Stjern G.Practical performance of rock bolts.PhD Thesis.Trondheim,Norway: University of Trondheim;1995.

Yu Chen received his B.E.degree in Urban Underground Engineering and M.Sc.in Geotechnical Engineering from Central South University(CSU),China.At present,he is working as Ph.D.candidate/Research fellow at NorwegianUniversityofScienceandTechnology(NTNU), Norway.His research interests cover numerical modellingandlaboratorytestofrockengineeringand geotechnical engineering.
*Tel.:+47 73594808.
E-mail addresses:joyidol1013@hotmail.com,yu.chen@ntnu.no,joyidol@163. com.
Peer review under responsibility of Institute of Rock and Soil Mechanics,Chinese Academy of Sciences.
1674-7755©2014 Institute of Rock and Soil Mechanics,Chinese Academy of Sciences.Production and hosting by Elsevier B.V.All rights reserved.
http://dx.doi.org/10.1016/j.jrmge.2014.06.002
 Journal of Rock Mechanics and Geotechnical Engineering2014年5期
- Journal of Rock Mechanics and Geotechnical Engineering的其它文章
- Underground space planning in Helsinki
- Effects of lime treatment on the microstructure and hydraulic conductivity of Héricourt clay
- Seismic earth pressures on f l exible cantilever retaining walls with deformable inclusions
- Grouting techniques for the unfavorable geological conditions of Xiang’an subsea tunnel in China
- Theoretical and numerical studies of crack initiation and propagation in rock masses under freezing pressure and far-f i eld stress
