Three photosynthetic patterns characterized by cluster analysis of gas exchange data in two rice populations
*
Institute of Crop Science,Chinese Academy of AgriculturalSciences,Key Laboratory of Crop Physiology and Production,Ministry of Agriculture, Beijing 100081,China
Three photosynthetic patterns characterized by cluster analysis of gas exchange data in two rice populations
Zaisong Ding,Tao Li,Xianguo Zhu,Xuefang Sun,Suhua Huang, Baoyuan Zhou,Ming Zhao*
Institute of Crop Science,Chinese Academy of AgriculturalSciences,Key Laboratory of Crop Physiology and Production,Ministry of Agriculture, Beijing 100081,China
A R T I C L E I N F O
Article history:
Received 14 October 2013
Received in revised form
26 November 2013
Accepted 12 December 2013
Available online 19 December 2013
Cluster analysis
Net photosynthesis rate
Stomatal pattern
Carboxylation pattern
Rice
Plant photosynthetic rate is affected by stomatal status and internal CO2carboxylation. Understanding which process determines photosynthetic rate is essential for developing strategies for breeding crops with high photosynthetic efficiency.In this study,we identified different physiological patterns of photosynthetic rate in two different rice populations. Photosynthetic gas exchange parameters were measured during the flowering stage in two rice populations.Clustering and correlation analyses were performed on the resulting data.Five or six groups were defined by K-means clustering according to differences in net photosynthetic rates(Pn).According to differences in stomatal conductance(gs)and carboxylation efficiency (CE),each group was clustered into three subgroups characterized by physiological patterns stomatal pattern,carboxylation pattern,and intermediate pattern.Pnwas significantly correlated with gs(r=0.810)and CE(r=0.531).Pnwas also significantly correlated with gsand CE in the three physiologicalpatterns.The correlation coefficients were highest in the stomatal pattern(0.905 and 0.957)and lowest in the carboxylation pattern(0.825 and 0.859).Higher correlation coefficients between Pnand gsor CE in the three physiologicalpatterns indicate that clustering is very important for understanding factors limiting rice photosynthesis.
©2013 Production and hosting by Elsevier B.V.on behalf of Crop Science Society of China and Institute of Crop Science,CAAS.
1.Introduction
Increasing leaf photosynthesis is an important way to increase biomass production and yield potential when the effects of other factors such as partitioning,nutrient responsiveness,and leaf area index have been minimized[1–3].This realization has renewed interest in ways to improve photosynthesis at the individual leaf level.Besides engineering C4photosynthetic pathway into C3crops,another way is to use high-photosynthesis genetic resources of crops or their wild relatives.
Most attention at the leaflevelhas been focused on increasing the light-saturated photosynthetic rate(Pn),possibly because photosynthesis under light-limiting conditions is much more variable than under light saturation.Many studies on historical varieties ofdifferentcropspecies have revealed that Pninfluences yield potentialfor crop improvement[4–8],suggesting that Pnis a useful parameter for improvement of photosynthesis by breeding.
Clear differences in Pnhave been observed among rice varieties,species,and progeny derived from crosses between species[4,9–13].However,the mechanism of variation in Pnis complex.Many studies have found that Pnis significantly correlated with stomatal conductance(gs)[5,9,14],which describes the stomatal process affecting photosynthesis.Pnis also significantly correlated with Rubisco(Ribulose biphosphate carboxylase/oxygenase)content of the leaf[9,15]and carboxylation efficiency(CE)[16],which describes the biochemical processes affecting photosynthesis.Notably,the correlation between Pnand gsis always higher than that between Pnand Rubisco content or CE.It is unclear which parameter,gsor CE,would be more important in breeding crops with high photosynthetic rate.
In the present study we performed a multivariate statistical analysis of gas exchange parameter data obtained from two rice populations and found that different photosynthetic patterns are present in rice.
2.Materials and methods
2.1.Materials
Rice population A consisted of F5progenies derived from hybridization between the upland rice line YF2-1and sorghum variety Shennong 133.The cross was made by the pollen-tube pathway method[17](performed by Zhao Fengwu,Dry Land Farming Institute,Hebei Academy of Agriculture and Forestry Sciences).Atthe F1generation,plants with differenttraits fromthe YF2-1were selected,followed by continuous pedigree selection from F2to F5.For population B,the“new planttype”(NPT)rice line IR65598-110-2 was crossed with the wild rice Oryza longistaminata (IRRI accession number 101741).The progeny were backcrossed twice and the BC2F2population was obtained at International Rice Research Institute(IRRI).The BC2F2was screened in Beijing in an upland field for drought resistance and ecological adaptation.Six individuals thatreached maturity were selected.Their segregating offspring were selected continuously and the BC2F5populations were defined as population B.Owing to the two cycles of backcrossing,population B showed less variation than population A.The two populations were grown in a field using conventional management techniques.The most recently expanded leaves were selected for measurement at the heading stage.
2.2.Determination of gas exchange
The gas exchange parameters were determined on sunny, windless days from9:30 to 11:30 a.m.,using the LI-6400 portable photosynthesis system(LI-COR Inc.,Lincoln,NE,USA).Leaf temperature was controlled at 30°C and photon flux density was controlled at 1400μmol m-2s-1.Net photosynthetic rate (Pn),stomatalconductance(gs),intercellular CO2concentration (Ci),and transpiration rate(Tr)were recorded.Carboxylation efficiency(CE)was calculated as Pn/Ci[18,19].
2.3.Statisticalanalysis
All multivariate analyses and significance tests were conducted using SPSS 17.0(SPSS Inc.,Chicago,IL,USA).The K-means clustering method was used for cluster analysis.It differs from hierarchical clustering in several ways.First,the number of clusters is determined by rerunning the analysis for different numbers of clusters.Then,with the assigned cluster number,the maximum iterations are set at 50,the analysis is begun with an initial set of means,and cases are classified based on their distances from the centers.The algorithm repeatedly reassigns cases to clusters untilcluster means do notchange muchbetween successive steps.Finally,the algorithm calculates the means of the clusters once again andassigns the cases to their finalclusters.
3.Results
3.1.Classification of photosynthetic rate in the rice populations
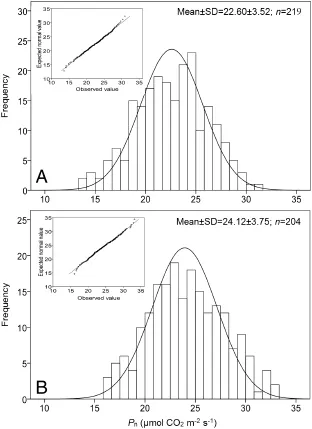
Fig.1–Normaldistribution of net photosynthetic rate in rice populations A and B.The main plot shows the histogram and the inset shows the Q–Q plot of Pn.In population A,the Pnvalues of the two parents are 25.5(YF2-1)and 41.4(Shennong 133)μmol CO2m-2s-1;in population A,the Pnvalues of the two parents are 24.5 and 34.3μmol CO2m-2s-1.

Table 1–Descriptive statistics of net photosynthetic rates in different groups.
The gas exchange parameters of 219 rice plants from population A and 204 plants from population B were determined.The Pnranged from 13.6 to 30.9μmol CO2m-2s-1and 16.1 to 33.2μmol CO2m-2s-1.The histogram of Pnand the Q–Q plot(relating the observed values to the expected normally distributed values) showed that the Pnof the measured rice populations was normally distributed(Fig.1-A and B).Normality tests using the Kolmogorov–Smirnov test also showed that the measured Pndata followed a normal distribution(P=0.936 and 0.740 respectively).
Using K-means clustering,the A and B populations were clustered into five or six groups,and a significant difference in Pnwas observed among the groups(P<0.05).Table 1 shows the ranges,averages,and coefficients of variation for Pnin the six groups G1–G6,with photosynthetic rates shown from high to low.Variation in Pnwas small within each group(Table 1), indicating that the clustered Pngroups were appropriate.
3.2.Photosynthetic patterns in the rice populations
The box diagram shows the variation in the main gas exchange parameters in each group in population A(Fig.2).In each group, the variation in Pnwas highest.For the other four parameters (gs,CE,Ciand Tr),the variation was low,as was that among the groups.From G1 to G6,the variation in gsdecreased with Pn, whereas variation in CE was higher in the low and high Pngroups and lower in the intermediate group.
The photosynthetic groups were furtherclustered by K-means clustering.The photosynthetic groups in each population were divided into three clusters according to their differences in gsand CE,namely the stomatal pattern(with higher gs),the carboxylation pattern(with higher CE),and the intermediate pattern(with medium gsand CE)(Table 2).The F-test showed no difference in Pnamong the three types,but a significant difference in gsand CE(P<0.01),indicating that the classification was reliable.However,the proportion of each pattern differed between the two populations(Fig.3)and among different Pngroups(Table 2).
3.3.Correlation analysis of Pnwith gsand CE
Pnwas significantly correlated with gs(r=0.810**and 0.687**in populations A and B)and CE(r=0.531**and 0.933**in population A and B)in both populations.The high correlation coefficients between Pnand CE indicate that photosynthetic rate was dominated by the carboxylation process in population B,whereas both stomataland biochemicalprocesses played an important role in Pnof population A.
The correlation coefficients were much higher when the three clusters with different photosynthetic patterns were examined(Fig.4),particularly that between Pnand CE in population A(Fig.4-B).This observation indicates that the classification of rice populations by the clustering method has biological meaning and is feasible.
4.Discussion
Correlation analysis is the mostcommon method used to analyze gas exchange parameter data.Pnalways correlates significantly with gs[15,20].A strong relationship between Pnand CE is also found during different wheat-growing periods[21]and among different soybean species[22].In rice,previous reports also showed significant correlation both between Pnand gs[5,23,24] and between Pnand CE[16,25,26].In the present study,linear regression analysis showed significant correlations between Pnand gsand between Pnand CE in both populations.However,the correlation coefficients differed between the two populations.The correlation in population A between Pnand gswas much higher than that between Pnand CE.There was a very high positive correlation between Pnand CE in population B.These differing relationships indicate several physiological differences in the photosynthesis of the two populations.
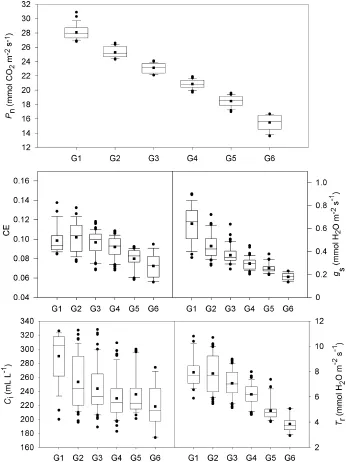
Fig.2–Variation of Pn,CE,gs,Ciand Trin the six groups in rice population A.■means of the data.●discrete data points. Verticalboxes with error bars show the 10th,25th,50th,75th and 90th percentiles of the data.
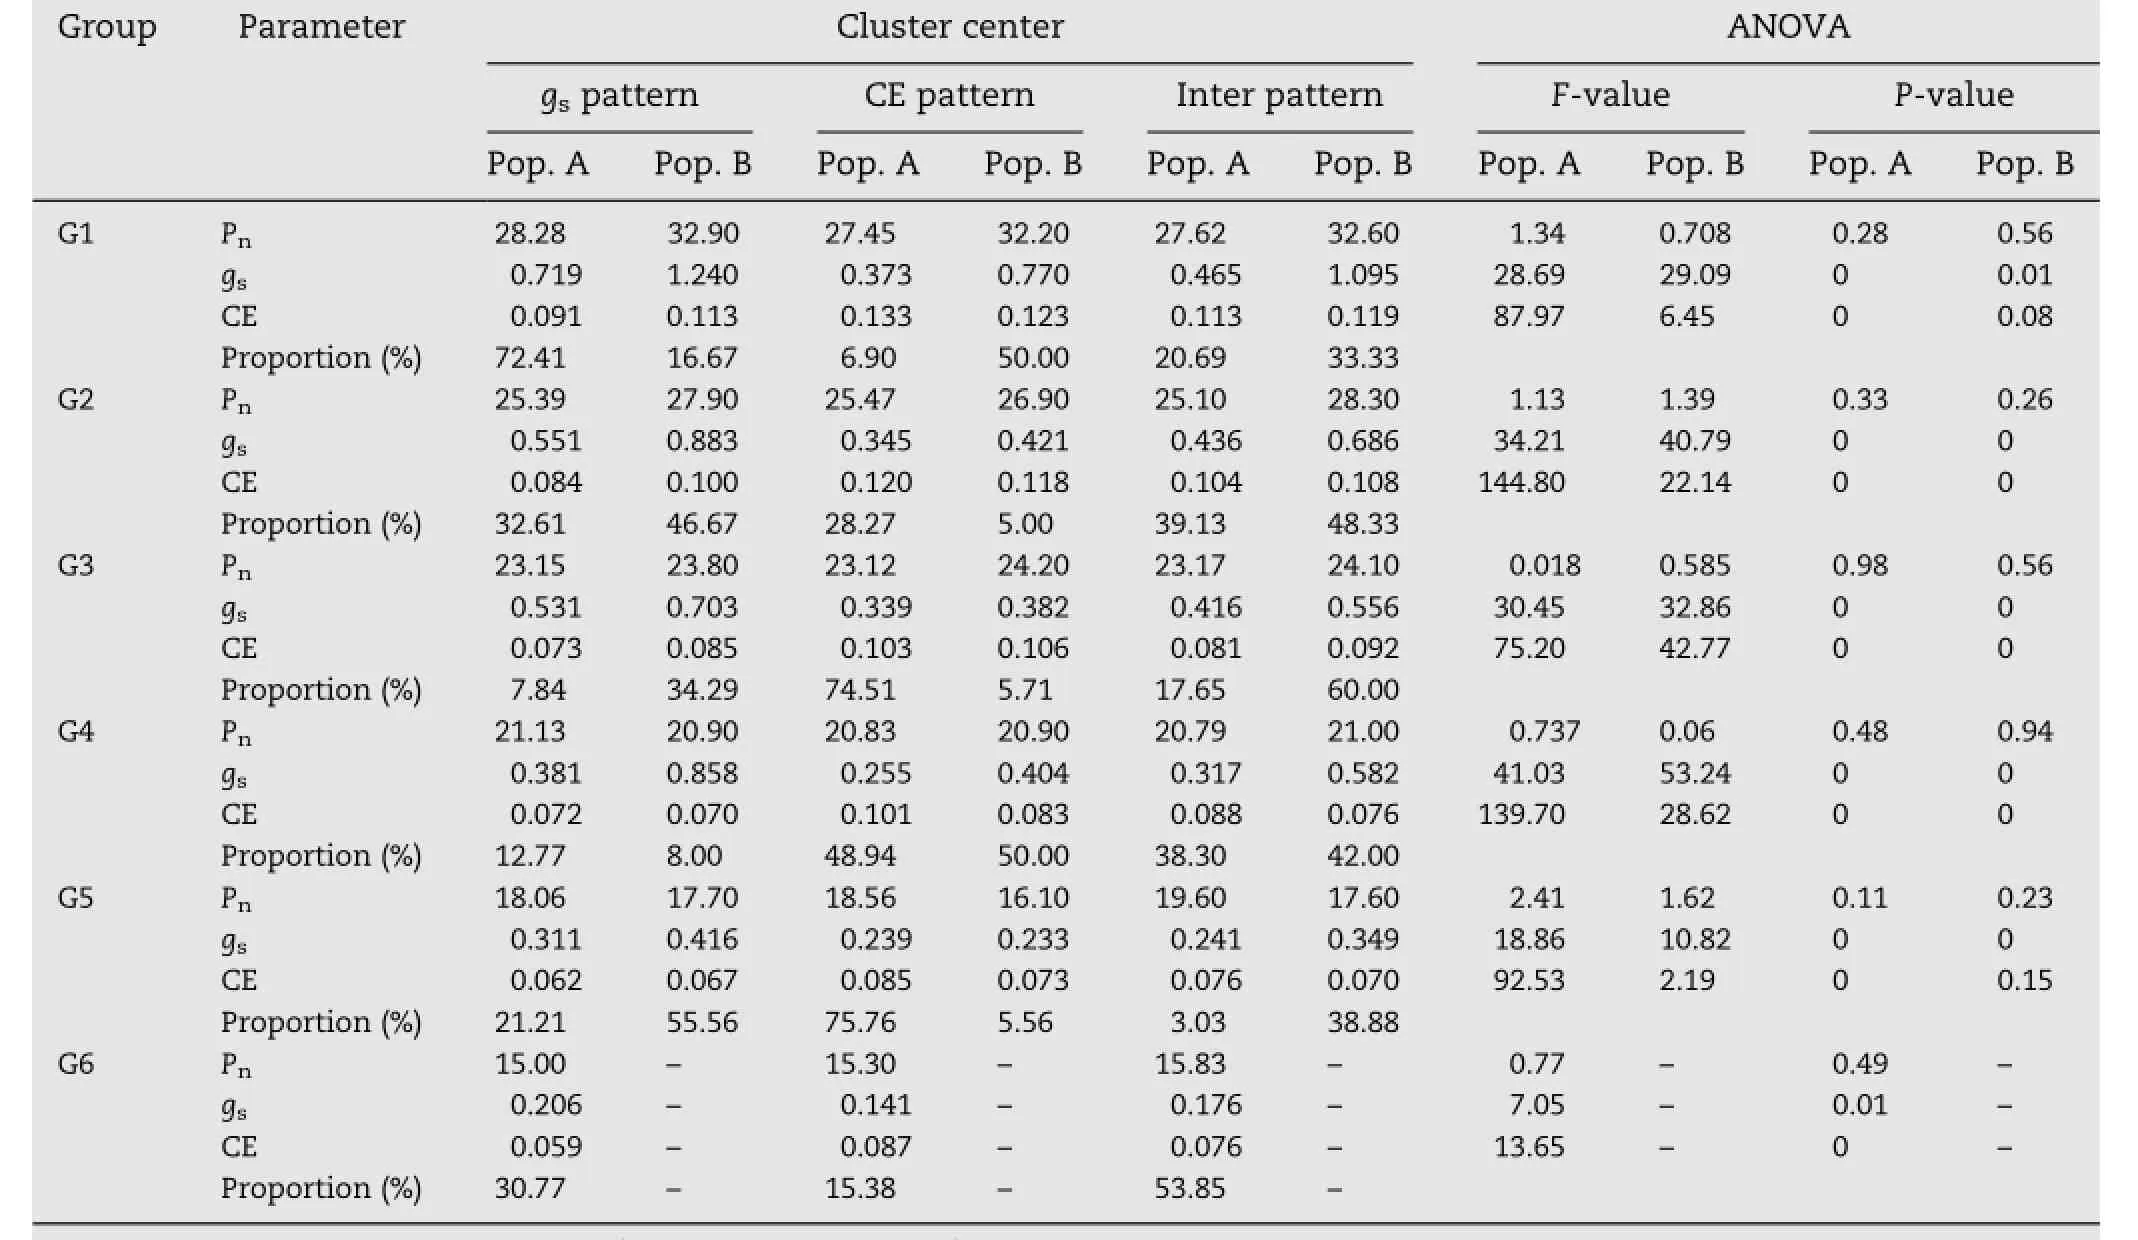
Table 2–Photosynthetic patterns and their proportions in different photosynthetic rates(Pn)groups in populations A and B.
When correlation analyses are based on a large number of species,correlation coefficients are often very low,although always significant.For example,in a study of 54 species of wheat[27],the highest correlation coefficient between Pnand gsduring three different periods was only 0.4365.In a study of 12 soybean species[28],the relationship between Pnand gsdiffered during different growth periods.The relationship between Pnand gsat the flowering stage showed a cubic polynomial curve fit,while at the later filling stage,it showed a linear fit(R2=0.68).In the present study,when correlations were calculated for three different photosynthetic patterns, significantly higher correlations were observed between Pnand gsor CE in each pattern(Fig.4).These correlations were much stronger than those for the whole population.Notably, the correlation between Pnand CE in population A was only 0.531,whereas the lowest correlation was 0.828 among the three photosynthetic patterns(Fig.4-B).These data indicate that the real correlation between Pnand other gas exchange parameters in rice is concealed by differences in the physiological patterns of photosynthesis.
The two rice populations were divided into three clusters with different photosynthetic patterns according to differences in gas exchange parameters:the stomatal pattern, carboxylation pattern,and intermediate pattern.However, the proportions of the three photosynthetic patterns differed between the two populations.In population B,Pnwas highly positively correlated with CE,but the CE pattern was shared by only 17.65%of the population.This finding indicates that Pnwas limited by lower CE in this population.NPT was developed at the IRRI with the aim of increasing the yield potential of rice by 2%–25%[29,30].However,the yield potential of NPT rice is limited by its lower photosynthetic rate[31–33].Hu et al.[23]showed that lower stomatal frequency and higher stomatal resistance are the main constraints on the photosynthetic rate of rice NPT lines.Our results showed that both gsand CE improved in the group with the highest Pnfollowing a cross with wild rice(Table 3).In fact,gswas improved in this population,but its improvement did not result in an increase in Pn,owing to weak improvement in CE.Both gsand CE were generally improved in population A.Perhaps without the backcrossing,the population maintained more of the diversity contributed by the cross with sorghum.
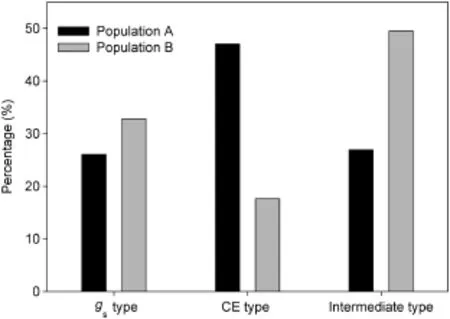
Fig.3–Proportions of three photosynthetic patterns in two rice populations.
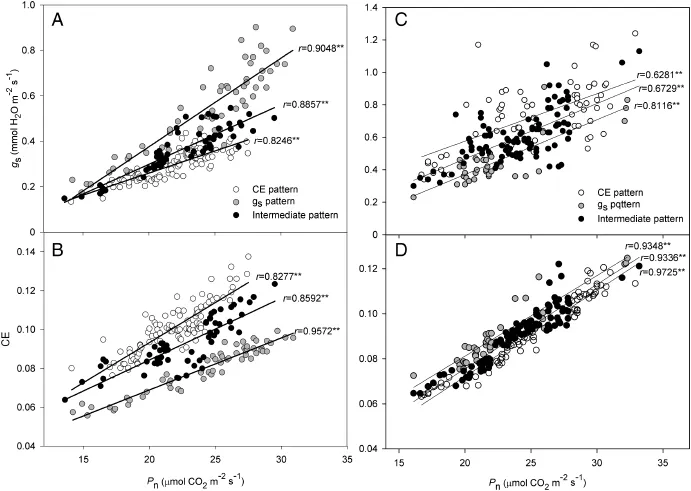
Fig.4–Correlation analysis of Pnwith gs(A,C)and CE(B,D)in the three clusters with different photosynthetic patterns in rice populations A(A and B)and B(C and D).
Our results will help guide the breeding of rice with high photosynthetic rates.Crossing rice lines with either the stomatal or carboxylation pattern will produce rice progeny with both high gsand high CE,and thus a high Pn.This strategy will make the increase in breeding efficiency more evident.But given that photosynthesis is sensitive to environmental stress,another question is which pattern is most beneficial to crops for overcoming stress and maintaining higher photosynthesis.The answer awaits further studiesof the response of rice plants with different photosynthetic patterns to various environmental stresses.
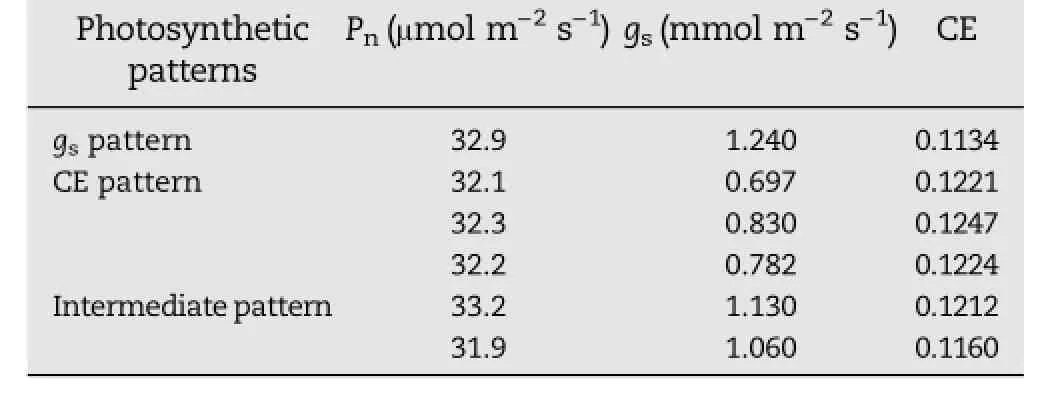
Table 3–Pn,gsand CE of the six plants in the group with highest photosynthetic rate(Pn)in rice population B.
5.Conclusions
Rice populations were divided by K-means clustering into three physiological patterns based on differences in gas exchange parameters.Higher correlation coefficients were observed between Pnand gsor CE in each cluster than in the fullpopulation. This finding indicates that clustering is very important for understanding factors limiting rice photosynthesis.
Acknowledgments
This study was funded by the National Basic Research Program of China(2009CB118605)and the National Natural Science Fund of China(30370853).
R E F E R E N C E S
[1]S.P.Long,X.G.Zhu,S.L.Naidu,D.R.Ort,Can improvement in photosynthesis increase crop yields?Plant Cell Environ.29 (2006)315–330.
[2]P.Horton,Prospects for crop improvement through the genetic manipulation of photosynthesis:morphologicalandbiochemical aspects of light capture,J.Exp.Bot.51(2000) 475–485.
[3]J.E.Sheehy,Limits to yield for C3and C4rice:an agronomist's view,in:J.E.Sheehy,P.L.Mitchell,B.Hardy(Eds.),Redesigning Rice Photosynthesis to Increase Yield,International Rice Research Institute/Elsevier,Makati City/Amsterdam,2000, pp.39–52.
[4]S.Peng,R.C.Laza,R.M.Visperas,A.L.Sanico,K.G.Cassman, G.S.Khush,Grain yield of rice cultivars and lines developed in the Philippines since 1966,Crop Sci.40(2000)307–314.
[5]S.Hubbart,S.Peng,P.Horton,Y.Chen,E.H.Murchie,Trends in leafphotosynthesis in historicalrice varieties developed in the Philippines since 1966,J.Exp.Bot.58(2007)3429–3438.
[6]T.C.Zheng,X.K.Zhang,G.H.Yin,L.N.Wang,Y.L.Han,L. Chen,F.Huang,J.W.Tang,X.C.Xia,Z.H.He,Genetic gains in grain yield,net photosynthesis and stomatal conductance achieved in Henan Province of China between 1981 and 2008, Field Crops Res.122(2011)225–233.
[7]M.Gutierrez-Rodriguez,M.P.Reynolds,A.Larque-Saavedra, Photosynthesis ofwheat in a warm,irrigated environment:II. Traits associated with genetic gains in yield,Field Crops Res. 66(2000)51–62.
[8]Q.Peng,Q.H.Guo,X.B.Zhang,D.G.Cheng,S.Dai,H.S.Li,S.J. Zhao,J.M.Song,Evolution in photosynthetic characteristics ofwheat cultivars widely planted in Shandong Province since 1950s,Sci.Agric.Sin.45(2012)3883–3891.
[9]T.Hirasawa,S.Ozawa,R.D.Taylaran,T.Ookawa,Varietal differences in photosynthetic rates in rice plants with special reference to the nitrogen content ofleaves,Plant Prod.Sci.13 (2010)53–57.
[10]D.Q.Xu,Some problems in stomatal limitation analysis of photosynthesis,Plant Physiol.Commun.33(1997) 241–244(in Chinese with English abstract).
[11]M.E.Yeo,A.R.Yeo,Photosynthesis and photorespiration in the genus Oryza,J.Exp.Bot.45(1994)553–560.
[12]M.Zhao,H.R.Lafitte,E.Sacks,G.Dimayuga,T.L.B.Acuna, Perennial O.sativa×O.rufipogon interspecific hybrids:I. Photosynthetic characteristics and their inheritance,Field Crop Res.106(2008)203–213.
[13]M.Zhao,Z.S.Ding,R.Lafitte,E.Sacks,G.Dimayuga,D.Holt, Photosynthetic characteristics in Oryza species, Photosynthetica 48(2010)234–240.
[14]Ohsumi,T.Kanemura,K.Homma,T.Horie,T.Shiraiwa, Genotypic variation of stomatalconductance in relation to stomatal density and length in rice(Oryza sativa L.),Plant Prod.Sci.10(2007)322–328.
[15]Makino,T.Mae,K.Ohira,Changes in photosynthetic capacity in rice leaves from emergence through senescence.Analysis from ribulose-1,5-bisphosphate carboxylase and leaf senescence,Plant Cell Physiol.25(1984)511–521.
[16]D.Y.Zhang,X.H.Wang,D.Q.Xu,Determinant of photosynthetic capacity in rice leaves under ambient air conditions, Photosynthetica 43(2005)273–276.
[17]F.W.Zhao,H.M.Li,D.C.Liu,A.M.Zhang,Germplasm inovation by hybridization between upland rice(O.sativa) and sorghum(S.bicolor),J.Nucl.Agric.Sci.20(2006) 106–109.
[18]J.Flexas,J.Gulías,S.Jonasson,H.Medrano,M.Mus,Seasonal patterns and control of gas exchange in local populations of the Mediterranean evergreen shrub Pistacia lentiscus L,Acta Oecol.22(2001)33–43.
[19]S.L.Niu,L.H.Li,G.M.Jiang,L.M.Gao,Y.G.Li,Y.Peng,M.Z.Liu, Gas exchange and chlorophyllfluorescence response to simulated rainfall in Hedysarum fruticosum var.mongolicum, Photosynthetica 42(2004)1–6.
[20]G.J.Hamlyn,Stomatalcontrol of photosynthesis and transpiration,J.Exp.Bot.49(1998)387–398.
[21]Q.F.Yang,H.Jiang,D.Q.Xu,Changes in photosynthetic efficiency of flag leaves of wheat during development,Acta Phytophysiol.Sin.25(1999)408–412(in Chinese with English abstract).
[22]H.Jiang,D.Q.Xu,The cause of the difference in leaf net photosynthetic rate between two soybean cultivars, Photosynthetica 39(2001)453–459.
[23]W.X.Hu,S.B.Peng,R.F.Gao,J.K.Ladha,Stomatalcharacteristics of New Plant Type rice developed by InternationalRice Research Institute,Sci.Agric.Sin.35(2002)1286–1290(in Chinese with English abstract).
[24]X.Q.Zhao,M.Zhao,J.T.Xiao,W.X.Zhang,D.M.Guan,M.Y. Wang,J.Lu,N.Zhan,Stomata characteristics of leaves of high-photosynthetic efficiency progenies from a cross between O.sativa and O.rufipogon and their parents,Acta Agron.Sin.29(2003)216–221(in Chinese with English abstract).
[25]H.Jiang,X.H.Wang,Q.Y.Deng,L.P.Yuan,D.Q.Xu,Comparison of some photosynthetic characters between two hybrid rice combinations differing in yield potential,Photosynthetica 40 (2002)133–137.
[26]Y.Chen,X.H.Wang,Y.Liao,S.Q.Cai,H.B.Zhang,D.Q.Xu, Effect of flag leaf orientation on its photosynthetic capacity in rice,J.Plant Physiol.Mol.Biol 28(2002)396–398(in Chinese with English abstract).
[27]Y.Yin,C.Zhang,F.Yao,Relationship of leaf photosynthetic rate with stomatal resistance and stomatal conductance to CO2in wheat cultivars,Acta Agron.Sin.21(1995) 561–567(in Chinese with English abstract).
[28]M.You,J.Gai,Y.Ma,S.Jodo,Relationship of leaf photosynthetic rate with stomatal and mesophyll conductance in soybeans,Acta Agron.Sin.21(1995) 146–149(in Chinese with English abstract).
[29]G.S.Khush,S.Peng,in:M.P.Reynolds,S.Rajaram,A.McNab (Eds.),Increasing Yield Potential in Wheat:Breaking the Barriers,International Maize and Wheat Improvement Center,Batan Mexico,1996,pp.36–51.
[30]P.S.Virk,G.S.Khush,S.Peng,Breeding to enhance yield potential of rice at IRRI:the ideotype approach,Int.Rice Res. Notes 29(2004)5–9.
[31]W.X.Hu,S.B.Peng,R.F.Gao,J.K.Ladha,Photosynthetic efficiency of a new plant type of rice developed by the international rice research institute,Sci.Agric.Sin.38(2005) 2205–2210(in Chinese with English abstract).
[32]E.H.Murchie,S.Hubbart,Y.Chen,S.Peng,P.Horton, Acclimation of rice photosynthesis to irradiance under field conditions,Plant Physiol.130(2002)1999–2010.
[33]E.H.Murchie,J.Yang,S.Hubbart,P.Horton,S.Peng,Are there associations between grain-filling rate and photosynthesis in the flag leaves of field-grown rice?J.Exp.Bot.53(2002) 2217–2224.
Abbreviations:Pn,net photosynthetic rate;gs,stomatal conductance;CE,carboxylation efficiency.
*Corresponding author.
E-mailaddresses:dingzaisong@caas.cn(Z.Ding),zhaoming@caas.cn(M.Zhao).
Peer review under responsibility of Crop Science Society of China and Institute of Crop Science,CAAS.
2214-5141/$–see front matter©2013 Production and hosting by Elsevier B.V.on behalf of Crop Science Society of China and Institute of Crop Science,CAAS.
http://dx.doi.org/10.1016/j.cj.2013.12.003
- The Crop Journal的其它文章
- Induction of avirulence by AVR-Pita1 in virulent U.S. field isolates of Magnaporthe oryzae,
- Molecular characterization ofα-gliadin genes from common wheatcultivar Zhengmai004 and their role in quality and celiac disease
- Near-infrared spectroscopy(NIRS)evaluation and regionalanalysis of Chinese faba bean(Vicia faba L.)
- Integration of QTL detection and marker assisted selection for improving resistance to Fusarium head blight and important agronomic traits in wheat
- Yield and tillering response of super hybrid rice Liangyoupeijiu to tillage and establishmentmethods
- BRIEF GUIDE FOR AUTHORS

