Modified Pressure Loss Model for T-junctions of Engine Exhaust Manifold
WANG Wenhui,LU Xiaolu,CUI Yi,and DENG Kangyao*
Key Laboratory for Power Machinery and Engineering of Ministry of Education,Shanghai Jiaotong University,Shanghai 200240,China
1 Introduction*
The T-junction is a common structure in air intake and exhaust pipe systems,in which complex,three-dimensional flow exists.To apply a one-dimensional,unsteady flow method to simulate the intake and exhaust flows and the overall engine performance,a suitable boundary model of the T-junction must be established to provide boundary conditions for the one-dimensional simulation.The precision of the junction model directly affects the simulation accuracy of one-dimensional,unsteady flow in an internal combustion engine.
First,BENSON[1]proposed a constant pressure model for the pipe junction.The method assumes that the pressures at the end of each pipe of the junction are the same.To further improve the calculation precision by considering a pressure drop or increase at the junction,BENSON developed the pressure loss model,which is still widely used(also known as the momentum model).Although the pressure loss model is more precise,it contains undetermined coefficients that must be obtained from wind tunnel experiments.BENSON applied this model to solve one-dimensional flow in an engine exhaust system and concluded that the pressure loss model was more similar to the actual condition than the constant pressure model.Thus,the pressure loss model is widely used to study a variety of exhaust systems[2–3].Based on the theoretical derivations of BASSETT and other researchers[4–6],the total pressure loss coefficient formula for a variety of flow types of the T-junction has been determined.However,during the derivation process,researchers have neglected the compressibility of air.When the gas flow velocity is large,the deviation between computed and experimental results will be greater.
Several recent works[7–11],have examined the energy loss for steady junction flow.OKA A K and ITO H[7]experimentally investigated the performance of flow for steady internal flow in a 45-degree junction.As a part of their work,the effects of the flow rate ratios,branch angle and Reynolds number were examined.PAUL J and SELAMET A[9]determined a formula to calculate the total pressure loss coefficients of a T-junction based on an air suction experiment.
3D numerical simulations can also predict junction flow.The most notable works are those by TANG Jinglin,et al[12],HORII Y,et al[13],and LU Tao,et al[14].TANG Jinglin,et al[12],carried out numerical investigations of resistance characteristics of hydraulic oil in T-type duct with sharp corners.They conclude that for combined flows the resistance loss of symmetrical is lower than that of unsymmetrical to obtain low speed in common branch,but to gain high speed is quite the contrary.LU Tao,et al[14]studied temperature fluctuations caused by thermal mixing of hot and cold water in a tee junction using Large-eddy simulation(LES)turbulence model.They found that the mean and fluctuating temperatures are in good agreement with the previous experimental data.
However,in all of those works,the results also assumed incompressible flow because the experiments and simulations were performed within narrow speed ranges.PEREZ-GARCIA,et al[15–17]performed an experimental study on the pressure loss model for a T-junction with a uniform cross-section.In the experiment,the researchers used compressed air with a high Mach number.However,the geometric parameters of the junction were not considered,and the inner diameter of the three branches of the junction was only 12 mm,which is completely different from the inner diameter of actual exhaust pipes in engines.
At present,there are no good universal experimental data or empirical formula that considers high velocities and compressible gas flow in the T-junction of engine exhaust manifolds.The existing models have a greater computational accuracy when the flow velocity is low,though the discrepancy becomes large as the flow velocity increases.At the initial stage of turbocharging technology,satisfactory results had been obtained by adopting the previously used pressure loss model because the exhaust gas velocity was comparatively low.However,with the improvement of turbocharging technology,the gas flow velocity in the exhaust pipes is increasing gradually.The limitations of the past pressure loss model becomes more and more obvious.
This paper focuses on how to improve the precision of the pressure loss model.Through a cold wind tunnel experiment to study the T-junction of a diesel engine exhaust manifold,this paper obtains the total pressure loss at higher flow velocities at engine operation conditions and established the modified pressure loss model that considers gas compressibility.The calculated pressure before the turbine shows that the error of the new pressure loss model is reduced by 4.3% compared with that of the old model.
2 Measurement of the Total Pressure Loss Coefficient
To obtain the total pressure loss coefficient of the T-junction under a relatively high flow velocity,the test bench,as shown in Fig.1,was built.The direction of flow is from right to left,and air is introduced into the main manifold of the test pipeline system by the compressor.The air separates into two streams before reaching the two flow control valves,then flows into branch 1 and branch 2 of the T-junction in the measurement section and finally flows out through branch 3 after being mixed in the T-junction.
In the experiment,an oblique triangle with the“T-shaped”junction was designed and made from stainless steel,as shown in Fig.2.The internal walls of the junction are all polished to reduce friction.The lengths of branch 1,branch 2 and branch 3 are all 650 mm.The internal diameter of branch 1 is 66 mm,and those of branch 2 and branch 3 are both 85 mm.The angle between branch 1 and branch 2 is 45°.The measurement points of pressure sensor 1,differential pressure sensor 1 and differential pressure sensor 2 on the T-junction are all 255 mm away from the connecting boundary of the branch.
The main manifold after the compressor shown in Fig.1 has a Pitot-tube flow meter installed to measure the mass flow.This flow meter consists of four parts,which are the Pitot tube,pressure sensor 3,differential pressure sensor 3 and temperature sensor 4.A hot-film gas mass flow sensor is installed behind flow control valve 2 to measure the gas mass flow in branch 2.The mass flow rate of branch 1 is Q1,which is the difference between Q3and Q2.
Differential pressure sensor 1 is used to measure the static pressure difference between branch 1 and branch 3.Differential pressure sensor 2 is used to measure the static pressure difference between branch 2 and branch 3.The static pressure p1of branch 1 is measured by pressure sensor 1.The static pressure p3of branch 3 is calculated from the measured data of p1and using differential pressure sensor 1.The static pressure p2of branch 2 is calculated from the measured data of p3and using differential pressure sensor 2.Temperature sensors 1,2 and 3 are installed to measure the gas temperature inside branches 1,2 and 3,respectively.
The details of these sensors,such as the model number,measurement method,measurement range and accuracy,are shown in Table 1.The output signals of the sensors are the voltage signal,which was collected using an MP426 high-speed data acquisition card.The sampling frequency of the MP426 was 1 KHz.

Table 1.Sensor details
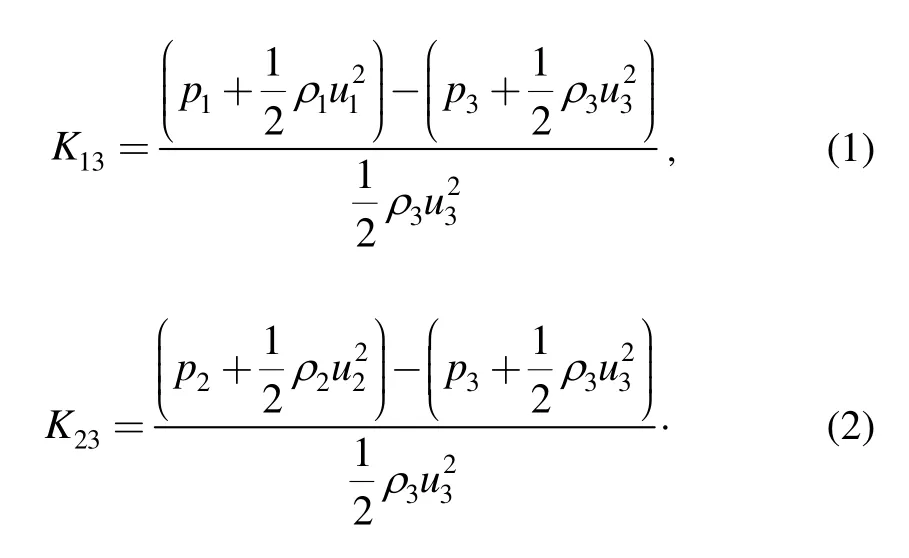
According to the actual gas state equation,the gas densities ρ1,ρ2and ρ3inside the three branches of the T-junction can be obtained.Furthermore,according to the definition of mass flow,the average speeds u1,u2and u3of the sections can be obtained.Finally,the total pressure loss coefficients K13and K23are obtained according to Eqs.(1)and(2),respectively:

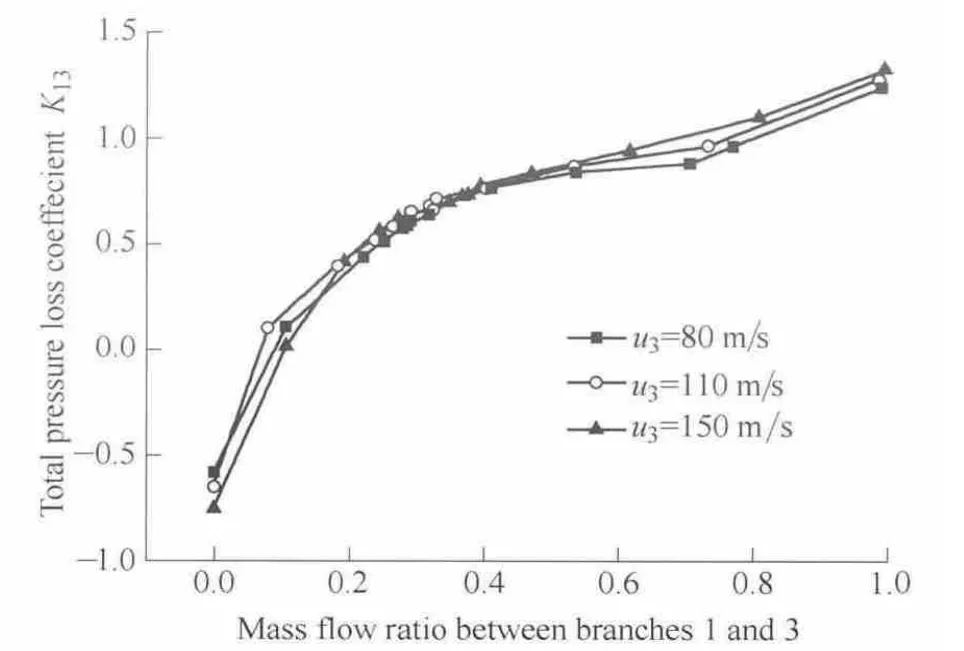
In the experiment,the air velocity in the main pipe can be adjusted by controlling the speed of compressor.Three air velocities in the main pipe were tested:80 m/s,110 m/s and 150 m/s.Under each experimental condition,the gas flux within branches 1 and 2 was adjusted by controlling valves 1 and 2.
As observed from Figs.3 and 4,the variation trends of the total pressure loss coefficients under the three velocities are the same.When u3is constant,the total pressure loss coefficient K13becomes larger as the mass flow ratio between branches 1 and 3 increases;the total loss coefficient K23increases first and then decreases as the mass flow ratio increases.It is should be noted that several pressure loss coefficients are negative.For example,if the inflow is not disrupted by the junction interface where Q1/Q3=0,the flow is the same as straight duct flow such that the total pressure loss is at a minimum,which results in the negative values shown in Fig.3.This result is caused by p01being lower than p03as a result of the dynamic pressure.To confirm the result,the overall loss coefficient Ktis defined as

Clearly,the overall coefficient Ktis always positive in all cases to not defy the Second Law of Thermodynamics.

Fig.3.Comparison of the total pressure loss coefficient from branches 1 to 3

Fig.4.Comparison of the total pressure loss coefficient from branches 2 to 3
3 Comparison between the Calculated and Measured Total Pressure Loss Coefficients
The momentum equation at the T-junction is

The formula of the total pressure loss coefficient KijLcan be derived from Eqs.(1),(2)and(4):

where i and j are branch numbers,and Cijis the momentum coefficient and can be regarded as a constant of 0.9.
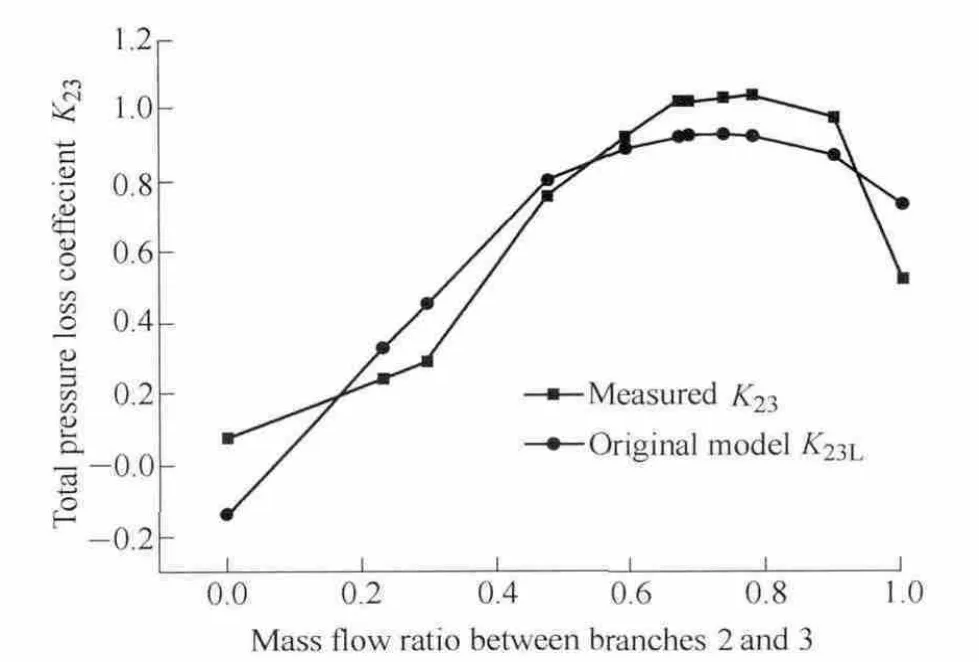
With the flow velocity in branch 3 set at u3=80 m/s in branch 3,the comparison between the total pressure loss coefficients K13Land K23Lcalculated by Eq.(5)and the total pressure loss coefficients K13and K23determined by the experiment are shown in Figs.5 and 6,respectively.
In Fig.5,the experimental values of the total pressure loss coefficient are larger than the calculated coefficients,though the differences are small.Under different mass flow ratio conditions,the maximum difference is less than 0.3.In Fig.6,the maximum difference between K23and K23Ldoes not exceed 0.21 when the mass flow ratio changes from 0 to 1

Fig.5.Comparison of the total pressure loss coefficient from branches 1 to 3 when u3=80 m/s

Fig.6.Comparison of the total pressure loss coefficient from branches 2 to 3 when u3=80 m/s
As can be observed from Figs.5 and 6,the variation tendencies of the total pressure loss coefficients K13and K23derived from the experiment and K13Land K23Lobtained by the original model are consistent.The discrepancy between the experiments and simulation is acceptable for engineering calculations.The original pressure loss model can still be considered the boundary model for onedimensional flow calculations when u3is less than 80 m/s.
Figs.7 and 8 show the comparison between the total pressure loss coefficients K13Land K23Lderived by the original pressure loss model and K13and K23obtained from the experiment when u3=150 m/s.As shown in Fig.7,K13is much larger than K13L.When the flow ratio is 0.2,the largest difference between the two is approximately 0.72.
From Figs.5 and 7,when the flow velocity u3varies,the differences between the total pressure loss coefficient K13derived from the experiment and the total pressure loss coefficient K13Lderived from the original model also differ.As the flow velocity u3increases,the differences become larger.The same trend exists between K23and K23L,which is primarily because the previous pressure loss model does not consider the influence of larger air flow velocities,i.e.,the influence of air compressibility is not considered.The larger the gas flow velocity u3is,the larger the difference between the results from the previous model and the experiments is.

Fig.7.Comparison of the total pressure loss coefficient from branches 1 to 3 when u3=150 m/s
4 General Equation of the Total Pressure Loss Coefficient under Higher Flow Velocity
The general equation of the total pressure loss coefficient can be obtained under a relatively high velocity by directly fitting differences between the calculated and the measured values in Figs.7 and 8.However,Eq.(5)does not include the junction's structure parameters,such as the branch angle and area ratio,which means the model is not universal and can only be applied to a specific type of T-junction.
For high-speed flow,dimensional analysis and open literature[15]allow us to deduce that the total pressure loss coefficient is a function of the mass flow ratio,area ratio,branch angle and velocity in the main duct.However,establishing a pressure loss model for the T-junction with many parameters is a complex task and a time-consuming process that requires the junction to be manufactured before its loss characteristics can be measured.Hence,to improve the precision of the pressure loss model,particularly at the high-speed junction flow,the following method is proposed.
The method is based on the assumption originally made by MORIMUNE,et al[18]that the velocity influence on the loss coefficient is independent.
where b—Branch pipe,
m—Main duct.
To consider the geometrical parameters and flow parameters and obtain the general expression of the loss coefficient,in this procedure,f1is obtained using the Vazsonyi equation[19].
When the air flow velocity is low,there are many experimental data and empirical formulas that can be used.Among them,the Vazsonyi equation is believed to be concise and reliable.The geometrical parameters of the pipe junction are considered in this equation.The concrete forms of the Vazsonyi equation for the flow conditions studied in this article can be expressed by the following equations:
where α—Branch angle,
α′—Modified angle,α′=1.41α-0.005 94α2,
F1/F3,F2/F3—Area ratios,
λ—Formula coefficient.
Next,we must take into account the procedure of f2,and thus,the following data processing method is described.First,calculate the extrapolated flow parameters ρ,p,and u from the friction coefficient and the measured data according to the steady,one-dimensional adiabatic flow model.Secondly,for each velocity case(u3),calculate the total pressure loss coefficients K13and K23(Eqs.(1),(2))and K13-Vand K23-V(Eqs.(7),(8)).Then,obtain the difference between K13and K13-Vand K23and K23-V,namely ΔK13and ΔK23.Finally,fit the difference about the velocity;the practical correlations are presented in Eqs.(10)and(11):

where u—Velocity in the main manifold.
As observed from Fig.9,there is certain discrepancy between the total pressure loss coefficients derived by the Vazsonyi equation and the experiment because the Vazsonyi equation does not consider the influence of fluid compressibility;its result is acceptable only when flow velocities are low.When the flow velocities are high,the impact losses generated by flow mixing of the two streams in the junction are large,and the measured pressure losses are relatively high.When the flow velocity in branch 3 is constant,by averaging the differences between the predictions from the Vazsonyi equation and the experimental results,the general calculation equations of the total pressure loss coefficient differences ΔK13and ΔK23can be expressed as follows.

Fig.9.Comparison of the total pressure loss coefficient from branches 1 to 3 when u3=150 m/s
When the air velocity in branch 3 is less than 80 m/s,the total pressure loss coefficient can be calculated by Eqs.(7)and(8);when the air velocity in branch 3 is between 80 and 150 m/s,the total pressure loss coefficients K13and K23can be obtained by the following two correction equations:

Eqs.(7)and(8)consider the gas flow velocity.The comparisons between the test,Vazsonyi equation and the general equation are illustrated in Fig.9.It can be observed that the total pressure loss coefficients calculated by the general expression agree extremely well with the experimental values when the airflow velocity in branch 3 is 150 m/s.
5 Modified Pressure Loss Model
As observed in Fig.5,a significant discrepancy is observed between the measured values and the original model when the flow velocity is u3=80 m/s in branch 3.To improve the applicability of the new model,the velocity critical point will expand to u3=60 m/s.
When the gas flow velocity is less than 60 m/s,the junction boundary model is the original pressure loss model.When the gas flow velocity is greater than the 60 m/s,the original model gradually becomes the modified pressure loss model.Therefore,a distribution function f(u)is introduced here:

where u represents the gas flow velocity in the main pipe;α represents the distribution indicator,which is 30 in the calculation.Fig.10 presents the curve of the distribution function f(u).
The basic equation of the modified pressure loss model is as follows.
Continuity equation:

Pressure loss equations:

where A=1-f(u3),B=f(u3),
C13,C23—Momentum coefficients of the original pressure loss model,
K13,K23—Calculated from Eqs.(12)and(13).
Energy Equation(joining flows):

Energy Equation(separating flows):

6 Model Validation
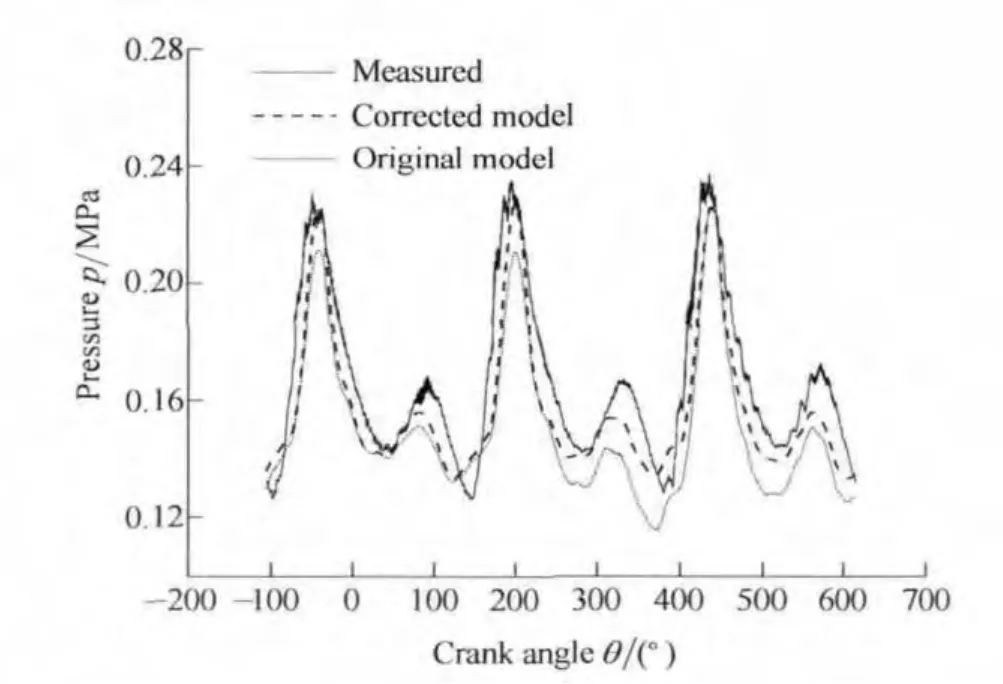
To validate the model,the modified pressure loss model is used as the T-junction boundary conditions in one-dimensional cycle simulation code based on the ENO-FVM method[20].The simulation code is adopted to study the gas flow and performance of a D6114 diesel engine.For further details on this test work,see Refs.[21–22].Figs.11,12 and 13 are the comparisons between the calculated and measured values of the pressure wave before the turbine under the working conditions of 100%load,50% load and 25% load,respectively,at 1300 r/min.

Fig.11.Pressure wave before the turbine when 1300 r/min at 100% load

Fig.12.Pressure wave before the turbine when 1300 r/min at 50% load
It can be observed from the figures that the simulation precision of the modified pressure loss model increased by 4.8%,4.2% and 3.9% with 100%,50% and 25% loads,respectively,compared with the original model.Under the three conditions,the average improvement of the simulation precision is 4.3%.The precision indicates the average error between the calculated and measured values in a working cycle(720 CA).Compared with the measured values,the modified pressure loss model has a higher accuracy than the original pressure loss model.
7 Conclusions
(1)According to the T-junction flow studied,when the air flow velocity in branch 3 is fixed,the total pressure loss coefficient K13increases as the mass flow ratio increases,whereas K23first increases and then decreases as the mass flow ratio increases.
(2)The original pressure loss model causes large errors under high flow velocities.The trends of the total pressure loss coefficients calculated by the original pressure loss model are the same as those from the experiments,though numerical differences still exist.In the case when u3=80 m/s in branch 3,there are no large differences between the measured and calculated total pressure loss coefficients.When u3=150 m/s,there are relatively large differences between the measured and calculated values.
(3)Based on the Vazsonyi formula,the general formulas of the total pressure loss coefficients are obtained.By introducing the distribution function,the modified pressure loss model,which considers the effect of gas compressibility,is established.
(4)Through experimental verification,this study shows that the calculation accuracy of the pressure wave before the turbine increases by 4.3% when the modified pressure loss model is used in one-dimensional cycle simulation code.
[1]BENSON R S.The Thermodynamics and gas dynamics of internal combustion engines Vol.1[M].UK:Oxford University Press,1982.
[2]WINTERBONE D E,PEARSON R J.Design techniques for engine manifolds—Wave action methods for IC engines[M].UK:Professional Engineering Press,1999.
[3]CHRISTIAN A,SELAMET K D,MIAZGOWICZ K V.Flow losses at circular T-junctions representative of intake plenum and primary runner interface[C]//SAE Technical Paper Series,2004,2004-01-1414.
[4]BASSETT M D,PEARSON R J,FLEMING N P,et al.A multi-pipe junction model for one dimensional gas-dynamic simulations[C]//SAE Technical Paper Series,2003,2003–01–0370.
[5]BASSETT M D,FLEMING N P,PEARSON R J.Calculation of steady flow pressure loss coefficients for pipe junctions[J].Proceedings of the Institution of Mechanical Engineers,Part C,2001,215(1):861–881.
[6]BASSETT M D,FLEMING N P,PEARSON R J.Modeling engines with pulse converted exhaust manifolds using one-dimensional techniques[C]//SAE Technical paper series,2000,2000-01-0290.
[7]OKA A K,ITO H.Energy losses at tees with large area ratios[J].Transactions of ASME,Journal of Fluids Engineering,2005,127(1):110–116.
[8]TILLY A,SOUSA J M M.An experimental study of heat transfer in a two-dimensional T-junction operating at a low momentum flux ratio[J].International Journal of Heat and Mass Transfer,2008,51(1):941–947.
[9]PAUL J,SELAMET A.Combining flow losses at circular T-junctions representative of intake plenum and primary runner interface[C]//SAE Technical Paper Series,2007,2007-01-0649.
[10]NAEIMI H,DOMIRY G D,GORJI M,et al.A parametric design of compact exhaust manifold junction in heavy duty diesel engine using computational fluid dynamics codes[J].Thermal Science,2011,15(4):1023–1033.
[11]HONG S W,KIM C.A new finite volume method on junction coupling and boundary treatment for flow network system analyses[J].International Journal for NumericalMethodsin Fluids,2011,65(1):707–742.
[12]TANG Jinglin,WANG Liwei,LI Xia.Resistance characteristics of hydraulic oil through isodiametric T-type duct with sharp corners[J].Chinese Journal of Mechanical Engineering,2009,22(2):250–255.
[13]HORII Y,ASAKO Y,HONG C,et al.Pressure loss of gaseous flow at a micro-tube outlet[J].Proceedings of the Institution of Mechanical Engineers,Part C,2011,225(3):649–657.
[14]LU Tao,WANG Yongwei,WANG Kuisheng.Large-eddy simulation of fluid flow and heat transfer in a mixing tee junction[J].Chinese Journal of Mechanical Engineering,2012,25(2):1144–1150.
[15]PEREZ-GARCIA J,SANMIGUEL-ROJAS E,VIEDMA A,et al.Numerical and experimental investigations on internal compressible flow at T-type junctions[J].Experimental Thermal and Fluid Science,2006,31(1):61–74.
[16]PEREZ-GARCIA J,SANMIGUEL-ROJAS E,VIEDMA A.New coefficient to characterize energy losses in compressible flow at T-junctions[J].Applied Mathematical Modeling,2010,34(1):4289–4305.
[17]PEREZ-GARCIA J,SANMIGUEL-ROJAS E,VIEDMA A.New experimental correlations to characterize compressible flow losses at 90-degree T-junctions[J].Experimental Thermal and Fluid Science,2009,33(1):261–266.
[18]MORIMUNE T,HIRAYAMA N,MAEDA T.Study of compressible high speed gas flow in piping system[J].Bulletin of the JSME,1981,124(198):2082–2089.
[19]VAZSONYI A.Pressure loss in elbows and duct branch[J].Transaction s of the ASME,1944,4(1):177–183.
[20]LU Xiaolu,DENG Kangyao.The study of essential non-oscillatory finite volume method in one-dimensional unsteady intake and exhaust flows[J].Chinese Internal Combustion Engine Engineering,2013,34(2):52–57.(in Chinese)
[21]ZHANG Zhe,DENG Kangyao,WANG Zhenbiao,et al.Experimental study on the three-phase sequential turbocharging system with two unequal size turbochargers[C]//SAE Technical Paper Series,2008,2008-01-1698.
[22]ZHANG Zhe,WANG Xibo,DENG Kangyao.Effects of sequential turbocharging system on performances of D6114 diesel engine[J].Transactions of the Chinese Society for Agricultural Machinery,2008,39(5):30–35.(in Chinese)
 Chinese Journal of Mechanical Engineering2014年6期
- Chinese Journal of Mechanical Engineering的其它文章
- Basic Characteristics of a New Flexible Pneumatic Bending Joint
- Effect of Spine Motion on Mobility in Quadruped Running
- Curvature Theory for Point-Path and Plane-Envelope in Spherical Kinematics by New Adjoint Approach
- Fatigue Life Prediction under Service Load Considering Strengthening Effect of Loads below Fatigue Limit
- Stabilizing Mechanism and Running Behavior of Couplers on Heavy Haul Trains
- Application of Improved Hybrid Interface Substructural Component Modal Synthesis Method in Vibration Characteristics of Mistuned Blisk
