
Simulation on the spatio-temporal distribution and emission flux of dust aerosol over East Asia in 2000-2009
2013-12-15 05:55XingTaoSuHanJieWangHengRuiTaoLieShuangLiuHongFengZhang
XingTao Su ,HanJie Wang ,HengRui Tao ,LieShuang Liu ,HongFeng Zhang
1.Beijing Institute of Applied Meteorology,Beijing 100029,China
2.Institute of Meteorology and Oceanography,PLA University of Science and Technology,Nanjing,Jiangsu 211101,China
3.Key Laboratory of Regional Climate-Environment Research for Temperate East Asia,Chinese Academy of Science,Beijing 100029,China
4.Aviation University of Air Force,Changchun,Jilin 130022,China
5.Atmospheric and Oceanic Sciences,Department of Physics,Peking University,Beijing 100871,China
6.Guizhou Air Traffic Control Bureau of CAAC,Guiyang,Guizhou 550012,China
7.EAAF Institute of Aeronautical Meteorology and Chemical Defense,Beijing 100085,China
1 Introduction
Dust aerosol,generated by wind erosion of soil particles,has been recognized as playing a major impact on atmospheric radiation balance and climate.However,the uncertainty of this impact is most prominent in all known climate forcing factors.Dust aerosol can not only directly impact climate by absorbing and scattering solar radiation,but also indirectly by acting as cloud condensation nuclei (CCN) and ice nuclei (IN).In addition,dust aerosol can also make clouds warmer,which could enhance cloud droplet evaporation and further reduce the cloud water path,namely the so-called "semi-direct effect".Dust aerosol influences climate in these three ways,and climate change in turn affects the dust’s natural cycle process such as emission strength,location,transmission and path.Dust also can be used as the reaction interface of atmospheric gases (Denteneret al.,1996) and photochemical process(Dickersonet al.,1997).Dust is considered to play an important role in marine biogeochemical processes,because trace metals contained in the dust is essential to some marine biological processes.Dust is also one of the sources of iron in the ocean,and iron may be a limiting factor for certain sea plankton nutrients (Funget al.,2000),thus dust can adjust the global carbon cycle (Prosperoet al.,2002).In addition,dust concentration in deep-sea sedimentation and ice cores are often used as an indicator of continental paleoclimatic drought and wind system change (Kohfeld and Harrison,2001),so dust also plays an important role in paleoclimate research.Thus,dust has been recognized as one of the core topics of current Earth-climate system variation.
In recent years,Chinese scholars have performed research in long time scale variation of spatio-temporal distribution and emission intensity of dust over East Asia.Using the NARCM (Northern Aerosol Regional Climate Model)model,Gonget al.(2003) and Zhaoet al.(2003) studied Asian dust in the spring of 2001.Their results show that East Asian deserts released approximately 252.8 Tg of dust in the spring of 2001,of which about 60% was produced from four dust storms;dust removal process was mainly attributed to dry deposition in the source areas,and wet deposition in the trans-Pacific transport.Zhanget al.(2003b) also used the NARCM model to simulate Asian dust from 1960 to 2002.Their results indicated that deserts in Mongolia and in western and northern China contributed about 70% of the total dust emissions;non-Chinese sources accounted for about 40%;meteorology and climate had a greater influence on the Asian dust emissions and associated Asian dust storm occurrences than desertification.Using a Regional Climate Model (RegCM3),Zhanget al.(2009) also obtained some meaningful conclusions.
Using different approaches,some scholars have estimated Asian or East Asian dust emission and deposition intensities.Using two United States Environmental Protection Agency (US EPA) formulas,Xuan (1999) and Xuanet al.(2000) found that the dust emission rate in the area increased from east to west by five orders in northern China.Through the analysis of tracer elements in dust,Zhanget al.(1997) found that about 800 Tg of Chinese desert dust was injected into the atmosphere annually;about 30% of this was re-deposited onto the deserts,20% was transported over regional scales,primarily within continental China;the remaining 50% of the dust was subject to long-range transport to the Pacific Ocean and beyond.Liuet al.(2003) used the US Navy’s operational Coupled Ocean/Atmospheric Mesoscale Prediction System (COAMPS),coupled with a comprehensive dust aerosol model,to estimate the dust emissions of Asian dust storms of April 5-15,2001.The mass budget calculation for the entire simulation period revealed that about 75% of total dust production was re-deposited onto the Asian deserts,20% fell onto non-desert areas through dry and wet deposition,and only 1.6% fell into the China and Japan seas.By studying typical surface soil samples,Meiet al.(2004)discovered that dust emissions on different soil surface types in northern China were 10-1,000 μg/(m2·s).
In general,there have been considerable studies on East Asian dust,but mostly aimed at several dust storms or only to the horizontal distribution characteristic in short time scale.The spatio-temporal distribution and emission intensities in longer time scale (inter-annual or inter-decadal) are not sufficient,and this has great significance for the study of climate effects.In addition,the assessment of East Asian dust emission is highly uncertain due to the use of different methods or models from the previous review.Therefore,in the present study we use a regional climate model RegCM3,coupled with an online dust module,to further study the spatio-temporal distribution and emission intensity of dust aerosol over East Asia from 2000 to 2009.
2 Model description and experiment design
2.1 Model and dust module description
RegCM3 is a third-generation regional climate model of the International Center for Theoretical Physics (ICTP),developed from RegCM and RegCM2.The CCM3 (Community Climate Model) radiation scheme has been introduced into RegCM3,and one of the main improvements is the inclusion of the effect of atmospheric aerosols.The dust module,coupled with RegCM3 model,includes the calculation of emission,transport,turbulent diffusion,dry and wet deposition process of four dust bins (0.01-1.0 μm,1.0-2.5 μm,2.5-5.0 μm,5.0-20.0 μm).The representation of dust emission processes is a key element in a dust model and depends on wind conditions,soil characteristics and particle size.Following Marticorena and Bergametti (1995) and Alfaro and Gomes(2001),here the dust emission calculation is based on parameterizations of soil aggregate saltation and sandblasting processes.The main steps in this calculation are:the specification of soil aggregate size distribution for each model grid cell,the calculation of a threshold friction velocity leading to erosion and saltation processes,the calculation of the horizontal saltating soil aggregate mass flux,and the calculation of vertical transportable dust particle mass flux generated by the saltating aggregates.In relation to the BATS (Biosphere-Atmosphere Transfer Scheme) interface,these parameterizations become effective in the model for cells dominated by desert and semi-desert land cover.Detailed dust parameterization has been previously introduced by Zakeyet al.(2006).
2.2 Experiment design
Experiment design can be found in Suet al.(2012) and will not be described here.Deserts and sand-lands in East Asia mainly include the Gurbantunggut,Taklimakan,Kumtag,Badain Jaran,Tengger,and Mu Us deserts,Hunshan Dake and Horqin sand-lands and the Gobi Desert in southern Mongolia.For the convenience of later calculations,the Saryesik-Atyrau Desert in southeastern Kazakhstan is also included in the scope of this study.
3 Results validation
3.1 Concentration
Due to the absence of direct observational data of dust concentration,the annual average PM10concentration for the period 2001-2009 (available data) is compared with simulated dust concentration.Six representative cities,located in or near source areas,are selected for important harm of dust to urban environments.The PM10concentration is a function of Air Pollution Index (API),published daily by the People’s Republic of China Ministry of Environmental Protection(http://datacenter.mep.gov.cn/).The PM10concentration calculated by API is called Equivalent PM10concentration(EPM) and it is defined by:

whereCis the EPM,Iis the API,IhighandIloware the maximum and minimum values ofI,ChighandCloware the maximum and minimum values ofC.
Although EPM includes other particulate matter (diameter less than 10 μm) sources,it is still a good indicator of dust concentration (Gonget al.,2003;Zhanget al.,2003a).The simulated near-surface dust concentration and observed EPM are presented in Figure 1.This comparison generally indicates that the model captures the inter-annual variations of near-surface dust concentration at the selected station site,in particular the decrease trend between 2001 and 2003.
3.2 Dust aerosol optical depth (AOD)
Figure 2 compares the simulated monthly dust AOD with AERONET (Aerosol Robotic Network) observations at sites of Dalanzadgad and Issyk-Kul.There are three principles in selecting observed base station sites.First,the site should be in or near the source area.This can ensure the most proportion of dust aerosol in the total aerosols,so that observed AOD can reflect the variation of dust AOD.Second,the site should have AOD observation at the wavelength of 500 nm,which facilitates the comparison with simulated dust AOD (350-640 nm,an average of about 500 nm).Finally,the site should have a continuous observation over a longer period (more than 12 months),which ensure the continuity of comparison.
Although AERONET AOD includes all types of aerosols,which leads to some discrepancies of individual months,by and large the simulated values are in line with AERONET observations.In particular,both the intra-seasonal and inter-annual variations of AOD at Dalanzadgad site are all well captured.
3.3 Horizontal distribution
Figures 3a and 3b display the annual mean horizontal distribution of dust AOD and column burden (CB) from 2000 to 2009.The distribution characteristics of dust AOD and CB are similar,and two AOD (or CB) extremes are located in the Taklimakan and Badain Jaran deserts,with maximum values of CB and AOD greater than 500 mg/m2,1.1,respectively.In addition,values in the Saryesik-Atyrau Desert,Gurbantunggut Desert and western Gobi Desert in Mongolia are also relatively high.
Figure 3c presents the annual mean horizontal distribution of aerosol index (AI) from the Total Ozone Mapping Spectrometer (TOMS) and Ozone Monitoring Instrument(OMI) from 2000 to 2009.The AI mainly reflects UV-absorbing aerosols (such as dust aerosol,biomass burning aerosol and volcano ash),so the dust source regions can be distinguished from AI distribution (Prosperoet al.,2002).At first approximation,AI can be considered to be proportional to AOD and CB,so it is a good indication of the dust spatial pattern (Zakeyet al.,2006).From Figures 3a and 3c,we can see that AI distribution pattern is well consistent with AOD.Maximum AI occurs in the Taklimakan Desert because of poor diffusion conditions due to basin topography(Gaoet al.,2004).In other high-value areas such as the Badain Jaran Desert,CB is relatively high,but dust is soon transferred to the downstream region because of good diffusion conditions due to frequent windy days (Yaoet al.,2006).However,AI is detected only once a day,so AI is difficult to reflect the situation when dust is generated.One must note that high values of AI in northern and northeastern China are attributed to biomass burning aerosols from winter coal burning (Hermanet al.,1997).
Figure 3d represents the spatial pattern of observed dust storm occurrences.It can be seen that the Tarim Basin,Alxa Plateau and Hunshan Dake sand-land are major regions influenced by dust storms.The comparison between Figures 3b and 3d indicates that the distribution pattern of dust storms agrees with CB.The main model deficiency of an underestimation of dust amounts over the Hunshan Dake sand-land is probably due to a lack of sub-grid fractional dust sources in the model,where the dust source area at a given grid cell depends on the prevalent soil and land cover type and is equal to either 1 or 0 (Zakeyet al.,2006).
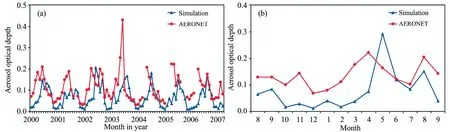
Figure 2 Comparison of observed and simulated monthly mean aerosol optical depth (AOD) (500 nm)at Dalanzadgad (a) and Issyk-Kul (b) stations
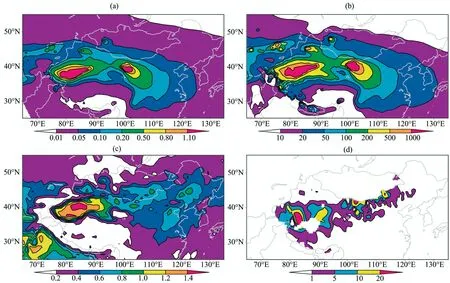
Figure 3 Annual mean distribution of simulated dust AOD (a),column burden (b,units:mg/m2),aerosol index (c) from 2000 to 2009,and day number of dust storm occurrence in China from 2000 to 2006 (d,units:d)
The annual mean spatial pattern of every dust bin from 2000 to 2009 (image omitted) is the same as Figure 3b.The particle mode of 0.01-1.0 μm is suitable for long-distance transport because of its long lifetime in the atmosphere due to little mass.The CB contour line of 10 mg/m2due to the particle mode of 0.01-1.0 μm can across over Japan and on to the North Pacific,whereas those of 1.0-2.5 μm,2.5-5.0 μm and 5.0-20.0 μm are mainly located near dust source regions,indicating that dust particles from 1.0 to 20.0 μm in diameter are quickly re-posited onto source areas after being injected into the atmosphere.
3.4 Vertical distribution
The vertical pattern of dust aerosol can be represented by an aerosol extinction coefficient profile.Figure 4 presents the profile of simulated annual mean extinction coefficient of dust aerosol along 39°N from 2000 to 2009.It can be seen that there are two high-value centers in the near-surface vicinity of 80°E-90°E and 100°E-105°E,located in the Taklimakan and Badain Jaran deserts,respectively.However,contour line of the extinction coefficient such as 0.1 between 80°E and 90°E is higher than that between 100°E and 105°E.This is also attributed to poor diffusion conditions of the Taklimakan Desert,where dust can exist for long periods of time and can be taken to greater heights by deep convection.
We can also see that dust generated in these two sources is transported eastward centered at the height of 700 hPa by a westerly stream to east of 110°E over the East Asian continent,which is consistent with Gonget al.(2003).In addition,using CALIPSO (Cloud-Aerosol Lidar and Infrared Pathfinder Satellite Observation) data,Huanget al.(2007,2008,2009) found that the dust layer height in the Taklimakan Desert was within 5-10 km during dust weather,2.5-5.5 km in summer and 9 km near the source region.These results are in agreement with this paper,which reflects the rationality of the model used in this study.
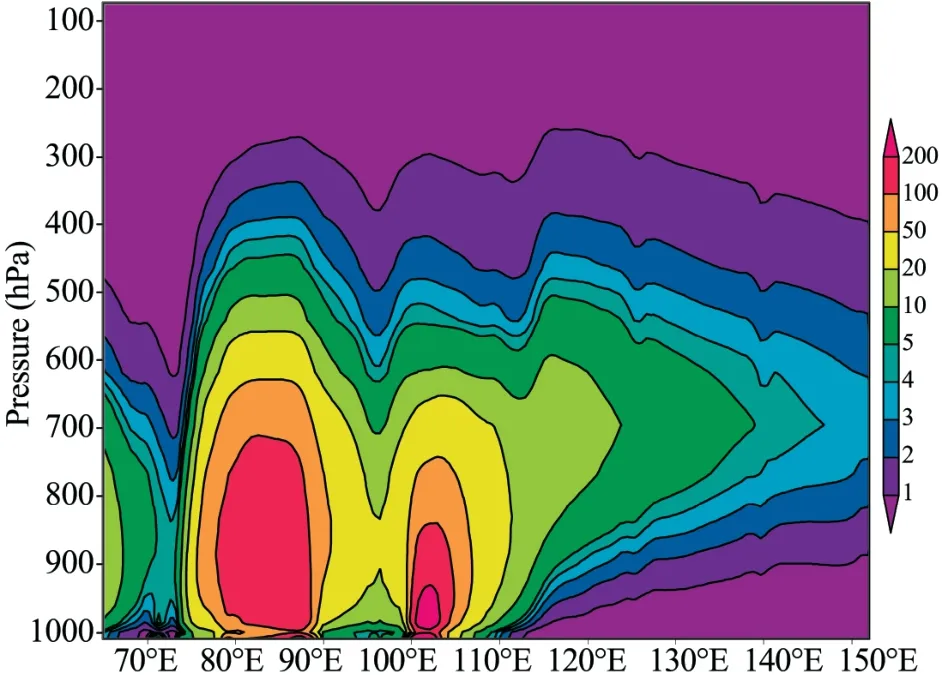
Figure 4 The profile of simulated annual mean extinction coefficient (×10-3) of dust aerosol along 39°N from 2000 to 2009
3.5 Temporal variation
Figure 5 displays the monthly and seasonal variation of mean CB of dust aerosol over East Asia.In order to calculate conveniently,the area of East Asia is set to 25°N-55°N,65°E-135°E.It can be seen that the temporal variation of CB is very obvious.The monthly maximum value of CB appears in April,the secondary maximum in March and the minimum in October,whereas the seasonal maximum in spring,the secondary maximum in winter and the minimum in autumn.
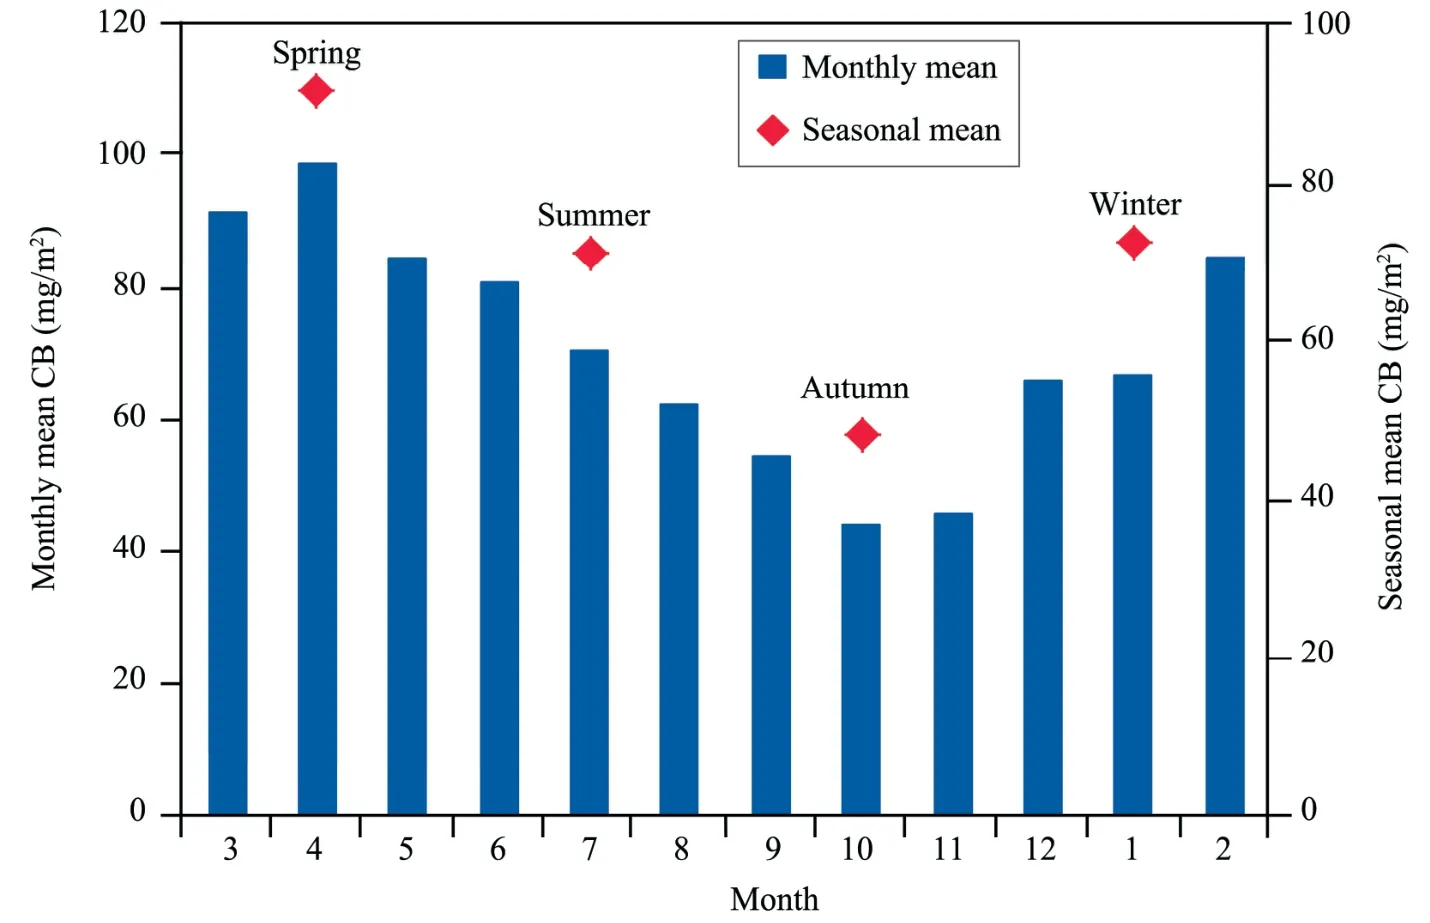
Figure 5 Monthly and seasonal variation of mean column burden (CB) of dust aerosol over East Asia
4 Dust emission and deposition flux
Table 1 lists the emission flux (EF),dry and wet deposition fluxes (DDF and WDF) and net emission flux (NEF) of four dust bins over East Asia.Total dust EF can be up to 1,015.34 mg/(m2·d) for the region,and the percentage of every dust bin to total EF increases with dust particle diameter increase.The proportion of particle diameter of 5.0 μm to 20.0 μm can be up to 86.6%,while only 2.9% for particle diameter of 0.01-1.0 μm.
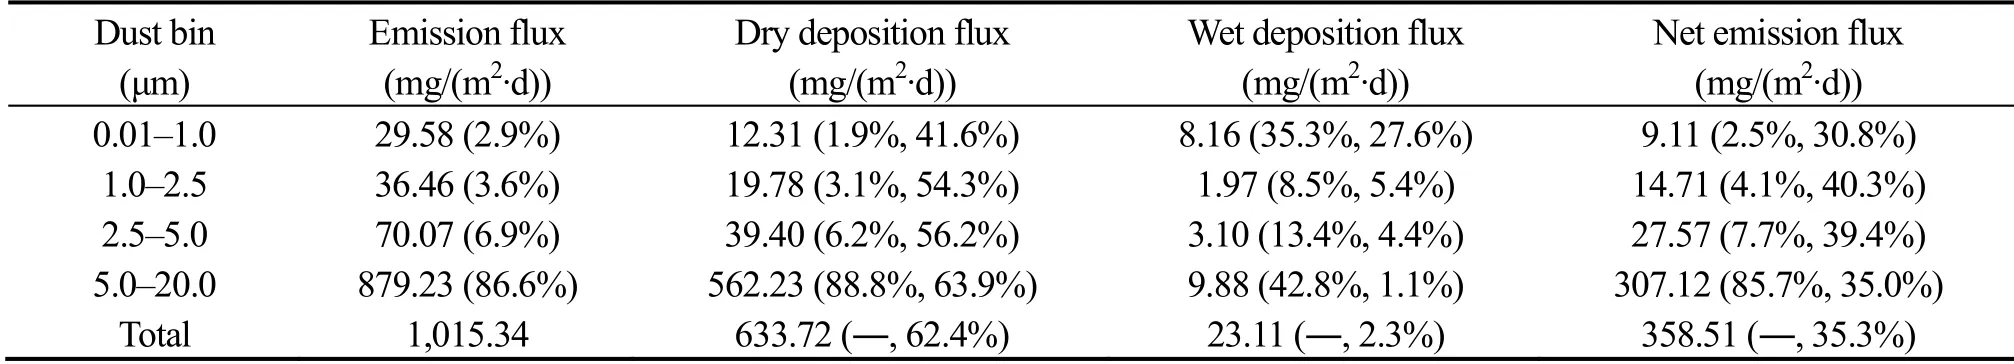
Table 1 Emission flux,dry and wet deposition fluxes and net emission flux of four dust bins
4.1 Dust emission flux
4.1.1 Annual distribution
The dust emission source areas,with a EF threshold value of 1,000 mg/(m2·d),are mainly located in the Taklimakan and Badain Jaran deserts,and the desertification regions in northern Tibet and southwestern Mongolia over East Asia from the annual mean distribution from 2000 to 2009 (Figure 6).Two extremes,with EF greater than 10,000 mg/(m2·d),lie in the Taklimakan and Badain Jaran deserts.In addition,EF of the Gurbantunggut Desert,the Saryesik-Atyrau Desert,and western part of the Gobi Desert in Mongolia are also strong,but their areas are relatively small.
Limited direct EF observation in Dunhuang (Shenet al.,2003a,b) can well reflect the reasonability of dust parameterization scheme (Table 2).In addition,monthly spatial distribution characteristics of dust storms from 1961 to 2000 in China shows that these storms occur mainly in the Tibetan Plateau and the arid and semi-arid areas of northern China(Hanet al.,2005),which correlates well with this study.The dust emission parameterization scheme often contains large uncertainties due to the lack of comprehensive contrast with actual observation.Wuet al.(2005) found that EF is greater than 30 μg/(m2·s) in March,2001 to February,2002 in the Taklimakan and Badain Jaran deserts,where maximum EF is 90-100 μg/(m2·s).Meiet al.(2004) indicated that EF of different soil types in northern China covers the scope of 10-1,000 μg/(m2·s).Both aforementioned studies are consistent with this article after unit conversion.
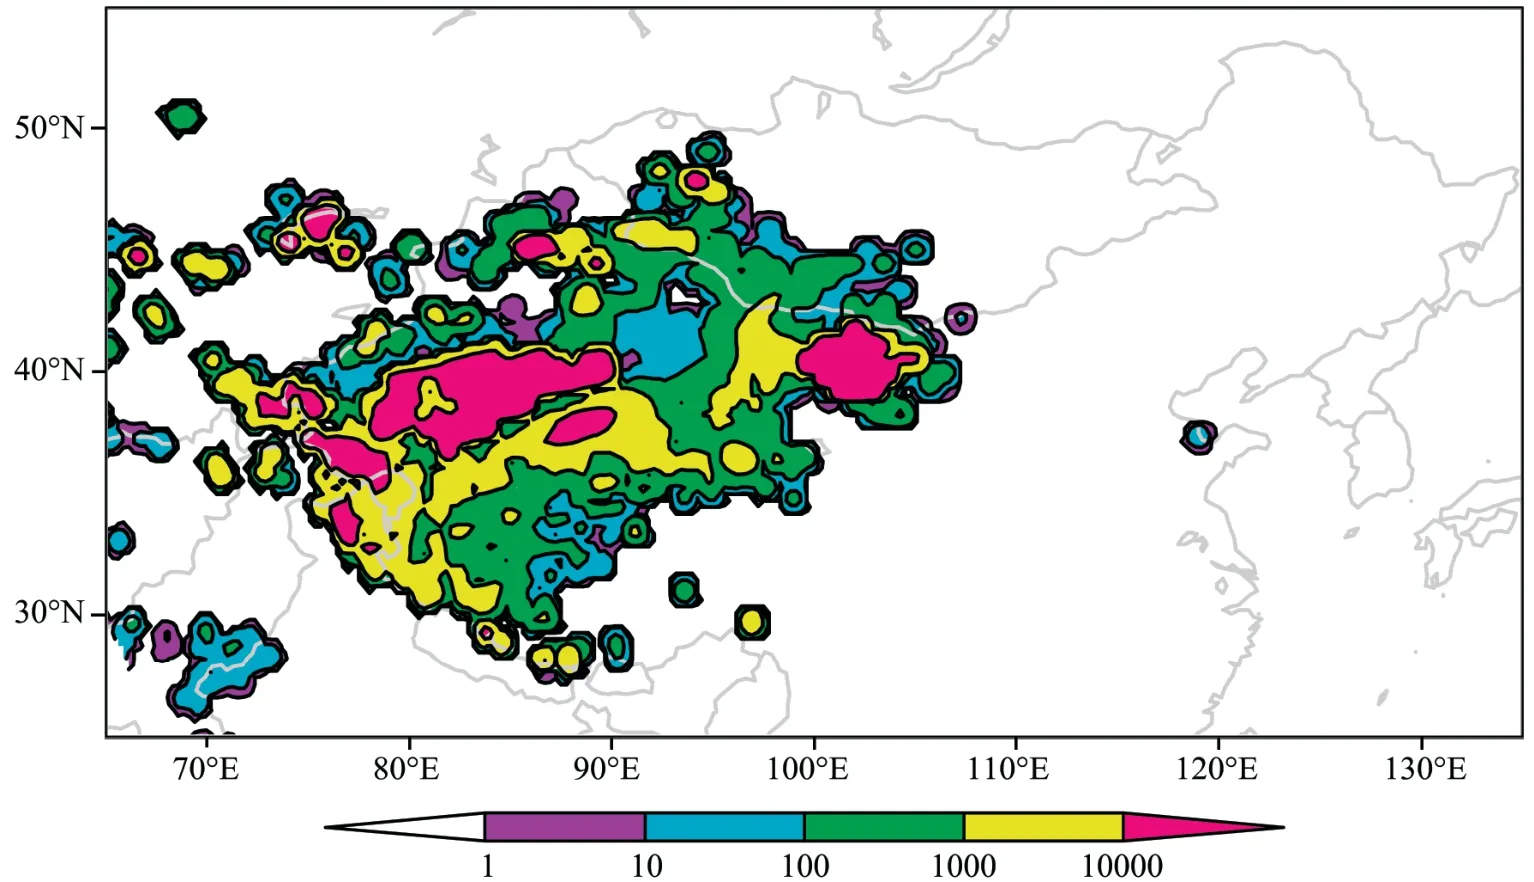
Figure 6 The distribution of annual mean dust emission flux (units:mg/(m2·d)) from 2000 to 2009

Table 2 Comparison of simulated emission flux (units:mg/(m2·d)) with observations at the site of Dunhuang in 2002
4.1.2 Seasonal distribution
It can be seen that seasonal mean EF distribution characteristic (Figure 7) is similar to Figure 6.The high-value centers of EF are still located in the Taklimakan and Badain Jaran deserts,as well as several small regions such as the Gurbantunggut Desert.However,there exist considerable differences due to different seasons and regions.
The dust emission intensity of Taklimakan Desert has obvious seasonal variation.The scope of contour line of 1×10⁴mg/(m2·d) in the Taklimakan Desert in spring and summer is larger than that in autumn and winter,while the emission intensity in the Badain Jaran Desert is relatively stable all year.It is worth mentioning that EF in the Qaidam Basin of Qinghai Province and the western border regions can be greater than 1×10⁴mg/(m2·d) in winter.
There is very strong seasonal variation of EF in the Qinghai-Tibet Plateau,where EF is lower than 1 mg/(m2·d)in summer and autumn,which is far less than that in spring and winter.This is mainly related in the desertification of grasslands in the northern Qinghai-Tibet Plateau.The emission mechanism is suppressed due to relatively high vegetation cover in summer,which is opposite to that in spring and winter.High elevation and strong upward air flow of the Qinghai-Tibet Plateau easily leads to long-range transport of dust by the westerly jet (Hanet al.,2004a).In recent decades,as global warming and human activity intensifies in Tibetan areas,sustainable development of Tibet will be hampered by enormous environmental pressures due to rapid enlargement of land desertification.This also has a significant and profound negative impact on the ecological environment of East and South Asia(Ci,2005).Therefore,further studies are needed on how to effectively combat desertification.
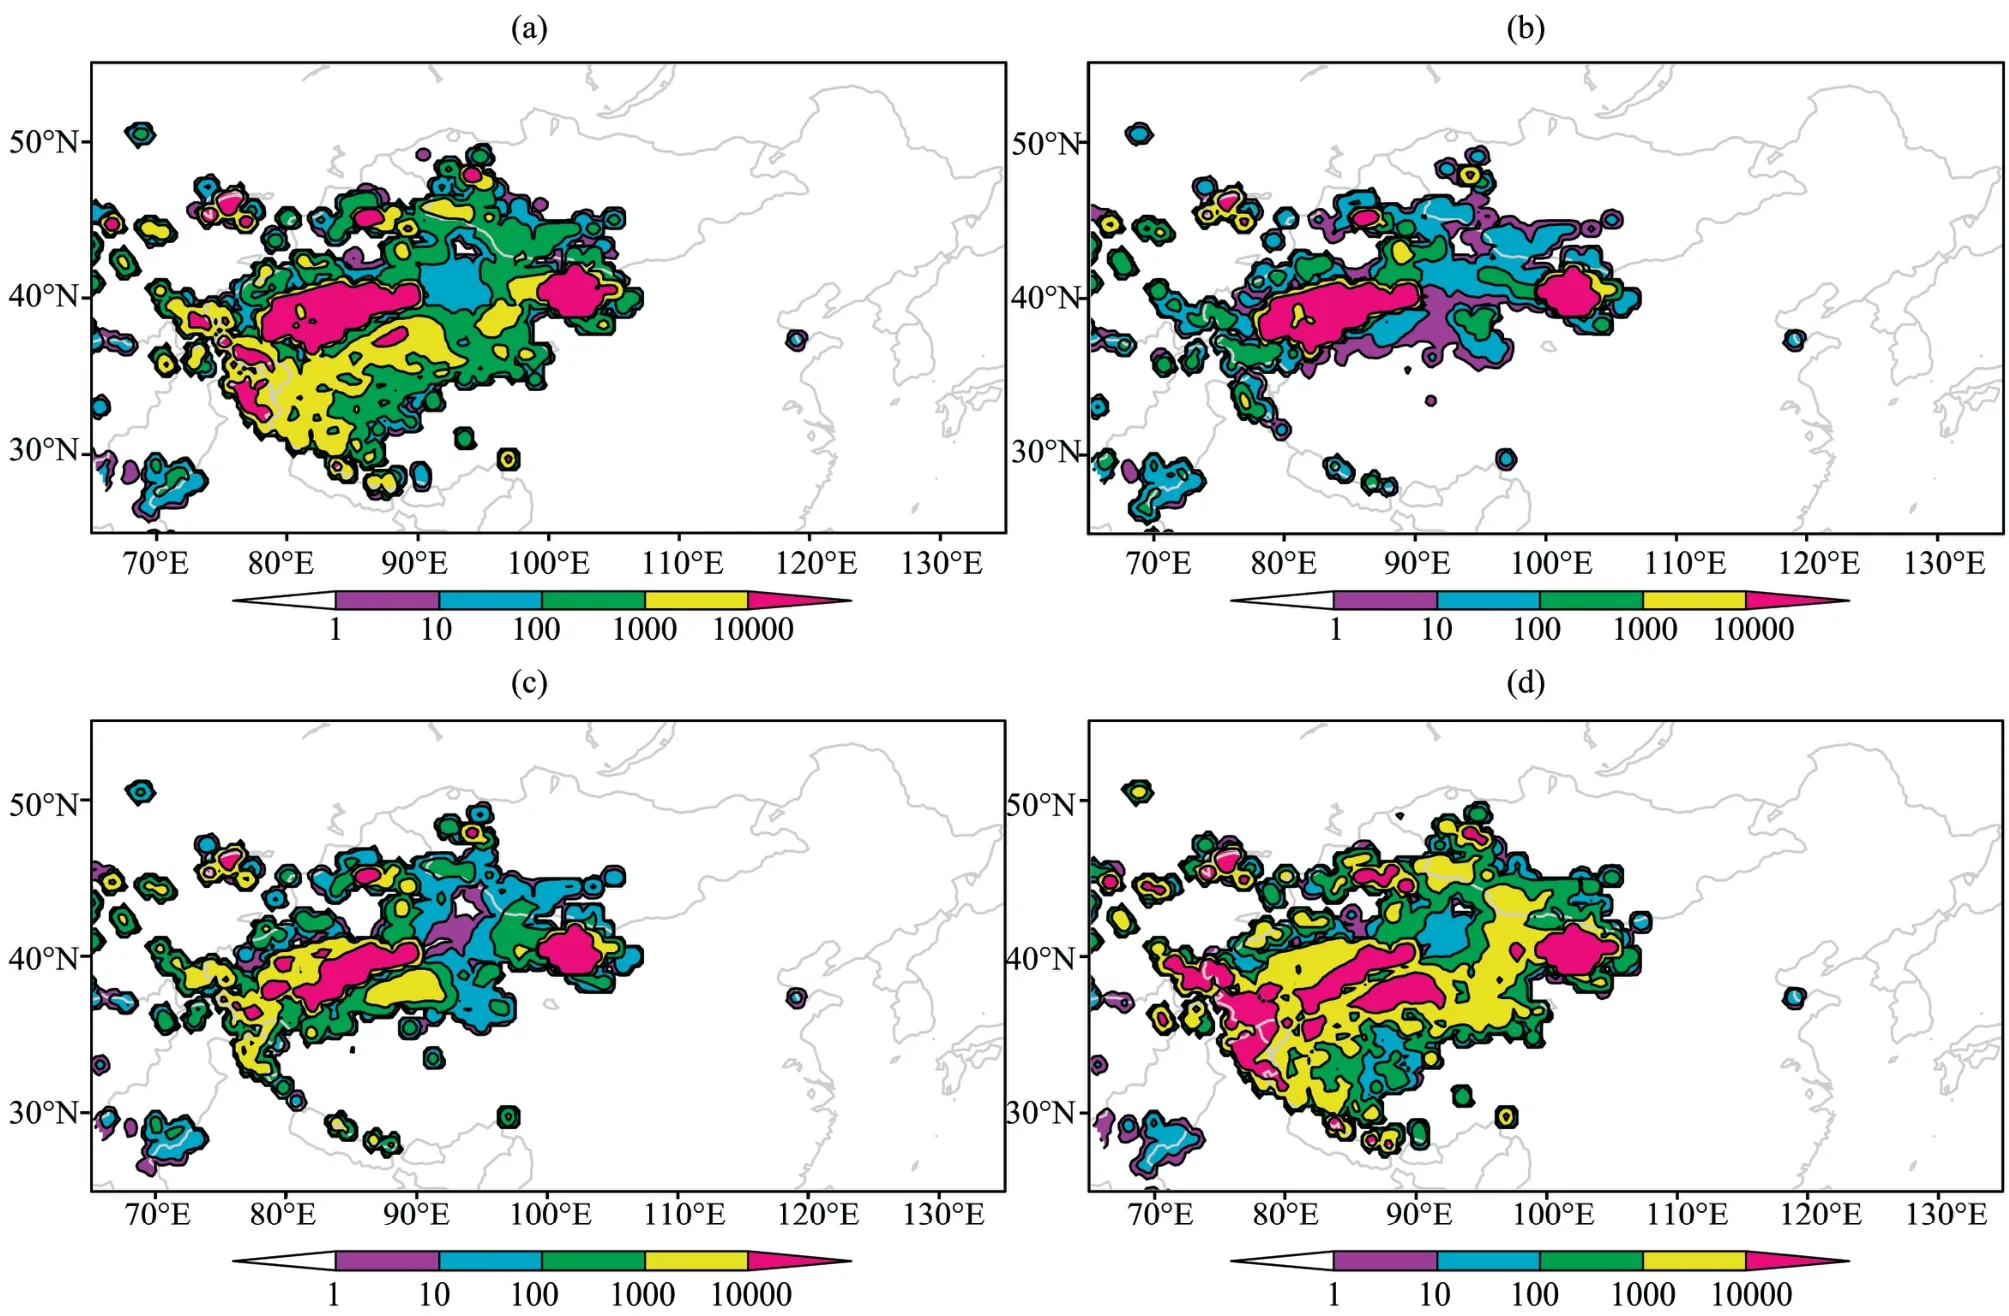
Figure 7 The distribution of seasonal mean dust emission flux (units:mg/(m2·d)) from 2000 to 2009.(a) Spring,(b) summer,(c) autumn,(d) winter
Figure 8 shows monthly and seasonal EF of East Asia.We can see that maximum EF appears in February,secondary maximum in March and minimum in October.From the point of view of seasonal distribution,maximum EF appears in winter and secondary maximum in spring,which differs with the temporal distribution of CB (see Figure 5).It is well known that the dust emission process depends on wind conditions,particle size and soil characteristics.However,atmospheric stratification is a key impact factor of CB except the magnitude of EF.The EF is relatively high in winter,but atmospheric stratification is less stable in spring than in winter.Therefore,dust is easily elevated in spring than in winter.Liet al.(2004) demonstrated that dust storms were mainly influenced by gales,but some gale frequent regions were not completely the same as sand-dust storm regions.Therefore,more simulation studies are needed to improve some empirical formulas in the dust parameterization.
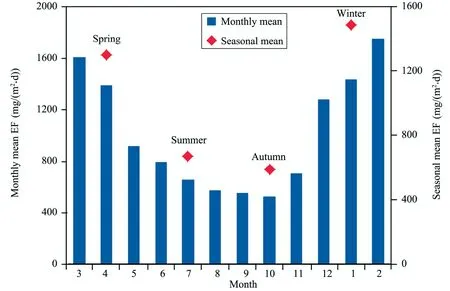
Figure 8 Monthly and seasonal variation of dust emission flux over East Asia
4.2 Deposition flux
It can be seen that regions of high emission flux (EF)also have high values of dry deposition flux (DDF) and wet deposition flux (WDF) (Figure 9).Dry deposition occurs mainly in or near the source areas,where the contour line of 1 mg/(m2·d) only can cover eastward the Korean Peninsula and southern Japan.The WDF and its zonal gradient are relatively small,which is mainly due to the distribution of precipitation over East Asia.
Regional mean DDF and WDF,with values greater than 633.72 mg/(m2·d) and 23.11 mg/(m2·d),respectively,can take up 62.4% and 2.3% of total EF,respectively.In addition,the proportion of each dust bin from 0.01 μm to 20 μm increases with dust particle size increase,which is 1.9%,3.1%,6.2% and 88.8%,respectively.However,WDF is more complex.The maximum proportion of WDF is 42.8% due to dust particles of 5.0-20.0 μm in diameter,secondary maximum of 35.3% is due to 0.01-1.0 μm and the minimum 8.5% is due to 1.0-2.5 μm.
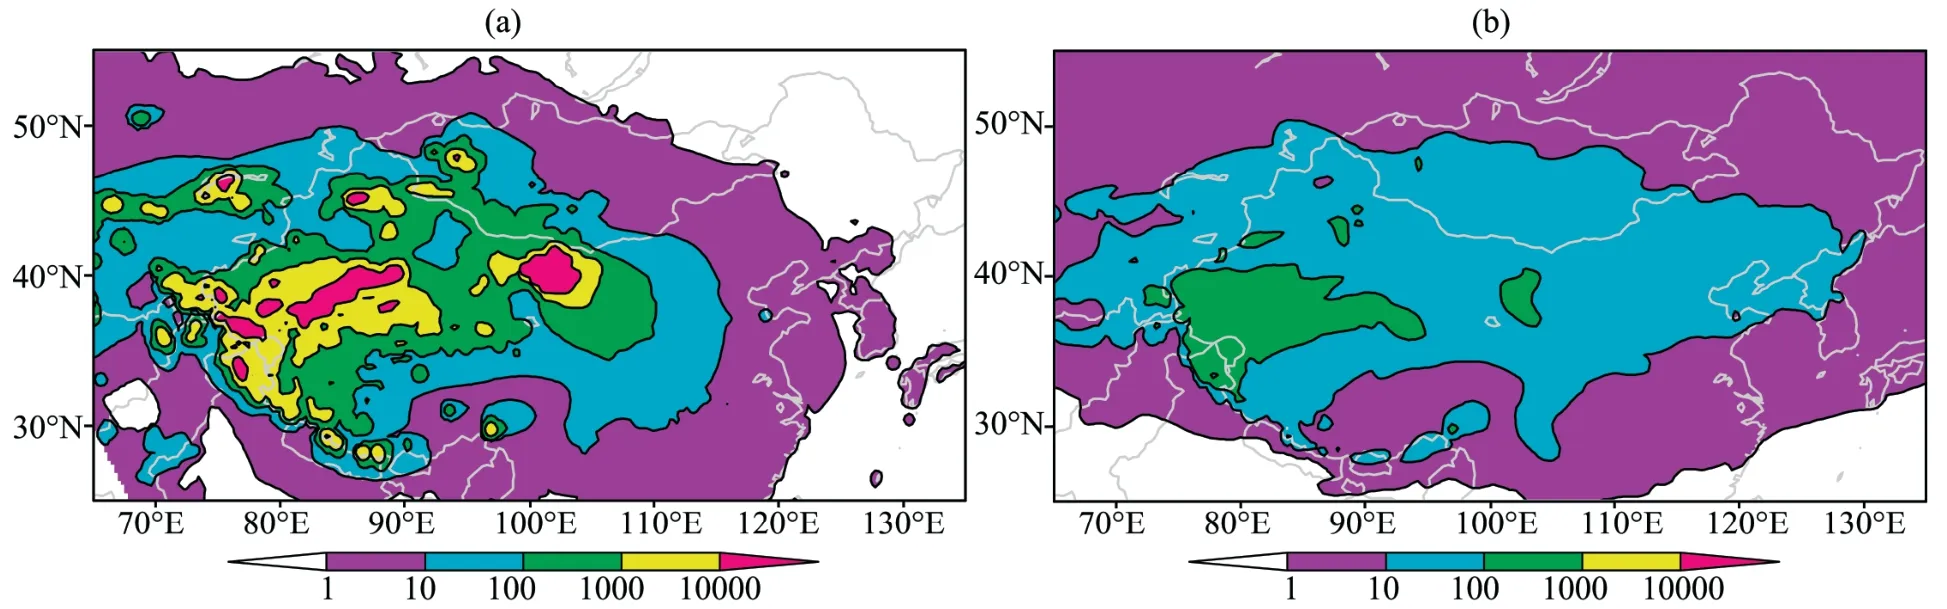
Figure 9 The distribution of annual mean dry (a) and wet (b) deposition fluxes (units:mg/(m2·d)) of dust from 2000 to 2009
4.3 Net emission flux
The net dust emission fluxFin this paper is defined by:

whereFe,FdandFware EF,DDF and WDF,respectively.
Figure 10 displays the distribution of net EF.It can be seen that the extreme centers,with NEF greater than 1×10⁴mg/(m2·d),are located in the Badain Jaran,western Taklimakan,middle Gurbantunggut and northwestern Saryesik-Atyrau deserts.Regional mean NEF over East Asia is 358.51 mg/(m2·d),which takes up 35.3% of the total EF.This dust portion will outflow from the model border and eventually be transported to the downstream region.Zhanget al.(1997) found that about half of the dust generated over East Asia was subject to long-range transport to the Pacific Ocean and beyond,but their study was limited to the spring season when dust accounted for 34% throughout the year.Hanet al.(2004b) indicated that 23% of total dust was suspended in the atmosphere or subject to long-range transport,whereas Liuet al.(2003)found this percentage was about 5%.It should be noted that the object of both studies is one dust storm process.
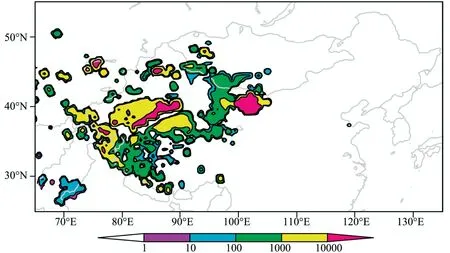
Figure 10 The distribution of net emission flux (units:mg/(m2·d)) of dust from 2000 to 2009
5 Conclusions
A regional climate model RegCM3,coupled with an online dust module,is used to simulate the spatio-temporal distribution and emission flux over East Asia in the period from 2000 to 2009.Our conclusions are mainly as follows.
(1) The RegCM3 model presents a good ability to simulate the distribution of dust aerosol over East Asia.The high-value regions of dust AOD and CB are mainly located in the Taklimakan and Badain Jaran deserts.In addition,the content of dust in the atmosphere in the Saryesik-Atyrau Desert,Gurbantunggut Desert and western Mongolia is also high.
(2) The seasonal variation characteristic is evident,with the maximum value appearing in spring,secondary maximum in winter and the minimum in autumn.
(3) To the east of 110°E,dust is transported eastward from a maximum center at a height of 700 hPa over the East Asian continent.
(4) The dust emission sources are mainly located in the Taklimakan Desert,Badain Juran Desert,North Qinghai-Tibetan Plateau and Southwest Mongolia,with an evident seasonal variation.
(5) The annual mean dust emission flux is 1,015.34 mg/(m2·d),of which 62.4% and 2.3% are re-deposited onto the continent of East Asia through dry and wet deposition process respectively,and the remaining 35.3% is injected into the atmosphere or subject to long-range transport.
This project is supported by the National Basic Research Program of China (Grant No.2011CB403202).
Alfaro SC,Gomes L,2001.Modeling mineral aerosol production by wind erosion:emission intensities and aerosol size distributions in sources areas.Journal of Geophysical Research,106(D16):18075-18084.
Ci LJ,2005.Desertification and Its Control in China.Higher Education Press,Beijing.
Dentener FJ,Carmichael GR,Zhang Y,Lelieveld J,Crutzen PJ,1996.Role of mineral aerosol as a reactive surface in the global troposphere.Journal of Geophysical Research,101(D17):22869-22889.doi:10.1029/96JD01818.
Dickerson RR,Kondragunta S,Stenchikov G,Civerolo KL,Doddridge BG,Holben BN,1997.The impact of aerosol on solar ultraviolet radiation and photochemical smog.Science,278:827-830.
Fung IY,Meyn SK,Tegen I,Doney SC,John JG,Bishop JKB,2000.Iron supply and demand in the upper ocean.Global Biogeochemical Cycles,14(1):281-295.
Gao QX,Ren ZH,Li ZQ,Pubu CR,2004.Spatial and temporal distribution of dust aerosol and its impacts on radiation based on analysis of EP/TOMS satellite data.Resources Science,26(5):2-10.
Gong SL,Zhang XY,Zhao TL,Mckendry IG,Jaffe DA,Lu NM,2003.Characterization of soil dust aerosol in China and its transport and distribution during 2001 AEC-Asia:2.Model simulation and validation.Journal of Geophysical Research,108(D9):4262.doi:10.1029/2002JD 002633.
Han YX,Song LC,Xi XX,Ye YH,2005.Monthly temporal-spatial character of sandstorms and long-distance dust transport in China.China Environmental Science,25(suppl.):13-16.
Han YX,Xi XX,Song LC,Ye YH,Li YH,2004a.Spatio-temporal sand-dust distribution in Qinghai-Tibet Plateau and its climatic significance.Journal of Desert Research,24(5):588-592.
Han ZW,Ueda H,Matsuda K,Zhang RJ,Arao K,Kanai Y,Hasome H,2004b.Model study on particle size segregation and deposition during Asian dust events in March 2002.Journal of Geophysical Research,109:D19205.doi:10.1029/2004JD004920.
Herman JR,Bhartia PK,Torres O,Hsu C,Seftor C,Celarier E,1997.Global distribution of UV-absorbing aerosols from Nimbus 7/TOMS data.Journal of Geophysical Research,102(D14):16911-16922.
Huang J,Fu Q,Su J,Tang Q,Minnis P,Hu Y,Yi Y,Zhao Q,2009.Taklimakan dust aerosol radiative heating derived from CALIPSO observations using the Fu-Liou radiation model with CERES constraints.Atmospheric Chemistry and Physics,9:4011-4021.
Huang J,Minnis P,Chen B,Huang Z,Liu Z,Zhao Q,Yi Y,Ayers JK,2008.Long-range transport and vertical structure of Asian dust from CALIPSO and surface measurements during PACDEX.Journal of Geophysical Research,113:D23212.doi:10.1029/2008JD010620.
Huang J,Minnis P,Yi Y,Tang Q,Wang X,Hu Y,Liu Z,Ayers JK,Trepte C,Winker D,2007.Summer dust aerosols detected from CALIPSO over the Tibetan Plateau.Geophysical Research Letters,34:L18805.doi:10.1029/2007GL029938.
Kohfeld KE,Harrison SP,2001.DIRTMAP:the geological record of dust.Earth-Science Reviews,54(1-3):81-114.
Li YH,Zhang CJ,Gao XJ,2004.Temporal and spatial characteristics of gale weather over Northwest China.Journal of Desert Research,24(6):715-723.
Liu M,Westphal DL,Wang S,Shimizu A,Sugimoto N,Zhou J,Chen Y,2003.A high-resolution numerical study of the Asian dust storms of April 2001.Journal of Geophysical Research,108(D23):8653.doi:10.1029/2002JD003178.
Marticorena B,Bergametti G,1995.Modeling the atmospheric dust cycle:1.Design of a soil-derived dust emission scheme.Journal of Geophysical Research,100(D8):16415-16430.
Mei FM,Zhang XY,Lu HY,Shen ZX,Wang YQ,2004.Characterization of MASDs of surface soil in North China and its influence on estimating dust emission.Chinese Science Bulletin,49(20):2169-2176.
Prospero JM,Ginoux P,Torres O,Nicholson SE,Gill TE,2002.Environmental characterization of global sources of atmospheric soil dust identified with the Nimbus 7 total ozone mapping spectrometer (TOMS) absorbing aerosol product.Reviews of Geophysics,40(1):1002.doi:10.1029/2000RG000095.
Shen YB,Shen ZB,Du MY,Wang WF,2003a.Variational characteristics of some parameters and factors during dusty weather in spring of Dunhuang.Plateau Meteorology,22(4):378-384.
Shen ZB,Shen YB,Du MY,Wang WF,2003b.Observational result of dust emission rate over sand surface of Gobi Desert during dust storm.Plateau Meteorology,22(6):545-550.
Su XT,Wang HJ,Zhang ZB,2012.Radiative forcing and temperature response of dust aerosols over East Asia in the latest decade.Sciences in Cold and Arid Regions,4(4):351-356.
Wu J,Fu CB,Jiang WM,Liu HN,Zhao RH,2005.A preliminary simulation study of direct radiative forcing of mineral dust aerosol over the East Asia region.Chinese Journal of Geophysics,48(6):1250-1260.
Xuan J,1999.Dust emission factors for environment of Northern China.Atmospheric Environment,33:1767-1776.
Xuan J,Liu G,Du K,2000.Dust emission inventory in Northern China.Atmospheric Environment,34:4565-4570.
Yao ZY,Wang T,Zhou L,Zhu KW,2006.Spatial-temporal distribution characteristics of windy weather in recent 40 years in Alxa Plateau,Inner Mongolia.Arid Land Geography,29(2):207-212.
Zakey AS,Solmon F,Giorgi F,2006.Implementation and testing of a desert dust module in a regional climate model.Atmospheric Chemistry and Physics,6:4687-4704.
Zhang DF,Zakey AS,Gao XJ,Giorgi F,Solmon F,2009.Simulation of dust aerosol and its regional feedbacks over East Asia using a regional climate model.Atmospheric Chemistry and Physics,9:1095-1110.
Zhang XY,Arimoto R,An ZS,1997.Dust emission from Chinese desert sources linked to variations in atmospheric circulation.Journal of Geophysical Research,102(D23):28041-28047.
Zhang XY,Gong SL,Shen ZX,Mei FM,Xi XX,Liu LC,Zhou ZJ,Wang D,Wang YQ,Cheng Y,2003a.Characterization of soil dust aerosol in China and its transport and distribution during 2001 ACE-Asia:1.Network observations.Journal of Geophysical Research,108(D9):4261.doi:10.1029/2002JD002632.
Zhang XY,Gong SL,Zhao TL,Arimoto R,Wang YQ,Zhou ZJ,2003b.Sources of Asian dust and role of climate change versus desertification in Asian dust emission.Geophysical Research Letters,30(24):2272.doi:10.1029/2003GL018206.
Zhao TL,Gong SL,Zhang XY,McKendry IG,2003.Modeled size-segregated wet and dry deposition budgets of soil dust aerosol during ACE-Asia 2001:implications for trans-Pacific transport.Journal of Geophysical Research,108(D23):8665.doi:10.1029/2002JD003363.
 Sciences in Cold and Arid Regions2013年2期
- Sciences in Cold and Arid Regions的其它文章
- Amount and temperature effects responsible for precipitation isotope variation in the southern slope of Himalayas
- Seasonal changes in the relationship between species richness and community biomass in grassland under grazing and exclosure,Horqin Sandy Land,northern China
- Afforestation effects on soil microbial abundance,microbial biomass carbon and enzyme activity in dunes of Horqin Sandy Land,northeastern China
- The effects of extreme rainfall events on carbon release from biological soil crusts covered soil in fixed sand dunes in the Tengger Desert,northern China
- Probabilistic modeling of soil moisture dynamics in a revegetated desert area
- Effects of shrubs and precipitation on spatial-temporal variability of soil temperature in microhabitats induced by desert shrubs