
East Asian Winter Monsoon record from the environmental sensitive grain size component of QF Old Red Sand,Haitan Island,China
2013-12-15 05:55FanGenHuZhiZhongLiJianHuiJinQianZhaoHuiZhangXianLiWangJingXia
FanGen Hu ,ZhiZhong Li ,JianHui Jin ,Qian Zhao ,Hui Zhang ,XianLi Wang ,Jing Xia
1.College of Geographical Science,Fujian Normal University,Fuzhou,Fujian 350007,China
2.Institute of Geography,Fujian Normal University,Fuzhou,Fujian 350007,China
3.Key Laboratory of Humid Sub-tropical Eco-geographical Process of Ministry of Education,Fuzhou,Fujian 350007,China
4.State Key Laboratory of Loess and Quaternary Geology,Institute of Earth Environment,Chinese Academy of Sciences,Xi’an,Shaanxi 710075,China
1 Introduction
Historically,grain-size data have been widely used to reflect the paleoenviromental evolvement in Quaternary aeolian deposit area,as a proxy of climate change.For example,in the Chinese Loess Plateau,grain-size of loess-soil sequence have been regarded as proxies of the East Asian Winter Monsoon (EAWM) which reveals wind-powered dust transportation and sedimentary environment change,and significant scientific achievements have been made on a long time scale (Anet al.,1990,1991;Porter and An,1995;Dinget al.,2002;Sunet al.,2012;WangFNet al.,2012).In recent years,a series of research results have been obtained in this aspect through pre-treatment of samples for grain-size analysis and mathematical analysis of grain-size data.Thus,environmentally sensitive grain size components (ESGSC)or end-members were extracted from grain-size data,which can be used to indicate the paleoenvironment or/and paleoclimate variations.This progress shows a great potential for grain-size data in the study of paleoenvironmental and paleoclimatic changes (Porter and An,1995;Prinset al.,2000;Sunet al.,2001;Xiaoet al.,2005;Wang JLet al.,2012).
Along the coastal areas of South China,Quaternary sediment is widespread,which usually was called as "Old Red Sand".This type of deposition consists of slightly cemented,medium-to-fine grained sands,and is characterized by colors of red (10R4/8),reddish brown (2.5YR4/8),yellow red (5YR5/8),and dark yellowish orange (5YR6/8).It is distributed in areas with modern coastal dunes along the coast of South China.This sand sediment,in the form of single or multiple sand embankments,has continuous distribution along the coastal plains,or on hill slopes near the coastline (Chenet al.,1998;Wu and Wang,1998).The sedimentary characteristics and formation of the "Old Red Sand" have been widely investigated by Chinese scientists(Wuet al.,1994;Chenet al.,1998;Wu and Wang,1998,2001;Zenget al.,1999;Liet al.,2011),who generally consider the "Old Red Sand" as aeolian sediment laid down in the last glacial period of late Pleistocene when the sea level was lower than at present.During this period,the northeast monsoon was stronger,thus,beach sand constantly was moved to landward and was deposited on the windward slopes,and later,it suffered different degree of chemical weathering.Thus,the formation and evolution of the "Old Red Sand",which records the evolution process of the coastal aeolian landscape system,reflecting the complex interaction among land surface,atmosphere and ocean,and is an important part of the Global Change Research.The southeastern coast of Fujian,located in the core area of EAWM,was especially affected by the gorges tube effect and geography of the Taiwan Strait,and with the northeast monsoon prevailing year-round created conditions for the formation of the "Old Red Sand".In this paper,we extracted the ESGSC of the Qingfeng (QF) "Old Red Sand" profile,through grain size analysis with high-resolution sampling,by using grain size-standard deviation method.We then obtained a climate proxy indicating the strength of the EAWM and accordingly reconstructed the history of the EAWM change based on chronology data of previous researches.
2 Study area
The QF "Old Red Sand" profile is located in northern Haitan Island,Fujian Province,Pingtan County,China.East and west are the Haitan Channel and the Taiwan Strait,respectively (Figure 1).The main rock includes Cretaceous volcanic rocks and Upper Triassic-Jurassic metamorphic rocks.The predominant geomorphological types consist of red terraces,low erosion hills,terrace valley,marine plain and aeolian ridges.The climate is southern subtropical sub-humid marine monsoon,with average annual temperature and precipitation,respectively 19 °C and 900-1,100 mm.There is a strong wind with an average velocity near 6.5-8.5 m/s with obvious annual variation.Dominant wind is NNE direction coupled with a large and stable speed in autumn and winter,by contrast summer is much smaller(Table 1).Our field survey found that the "Old Red Sand" is mainly distributed in the sandy coast of the northeastern island.This is well consistent with the wind power environment,that prevailing wind direction in fall and winter is mainly for north to northeast shore wind,which is conducive to coastal aeolian sand accumulation.
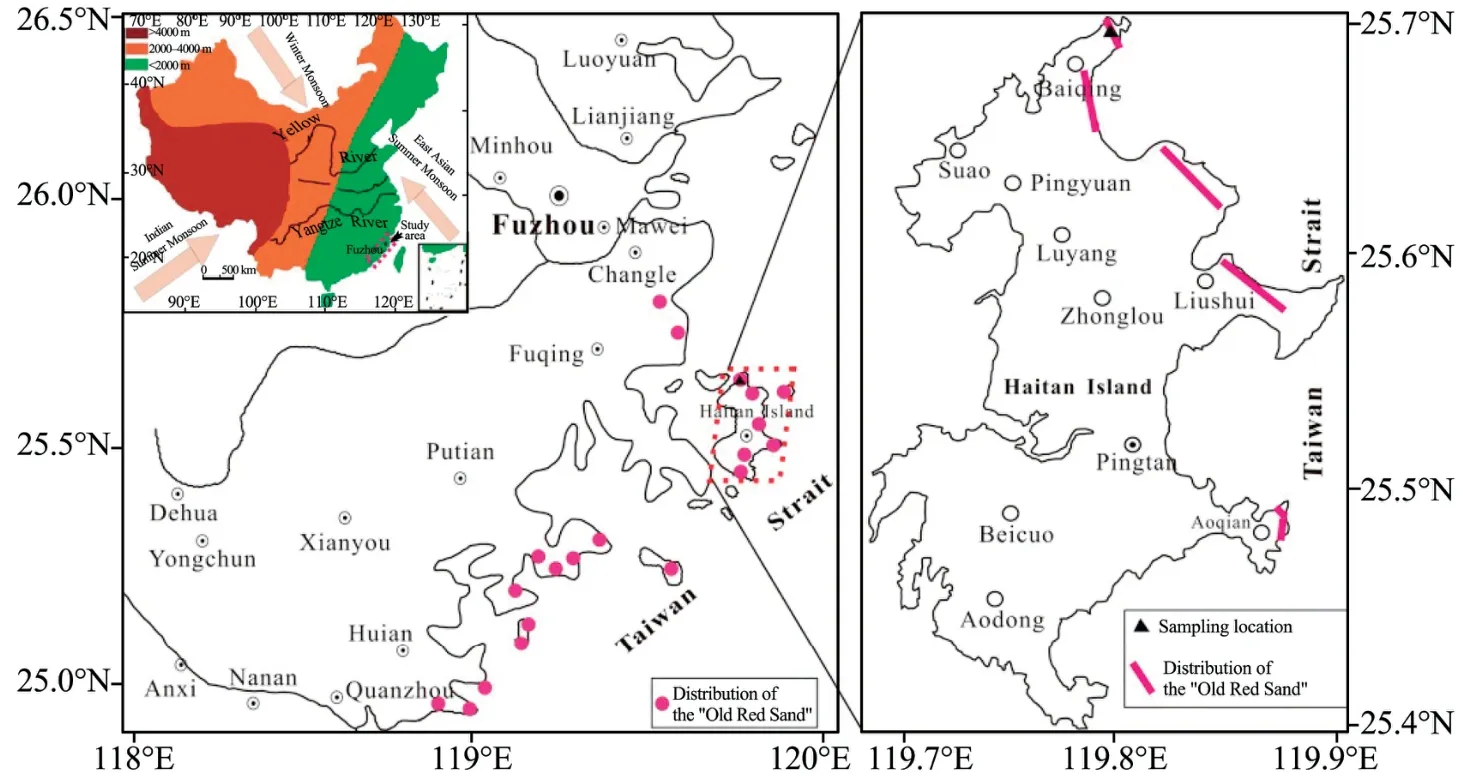
Figure 1 The distribution of "Old Red Sand" and the location of Qingfeng section in Fujian southeastern coast

Table 1 Wind direction frequency and velocity on Haitan Island,Fujian Province,China (Chen,1994)
3 Materials and methods
3.1 Sedimentary characteristics
In September 2010 and May 2011 at Qingfeng village of Haitan Island,we obtained two "Old Red Sand" stratigraphic sections respectively marked as QF with a thickness of 10.5 m and QFS with a thickness of 18.9 m,geographic coordinates are as follows:(25°39′48″N,119°46′59″E),(25°39′45.5″N,119°46′40.2″E),the distance from the two sections to the modern coastline is about 200 m and 700 m,respectively.One section is about 500 m away from the other.This paper focuses on the QF profile,from top to bottom,according to sediment color;the section is divided into seven units with clear boundaries,and a detailed sedimentary structure description is presented in Figure 2.
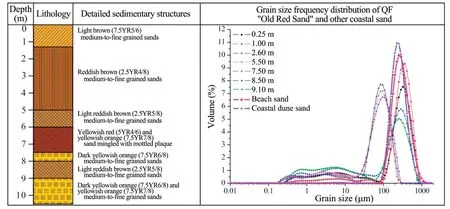
Figure 2 Profile description and grain size frequency distribution of QF "Old Red Sand"
3.2 Method
In the field,we sampled at 2.5 cm intervals with a total of 420 samples obtained from the QF section.Also,39 beach sand and modern coastal dune samples from nearby coastal areas (Tannan Bay of Haitan Island,Changle coastal zone,Longmei village and Hutou Hill of Zhangpu County,Keren village of Jinjiang city) were analyzed to compare with the "Old Red Sand" samples.Samples were pretreated as follows:Firstly,we added about 1 g sample into a 100 mL beaker with 5 mL of 10 % hydrogen peroxide (H2O2) for 24 hours to remove organic matter.After 24 hours,we added 5 mL of 10% hydrochloric acid (HCl) into the beaker and heated for a few minutes to remove the carbonates,then filled the beaker with distilled water and let stand for 24 hours,then extracted and filled with distilled water several times until the solution was neutral.Finally,we filled the beaker with 5 mL of 0.05 N sodium hexametaphos-phate ((NaPO3)6) for dispersion.Grain-size analysis was carried out on a Britain Malvern 2000 grain-size analyzer in the Key Laboratory of Humid Sub-tropical Eco-geographical Process of Ministry of Education,China,with a measurement range of 0.02-2,000 μm and a size resolution of 0.01φ.Each sample was tested three times in order to test its reproducibility,the repeated measuring error was within 2%,and finally the mean of the three results of each sample was taken.
3.3 Chronology analysis
The age of the "Old Red Sand" along the Chinese southeastern coast has attracted considerable attention from geologists and geomorphologists.They have acquired relative and absolute geochronology of stratum through stratigraphic correlation and dating methods.Yuanet al.(2008)believed that "Old Red Sand" sediments formed since the late Pleistocene,and name the "Old Red Sand" along the southeastern coast of Fujian as the Jinjiang Formation,including QF "Old Red Sand" profile.Previous researchers have achieved excellent results on the QF profile(Wuet al.,2000).Wu and Wang (2001) and Tan and Wu (2001) obtained four chronology data through ESR and TL dating at depths of 0.82,1.68,6.7,and 12.24 meters in the QF section,with respective ages of 9.5±0.8 ka,12.0±1.0 ka,22.07±0.51 ka,and 54.0±5.0 ka.In this paper,we established the chronological framework of the profile based on the aforementioned age data (Wuet al.,2000;Wu and Wang,2001).Piecewise linear fitting was used to establish an age-depth model,and then ages of other samples were obtained by extrapolation.
4 Results
4.1 Grain size characteristics
Grain size analysis results (Figure 2) show that grain-size distribution curves of sediments at different depths in the QF section are very similar,characterized by a distinct single peak,a broadly consistent distribution range and relative concentration.reflecting this section was continuously deposited under a comparatively stable sedimentary environment and a single substance source.Comparing the "Old Red Sand" deposition with beach sand and modern coast dune (Figure 2),we can see that their grain-size distribution curves were generally similar,but "Old Red Sand"have a more fine-grained component as the early coastal aeolian sand suffered strong chemical weathering in the later period.Also,the weathering of feldspars and unstable minerals generated more fine-grained material.From the grain-size distribution curves corresponding to the peak value,it can be seen that the whole profile can be divided into three units,in the depth of 5.5-8.5 m,sedimentary grain-size distribution curves correspond to a peak of about 95-106 μm,while the other two units are at about 251-362 μm,which indicates a certain change of their sedimentary environment (the strength of the transporting force).
According to grain size analysis results,we know that QF "Old Red Sand" deposition is mainly dominated by medium sand (250-500 µm),fine sand (125-250 µm) and silt,with an average content accounting for about 34.75%,22.00%,and 17.91%,respectively (Figure 3);coarse sand(500-1,000 μm) and clay (<2 μm) with an average content of 14.1%,6.8%,respectively;very coarse sand ( >1,000 μm)was the least with an average content of 0.26%.By contrast with other sediments,QF "Old Red Sand" contains more silt and clay,less medium sand,fine sand and coarse sand compared to beach sand and modern coastal dune sand;beach sand has more coarse and very coarse sand,less medium-fine sand,but a similar content of silt and clay.
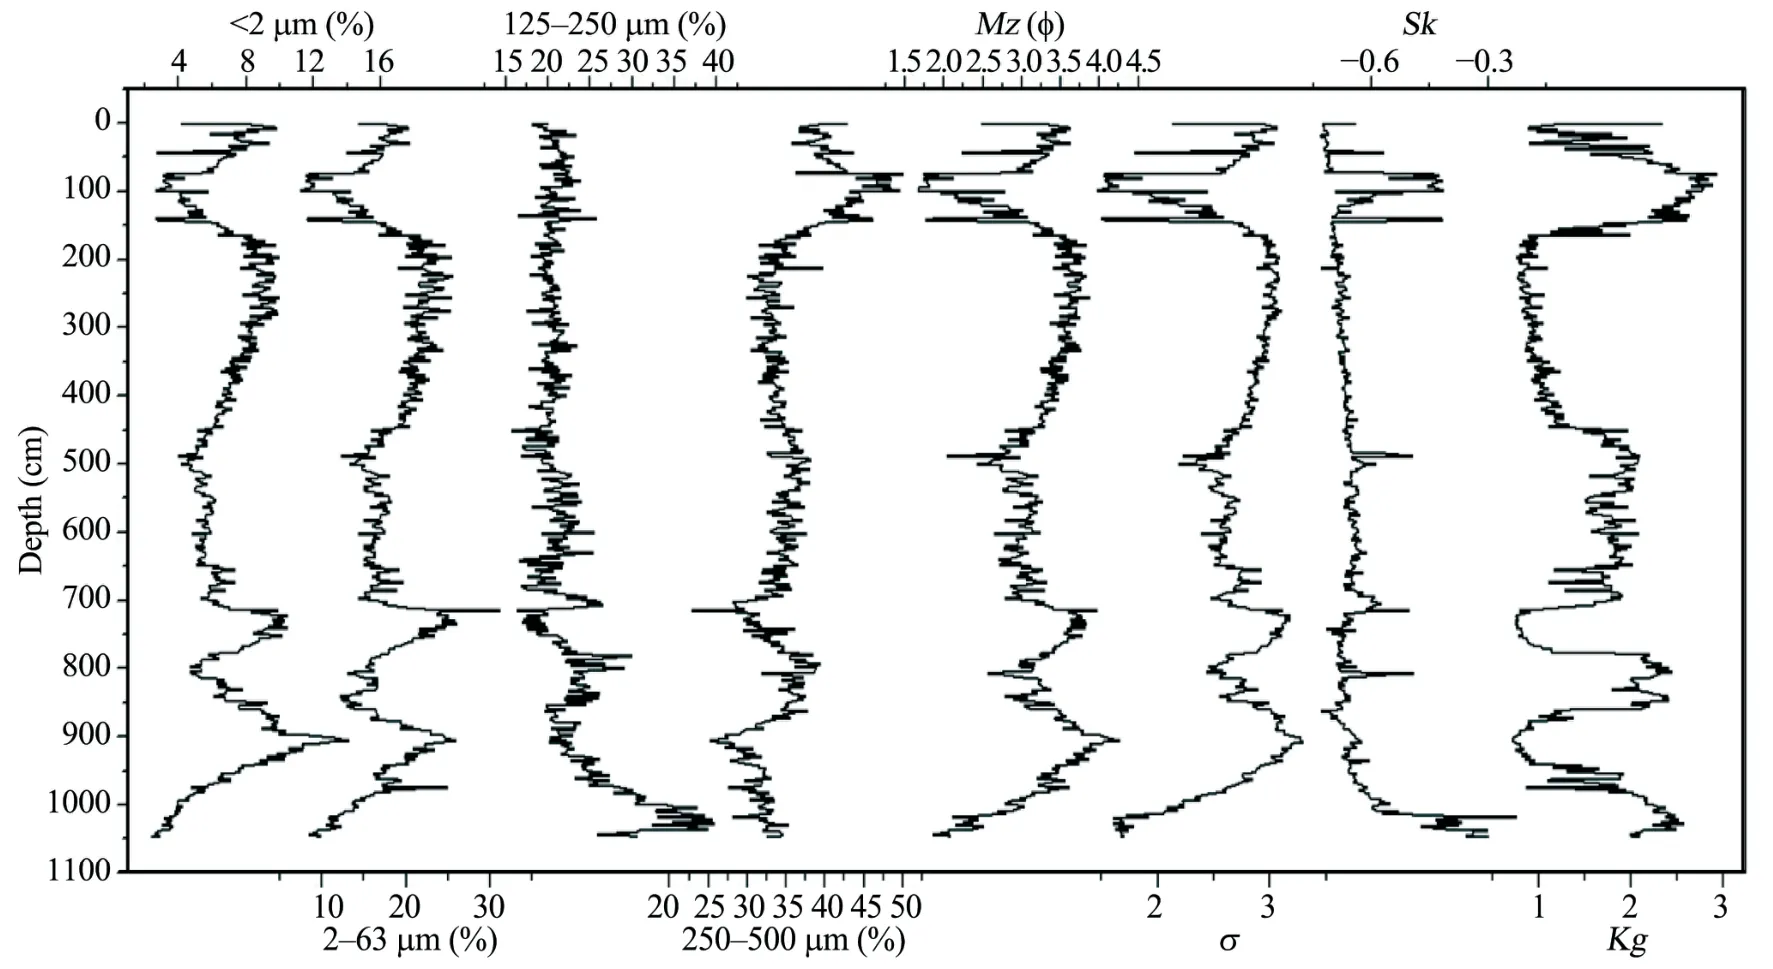
Figure 3 The characteristic of different grain size fraction and parameter change with depth on QF profile
The scatter plot of grain size parameters is a diagram of performance characteristics,thus it can reflect more accurately the characteristics of the sedimentary environment.We can see from the scatter plot of grain size parameters(Figure 4;Sk-Mz,σ-Mz,Kg-σandSk-σ),there is a significant environmental dividing line between the "Old Red Sand",beach sand and modern coastal dune sand,but it cannot be separated between beach sand and modern coastal dune sand,which indicate they have a better kinship,and the main material of modern coastal dune sand is beach sand.The "Old Red Sand" is presented as a paleocoastal dune sand,thus its sources could be beach sand,but due to later strong chemical weathering,it leads to a significantly increased content of clay and silt,and a decreasing of sorting,and grain size parameter scatter plot of "Old Red Sand" can be clearly distinguished from beach sand and coastal dune sand.
We made field observations when sampling,and no angular gravel layer and hiatus were observed.In order to test the stability of the sedimentary environment and reliability of the signal of EAWM reflected by grain size characteristics,mean grain size of the neighboring QFS profile was used to compare with data of QF profile.It can be seen from Figure 5,the mean grain size of the two profiles present good consistency,with a correlation coefficient of 0.41(P<0.05).The aforementioned facts illustrate that the depositional environment of QF "Old Red Sand" profile is more stable.Also,the winter monsoon,reflected by mean grain size,should be a more reliable signal rather than noise.At the same time,Figure 5 shows that the mean grain size of QFS profile was significantly larger than QF profile,if in consideration of QF profile is farther from the coastline than QFS profile,and also farther from the beach sand which is the material source of "Old Red Sand" deposition,and the depositions were distributed along the coastal zone towards the northeast or east.We can easily understand that the mean grain size of "Old Red Sand" depositions contain a significant signal of EAWM.
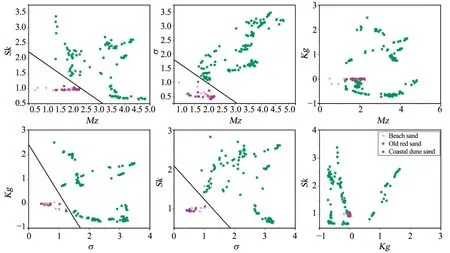
Figure 4 The grain size parameter scatter diagram of "Old Red Sand",beach sand,and coastal dune sand
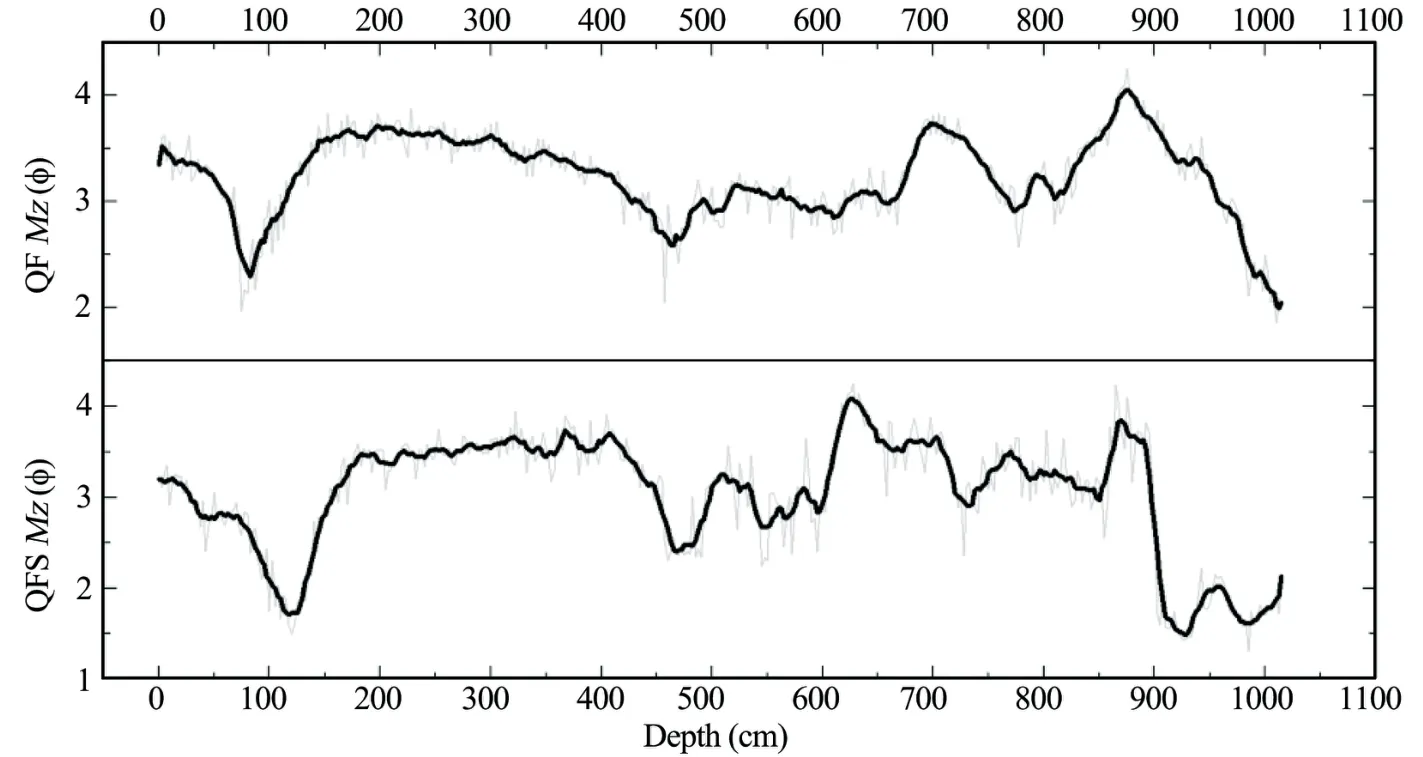
Figure 5 The mean grain size change of QFS and QF "Old Red Sand"
4.2 Sensitive grain-size group
Extracting environmentally sensitive grain size components (ESGSC) from the grain size distribution curve to discuss the environmental significance of different components in Quaternary palaeoenvironment reconstruction has been widely used.Currently,there are mainly three methods:(1) a mathematical method,Weibull distribution fitting (Sunet al.,2001);(2) grain size-standard deviation method (Xiaoet al.,2005);(3) end-member modeling of grain-size data (Prinset al.,2000).In this study,the standard deviation/grain-size classes diagram was used to extract the ESGSC from the QF profile.
Standard deviation values vs.grain size classes of QF profile are displayed in Figure 6.Four peaks are observed in the plot,at 0.634,5.709,154.104,and 409.163 μm,respectively,which represent the mode size of each grain-size component.Thus,the ESGSC of QF profile can be divided into four components,respectively:(1) <1.320 μm;(2)1.320-31.527 μm;(3) 31.527-251.105 μm;(4) >251.105 μm.Mean-size and content of these four components were then calculated according to grain-size data.
Component 1 was mainly of clay (Figure 7),its content and range was very little,the source of which was from later chemical weathering of coastal aeolian dune sand.Component 3 mainly consisted of coarse silt and fine sand,its content changes smoothly at the upper depth of 7 m.Thus,components 1 and 3 were not appropriate as a sensitive proxy to indicate the strength of winter monsoon.Component 2 was dominated by fine silt and clay,and component 4 was mainly of medium sand and coarse sand,and the content of the two components exhibit apparent fluctuations in relation to depth.The content of <16 μm is up to 20.3% in component 2,which is mainly derived from later chemical weathering of coastal aeolian dune sand and the transport process of collision and abrasive action that generate more fine grain material.Also,another case must be considered that the content variation of the two components exhibit opposite trends,suggesting the content variation of component 2 maybe passively caused by component 4.Thus,we think component 2 is also not appropriate for as a sensitive proxy to indicate winter monsoon strength.In consideration of the content of medium sand is up to 34.75% in component 4,and for proximal source wind transportation,the coarse grain-size component should be much better to indicate the strength of winter monsoon.Accordingly,we suggest that the ESGSC from QF "Old Red Sand" profile is component 4.
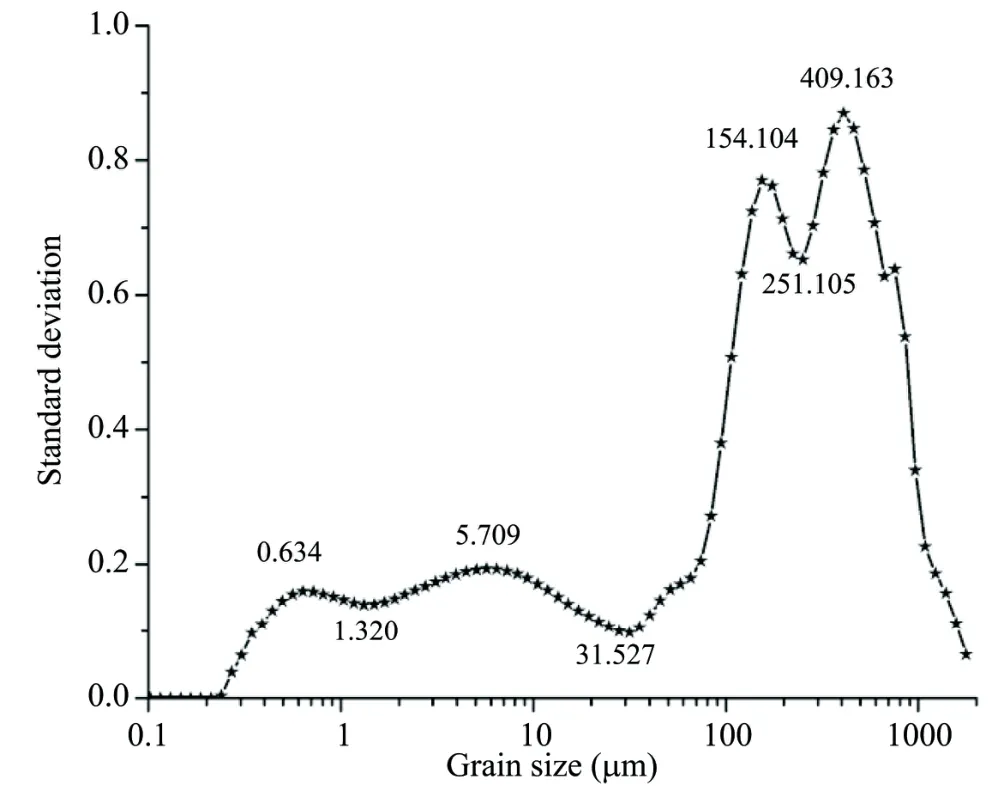
Figure 6 Standard deviation distribution along with grain size

Figure 7 Four main grain component content change of QF section
5 Discussion
The matrix algorithm was used to calculate the mean size of component 4 after determining which is the ESGSC from the QF "Old Red Sand" profile to reflect the strength of EAWM.In order to explore the evolution of EAWM recorded by the mean size of ESGSC from QF "Old Red Sand"from a global perspective,we compared it with δ18O recorded from Greenland GISP2 ice core (Grooteset al.,1993)and Hulu Cave stalagmite (Wanget al.,2001).When directly compared to each other from Figure 8,the overall trend has a good consistency.When the δ18O value of Greenland GISP2 ice core and Hulu Cave stalagmite are respectively more negative and heavier,corresponding to warm and summer monsoon dominated period,the mean size of ESGSC becomes relatively fine.In contrast,when δ18O values are positive and lighter,the mean size becomes coarser.Previous studies generally agree that the EASM and EAWM present an anti-phase relationship.Thus,the mean size curve of ESGSC from QF section reveals a detailed history of EAWM variations covering the past 44.0 ka,by using sequential clustering segmentation program,and the variations of EAWM can be divided into three stages as follows.
5.1 EAWM changes inferred from ESGSC
(1) 44.0-25.5 ka B.P.,roughly corresponding to Middle-Late MIS3 Stage.The mean size of ESGSC is relatively low,413.7 μm,showing an increasing trend and high-frequency variation,overall,indicating a relatively weak period of EAWM,but some increasing periods of EAWM also exist during that stage,perhaps reflecting the instability of climate in MIS3 Stage.In the Early MIS3 Stage,that is,roughly 44.0 ka B.P.corresponding to Late Wurm glaciation,the mean size value of ESGSC plotted a significant peak,and then decreased,with an increasing trend.This characteristic is also reflected by other records.
Jin and Zheng (1993) analyzed Quaternary pollen samples from cores and outcrops from Fuzhou,Pingtan,and Huian in the central coast of Fujian,and found there was a temperate forest-grass circumstance at 70-41 ka B.P.The vegetation was mainly ofArtemisiaand xerophytic Poaceae,and containing abundant Polypodiaceae and other ferns,which represented a cool or cold dry climate.Following the early regression of the Wurm glaciation,the transgression of Wurm interglaciation occurred.During this period,the marine strata was pervasively buried in the Quaternary drilling of the Fujian coast,and two transgressions occurred at 44-39 ka B.P.and 34-20 ka B.P.,respectively (Zeng,1993).Through pollen analysis along the coast of Fujian,Lu (1994)found that the Late Quaternary stratum of western Taiwan Strait sea area containedCoscindiseus,Podosirastellige,Melosirasulcataand other marine diatom fossils at 41 ka B.P.,29 ka B.P.,and 28 ka B.P.,indicating marine transgression occurred,with a significantly enhanced EASM and weakened EAWM during this period.The stalagmite record from Yongxing and Sanbao caves in Hubei also indicated a comparatively strong EASM and weak EAWM,and summer monsoon rainfall close to the Holocene Warm Period at the interval of 37-26 ka B.P.(Liuet al.,2008;Zhaoet al.,2008),and this situation was also reflected in the Hulu and Dongge caves (Yuanet al.,2004).In the MIS3 stage of the Yangtze River Delta region,the largest transgression since the Pleistocene occurred (Yanget al.,2004),and a weakened EAWM signal as recorded by Rb/Sr,color,magnetic susceptibility and grain size characteristics from Xiashu Loess in Nanjing at 43.3-23.8 ka B.P.(Zhanget al.,2008).
(2) 25.5-15.1 ka B.P.,roughly corresponding to MIS2 stage and Last Glacial Maximum.The mean size of ESGSC became coarser,reaching a mean value of 430.623 μm.The overall trend first increased and then decreased,with two peak values plotted at about 21.8 ka B.P.and 16.8 ka B.P.(Figure 8),also showing the strongest EAWM occurred at about 21.8 ka B.P.,after that the EAWM demonstrated a diminishing trend.During this stage,accompanying with global cooling,sea level fell,global ice volume increased,the Arctic ice cap shifted southwards,the Mongolian cold high pressure strengthened leading to enhanced EAWM.Strong northeasterly winds prevailed in the study area,with on the background of sea level fell that resulted in the widening range of sand sources,which significantly increased mean grain of ESGSC.
During this stage,the vegetation was mainly dominated byArtemisia,Poaceae,and temperate grassland or forest grassland in the southeastern coast area,growing with coniferous forest in mountainous and hill regions,andPiceaandLarixin local high altitudes,showing an increased cold-dry climate (Wenet al.,2009).General research shows that in the period of 25-15 ka B.P.,the sea level of China offshore fell dramatically,with about 500-600 km of the continental shelf of the East China Sea exposed (Wang JT and Wang PX,1980;Zhuet al.,1981).Zhanget al.(2009)suggested that the reason for favorable glacier development in the warmer MIS3 than in the colder MIS2 was clearly related to the enhancement of EAWM.As the Mongolian high pressure strengthened and shifted southeastward,the EAWM in the region would turn into northwest wind directly from continent,thus,the EAWM would cross the East Asian continent including the exposed region of the Taiwan Strait area,greatly reducing water vapor in the stadial period.The sand hill formed at 27-15 ka B.P.characterized by a coarser grain size also shows that the EAWM is very strong during this phase (Renet al.,2008).Sunet al.(2012) used the CCSM 3 mode to simulate the influence of a weakened North Atlantic meridional circulation on the East Asian monsoon circulation in the Last Glacial Maximum,and found that the EAWM was significantly enhanced in the Asian dust source region.
(3) 15.1-7.1 ka B.P.,roughly corresponding to the Late Last Glacial Maximum and Early Holocene.The mean size of ESGSC was the lowest,with a mean value of 410.2 μm,overall presenting a decreasing trend,indicating a weak EAWM during this stage.However,the mean size of ESGSC suddenly increased at about 11.0-9.9 ka B.P.,denoting a significantly enhanced EAWM which may be related to the YD event that occurred during the transition period from the last glacial to Holocene.
During the last deglaciation,15-10 ka B.P.,enormous changes occurred on the global surface.The ice caps of the Northern Hemisphere melted and sea level rebounded to about 120 m,resulting in expanded deluge of the continental shelf,while the reduction of high-latitude ice sheets caused the Mongolian cold high pressure to weaken,and the strength of the EAWM correspondingly decreased.The evolution of EAWM since 15,000 years,reconstructed by climate proxy of diatoms in Maar Lake,Guangdong,shows that the EAWM intensity weakened since the Holocene(Wang Let al.,2012).Xuet al.(2009) also obtained a weakened EAWM signal at 12-7 ka B.P.from the inner East China Sea shelf of Zhejiang-Fujian coastal drilling,which is consistent with the record by the ESGSC from QF "Old Red Sand".In the nearby area of Hainan,the activity of coastal sand is closely related to the strength of the EAWM.During the last deglaciation,15-7 ka B.P.,the activity of coastal sand significantly weakened,and the range of ancient sand ridges decreased (Liet al.,2009),which also indicates a significantly enhanced EASM and a weak EAWM during this stage.
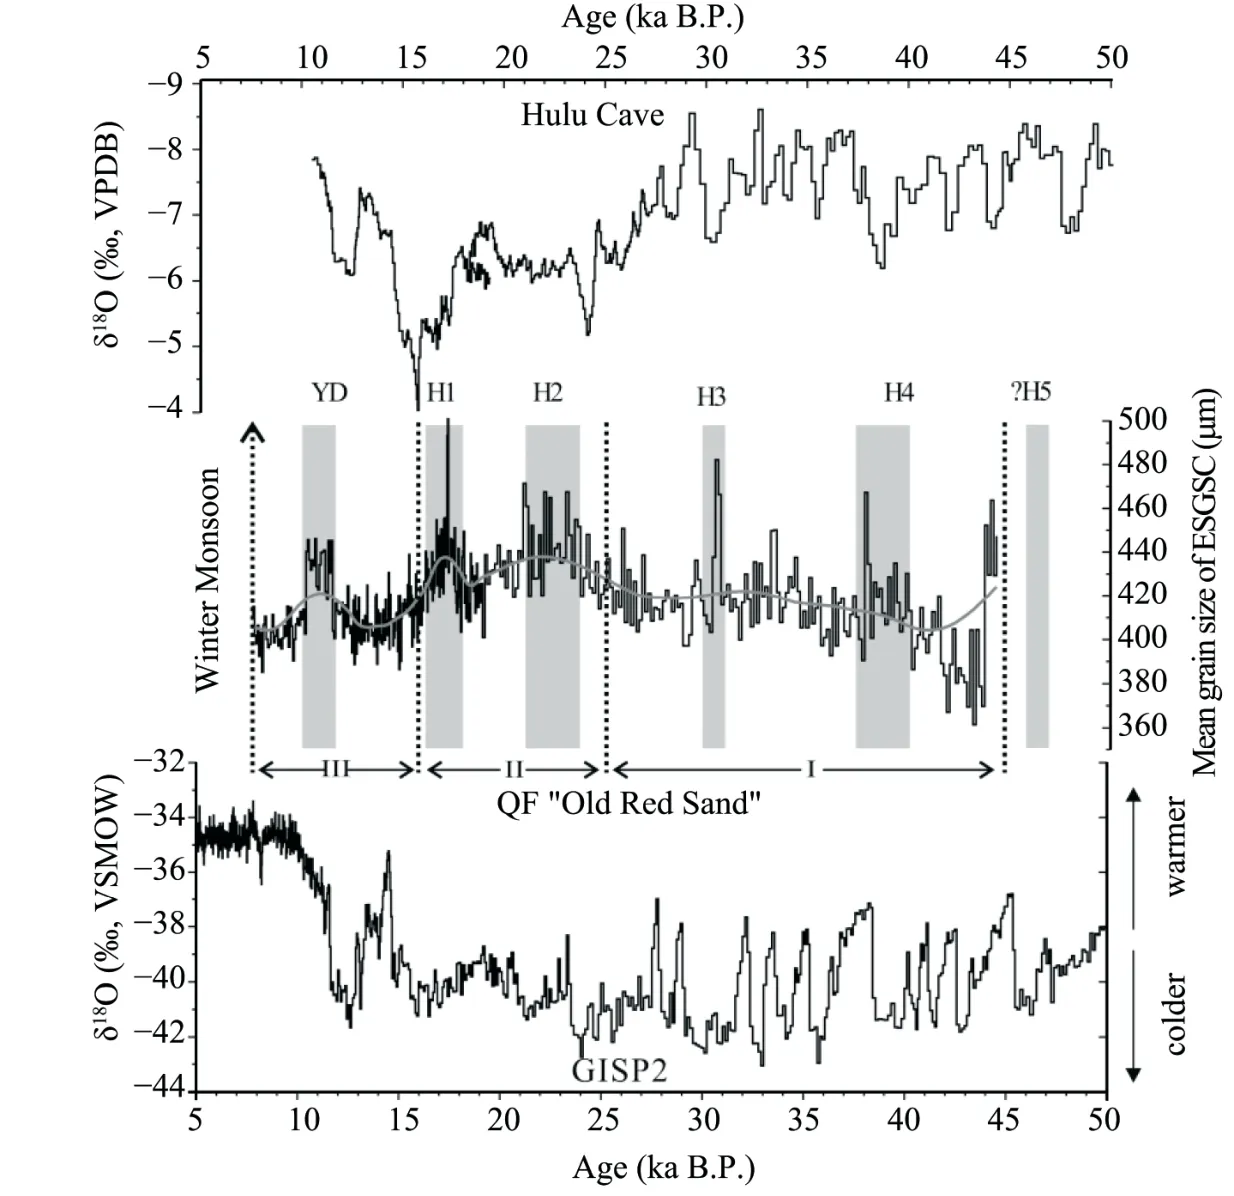
Figure 8 The EAWM change recorded by mean grain size of ESGSC and other records
5.2 Abrupt climate change events
Evidence from North Atlantic deep-sea sediments and Greenland ice cores reveals global ice volume changes,stimulating climate change instability on a millennial scale,in the last glaciation (Bondet al.,1993;Dansgaardet al.,1993).This instability has been recorded in Europe,North America and even the Pacific area (Thouvenyet al.,1994;Thunell and Mortyn,1995).Records of loess grain size,from the central portion of Chinese Loess Plateau,demonstrate that the Asian winter monsoon was also affected,showing an obvious response to Heinrich events (Guoet al.,1996;Fanget al.,1999;Sunet al.,2010).The result of oxygen isotope analysis with high resolution TIMS-U series dating from Hulu Cave and Qixing Cave,China,shows that the evolution of Asian summer monsoon had a high degree of instability in the Last Glacial Period (Wanget al.,2001;Zhanget al.,2004),as well as in the Arctic and North Atlantic regions.This confirms that cold events (H1-H5) also existed in the Asian monsoon zone as well as the North Atlantic,reveals that climatic instability of the North Atlantic zone is not a local phenomenon,but could have an universal significance in the Northern Hemisphere (Wanget al.,1999).
The southeastern coast of Fujian,located in the transition zone of the Pacific and the Eurasian continent,is the core area for the East Asian monsoon,with winter half year always being affected by the EAWM (northeasterly wind),thus it is a sensitive area to reconstruct the history of EAWM evolution.So,in this circumstance,does the mean grain size of ESGSC provide a better response to some abrupt climate change events (such as the Heinrich event)?
Research from the Chinese Loess Plateau show that loess grain size,which indicates Asian winter monsoon strength,provide a reliably record for the six Heinrich events that occurred in the Last Glacial Period.When a Heinrich event occurs,the grain size became coarser,denoting a strengthened intensity of the Asian winter monsoon (Fanget al.,1999;Sunet al.,2010).Abrupt climate change events were recorded by the mean grain size of ESGSC (Figure 8)occurred at 16.8 ka B.P.,21.8 ka B.P.,30.0 ka B.P.,and 37.4 ka B.P.,respectively,corresponding to the H1-H4 recorded by Greenland GISP2 ice cores (Grooteset al.,1993) and Hulu Cave stalagmite (Wanget al.,2001),showing a reaction between high and low latitudes,and a rapid response of low latitude climate to high latitude regions.However,when carefully compared with the three records,we find that the signal of D-O oscillating indicated with the mean grain size of ESGSC from QF "Old Red Sand" is not very remarkable.This is possibly related to a lower deposition rate and the sensitivity of different types of sediment response to climate change.
The Younger Dryas event is a short-term climate cooling that roughly occurred in 12.5 ka B.P.,which is the last cold event during the transitional period from the last glacial to the post-glacial period.In recent years,this event is reflected throughout the world.Previously,researchers suggested that it was a local phenomenon,which only took place in Northern Europe and high latitudes of the North Atlantic zone.In this paper,our records show that the Younger Dryas event occurred in 11.0-9.9 ka B.P.,was a climate cooling event during the last deglaciation,and was accompanied with a sudden strengthening of the EAWM.Subsequently,temperatures rebounded sharply,the EAWM weakened,the EASM strengthened,and the climate history entered into the Holocene.
6 Conclusion
We extracted the environmental sensitive grain size component (ESGSC) from the QF "Old Red Sand" profile using a grain-size-standard deviation method,with a component of >251.105 μm.The variation of grain size is mainly controlled by the strength of EAWM.During stronger EAWM,the energy of aeolian sand transportation will increase along the southeastern coast of Fujian,resulting in a much coarser grain size of the "Old Red Sand",andvice versa.Thus,the mean size of the ESGSC is an important proxy to reconstruct the evolutional history of the EAWM.
We reconstructed the evolutional history of the EAWM in the study area since 44.0 ka B.P.,which shows that evolution of the EAWM can be divided into three stages:(1)44.0-25.5 ka B.P.,the EAWM is relatively weak and overall increases gradually during its fluctuation;(2) 25.5-15.5 ka B.P.,with the strongest EAWM and high frequency fluctuation;(3) 15.5-7.1 ka B.P.,with a weaker EAWM,but during 11-10 ka B.P.,the EAWM was significantly enhanced.
A series of abrupt climate change events were recorded since 44 ka B.P.by the mean size of the ESGSC,showing a good consistency with δ18O records of Hulu Cave stalagmites and Greenland GISP2 ice cores,especially in detail,the YD event and four Heinrich events were all recorded,but the signal of D-O cycles was relatively weak.
We would like to thank ShengJi Qi and MeiRong Wu for field sampling and experiments in the College of Geographical Science,Fujian Normal University.We specially thank the two anonymous referees for their constructive suggestions.This work was supported by the National Natural Science Foundation of China (Grant No.41271031) and the Open Foundation of State Key Laboratory of Loess and Quaternary Geology,Institute of Earth Environment,CAS(Grant No.SKLLQG1113).
An ZS,Kukla G,Porter SC,Xiao JL,1991.Magnetic susceptibility evidence of monsoon variation on the Loess Plateau of central China during the last 130000 years.Quaternary Research,36:29-36.
An ZS,Liu TS,Lu YC,Porter SC,Kukla G,Wu XH,Hua YM,1990.The long-term paleomonsoon variation recorded by the loess-paleosol sequence in central China.Quaternary International,7-8:91-95.
Bond G,Broecker W,Johnsen S,McManus J,Labeyrie L,Jouzel J,Bonani G,1993.Correlations between climate records from North Atlantic sediments and Greenland ice.Nature,365:143-147.
Chen F,1994.Coastal eolian characteristics and development of Haitan Island,Fujian.Marine Sciences,6:46-50.
Chen JC,Zeng CS,Wu YG,1998.Distribution and sedimentary landform of"Old Red Sand" in coastal southeastern Fujian.Journal Ocenaography in Taiwan Strait,17(1):50-54.
Dansgaard W,Johnsen SJ,Clausen HB,Dahl-Jensen D,Gundestrup NS,Hammer CU,Hvidberg CS,Steffensen JP,Sveinbjörnsdottir AE,Jouzel J,Bond G,1993.Evidence for general instability of past climate from a 250 kyr ice-core record.Nature,364:218-220.
Ding ZL,Derbyshire E,Yang SL,Yu ZW,Xiong SF,Liu TS,2002.Stacked 2.6 Ma grain size record from the Chinese loess based on five sections and correlation with the deep-sea δ18O record.Paleoceanography,17(3):5-1-5-21.
Fang XM,Ono Y,Fukusawa H,Pan BT,Li JJ,Guan DH,Oi K,Tsukamoto S,Torii M,Mishima T,1999.Asian summer monsoon instability during the past 60,000 years:magnetic susceptibility and pedogenic evidence from the western Chinese Loess Plateau.Earth and Planetary Science Letters,168(3-4):219-232.
Grootes PM,Stuiver M,White JWC,Johnsen S,Jouzel J,1993.Comparison of oxygen isotope records from the GISP2 and GRIP Greenland ice cores.Nature,366:552-554.
Guo ZT,Liu DS,Wu NQ,Lu HY,Han JM,1996.Heinrich-Rhythm pulses of climates recorded in loess of the last two glaciation.Quaternary Science,16(1):31-40.
Jin DS,Zheng F,1993.Palaeoclimate in the coastal area of central Fujian in 120000 years BP.Geology of Fujian Province,12(3):218-227.
Li S,Liao XX,Wang GY,2009.Climatic and environmental changes in the coastal sandy land of Hainan Island in recent 40 ka.Geographical Research,28(5):1235-1242.
Li ZW,Li BS,Sun L,Wang FN,Wen XH,Niu DF,2011.Overview and prospect of research on Old Red Sand along Southeast Coast of China.Journal of Desert Research,31(1):49-57.
Liu DB,Wang YJ,Chen ST,Cheng H,Edwards RL,2008.Sub-Dansgaard-Oeschger events of East Asian Monsoon and their global significance.Quaternary Science,28(1):169-176.
Lu JJ,1994.Late Quaternary pollen assemblage and paleovegetation,paleoclimate along the coast of Fujian.Scientia Geographica Sinica,14(4):381-383.
Porter SC,An ZS,1995.Correlation between climate events in the North Atlantic and China during the last glaciation.Nature,375:305-308.
Prins MA,Postma G,Weltije G,2000.Controls on terrigenous sediment supply to the Arabian Sea during the late Quaternary:The Makran continental slope.Marine Geology,169:351-371.
Ren LX,He Y,Yang DY,2008.Study on the evolution of sandy hills along Poyang Lake area for the last 100,000 years.Geographical Research,127(1):128-134.
Sun DH,An ZS,Su RX,Wu XH,Wang SM,Sun QL,Rea D,Bloemenda J,2001.Mathematical approach to sedimentary component partitioning of poly modal sediments and its applications.Progress in Natural Science,11(3):269-276.
Sun YB,Clemens SC,Morrill C,Lin XP,Wang XL,An ZS,2012.Influence of Atlantic meridional overturning circulation on the East Asian winter monsoon.Nature Geoscience,5(1):46-49.
Sun YB,Wang XL,Liu QS,Clemens SC,2010.Impacts of post-depositional processes on rapid monsoon signals recorded by the last glacial loess deposits of northern China.Earth and Planetary Science Letters,289(1-2):171-179.
Tan HZ,Wu Z,2001.TL dating of the "Old Red Sand" on the coasts of Fujian and Guangdong.Journal of Desert Research,21(4):338-342.
Thouveny N,de Beaulleu JL,Bonifay E,Creer KM,Guiot J,Icole M,Johnsen S,Jouzel J,Reille M,Williams T,Williamson D,1994.Climate variations in Europe over the past 140 kyr deduced from rock magnetism.Nature,371:503-506.
Thunell RC,Mortyn PG,1995.Glacial climate instability in the Northeast Pacific Ocean.Nature,376:504-506.
Wang FN,Li BS,Niu DF,Li ZW,Wen XH,Si YJ,Du SH,Guo YH,2012.Holocene millennial scale climate variations from records of grain size and CaCO3in MGS1 segment of Milanggouwan Section in the Salawusu River Valley,China.Journal of Desert Research,32(2):331-339.
Wang JL,Li H,Deng W,Guo XY,Li S,Zhang JW,2012.Paleoenvironmental significance of magnetic susceptibility and grain size of lake sediments from Gaxun Nur,Inner Mongolia,China.Journal of Desert Research,32(3):661-668.
Wang JT,Wang PX,1980.The relationship between sea level changes and climate change since the late Pleistocene,eastern China.Acta Geographica Sinica,35(4):299-312.
Wang L,Li JJ,Lu HY,Gu ZY,Rioual P,Hao QZ,Mackayc AW,Jiang WY,Cai BG,Xu B,Han JT,Chu GQ,2012.The East Asian Winter Monsoon over the last 15,000 years:its links to high-latitudes and tropical climate systems and complex correlation to the summer monsoon.Quaternary Science Reviews,32:131-142.
Wang L,Sarnthein M,Erlenkeuser H,Grimalt J,Grootes P,Heilig S,Ivanova E,Kienast M,Pelejero C,Pflaumann U,1999.East Asian monsoon climate during the Pleistocene:high resolution sediment records from the South China Sea.Marine Geology,156(1):245-284.
Wang YJ,Chen H,Edwards RL,An ZS,Wu JY,Shen CC,Dorale JA,2001.A high-resolution absolute-dated Late Pleistocene monsoon record from Hulu Cave,China.Science,294(5550):2345-2348.
Wen XH,Li BS,Zheng YM,Du SH,Niu DF,Li HX,Ye JP,2009.Ages and grain-size characteristics of Reticulate Red Clay on first terrace in Dongjiang River Basin,southern Nanling Mountains.Geography and Geo-Information Science,25(5):59-63.
Wu Z,Huang S,Jin ZM,Hu SZ,1994.Research on the formation and laterzation of the "Old Red Sand Sediment" along the coastal of South China.Acta Geographica Sinica,49(4):298-305.
Wu Z,Wang W,1998.Formation of "old red sands" and paleogeographic environment on South China coasts.Science in China (Series D),41(3):306-313.
Wu Z,Wang W,2001.Finding and its significance of "Old Red Sand" strata with multiple depositional stages on the coasts of Fujian and Guangdong.Journal of Desert Research,21(4):328-332.
Wu Z,Wang W,Tan HZ,Xu FY,2000.The age of the "old red sand" on the coasts of south Fujian and west Guangdong,China.Chinese Science Bulletin,45(13):1216-1221.
Xiao SB,Li AC,Jiang FQ,Li TG,Huang P,Xu ZK,2005.Recent 2000-year geological records of mud in the inner shelf of the East China Sea and their climatic implications.Chinese Science Bulletin,50(5):466-471.
Xu FJ,Li AC,Wan SM,Liu JG,Wang HN,Zhou FF,2009.The geological significance of environmental sensitive grain-size populations in the mud wedge of the East China Sea during the mid-Holocene.Acta Oceanologica Sinica,31(3):95-102.
Yang DY,Chen KF,Shu XM,2004.A preliminary study on the paleoenvironment during MIS3 in the Changjiang delta region.Quaternary Science,24(5):525-530.
Yuan BY,Xia ZK,Li BS,Qiao YS,Gu ZY,Zhang JF,Xu B,Huang WW,Zeng RS,2008.Chronostratigraphy and stratigaphic division of soil in Southern China.Quaternary Science,28(1):1-13.
Yuan DX,Cheng H,Edwards RL,Dykoski CA,Kelly MJ,Zhang ML,Qing JM,Lin YS,Wang YJ,Wu JY,Dorale JA,An ZS,Cai YJ,2004.Timing,duration,and transitions of the last interglacial Asian Monsoon.Science,304:575-578.
Zeng CS,1993.A discussion on problems of marine transgression along the coast during the late Pleistocene.Journal of Tropical Oceanography,12(1):39-45.
Zeng CS,Chen JC,Wu YG,1999.Research on the "Old Red Sand" along the Coastal of Southeast Fujian.Geological Publishing House,Beijing,pp.1-74.
Zhang MH,Xia YF,Meng JW,Lai ZP,Wang YJ,2008.The especially warm and wet during MIS3 recorded by Xiashu loess.Acta Pedologica Sinica,45(1):9-15.
Zhang ML,Cheng H,Yuan DX,Shi LY,Tan JM,Zhang C,2004.The high resolution climate records from two stalagmites in Qixing Cave of Guizhou and the Heinrich events of the Last Glacial Period.Acta Geoscientica Sinica,25(3):337-344.
Zhang W,Yan L,Cui ZJ,Yang JQ,2009.Glacial environment during the last glacial cycle in the mountains of East Asia.Acta Geographica Sinica,164(1):33-42.
Zhao K,Kong XG,Cheng H,Wang YJ,2008.Intensity and timing of D-O events of East Asian Monsoon during the late episode of MIS 3.Quaternary Science,28(1):177-183.
Zhu YQ,Zeng CK,Jin CM,1981.The sea-level change of east China sea continental shelf since the late Pleistocene.Chinese Science Bulletin,19:1195-1198.
 Sciences in Cold and Arid Regions2013年2期
- Sciences in Cold and Arid Regions的其它文章
- Amount and temperature effects responsible for precipitation isotope variation in the southern slope of Himalayas
- Seasonal changes in the relationship between species richness and community biomass in grassland under grazing and exclosure,Horqin Sandy Land,northern China
- Afforestation effects on soil microbial abundance,microbial biomass carbon and enzyme activity in dunes of Horqin Sandy Land,northeastern China
- The effects of extreme rainfall events on carbon release from biological soil crusts covered soil in fixed sand dunes in the Tengger Desert,northern China
- Probabilistic modeling of soil moisture dynamics in a revegetated desert area
- Effects of shrubs and precipitation on spatial-temporal variability of soil temperature in microhabitats induced by desert shrubs