Prediction of China’s Submerged Coastal Areas by Sea Level Rise due to Climate Change
ZUO Juncheng1), YANG Yiqiu1), *, ZHANG Jianli2), CHEN Meixiang1), and XU Qing1)
Prediction of China’s Submerged Coastal Areas by Sea Level Rise due to Climate Change
ZUO Juncheng, YANG Yiqiu, ZHANG Jianli, CHEN Meixiang, and XU Qing
1),,,210098,2),300171,
Based on the simulation with the Ocean-Atmosphere Coupled Model CCSM and Ocean Model POP under the greenhouse gas emission scenario of the IPCC SRES A2 (IPCC, 2001), and on the earth crust subsidence and glacier melting data, the relative sea level change is obtained along the coast of China in the 21st century. Using the SRTM elevation data the submergence of coastal low land is calculated under the extreme water level with a 100-year return period. The total flooding areas are 98.3×10and 104.9×10kmfor 2050 and 2080, respectively. For the three regions most vulnerable to extreme sea level rise,, the coast of Bohai Bay, the Yangtze River Delta together with neighboring Jiangsu Province and northern Zhejiang Province, and the Pearl River Delta, the flooded areas are 5.0×10, 64.1×10and 15.3×10kmin 2050 and 5.2×10, 67.8×10and 17.2×10kmin 2080, respectively.
sea level rise; submerged area;extreme water level of 100-year recurrence; 1985 National Height Datum
1 Introduction
The sea level is the average sea surface height over a long period of time, which includes the relative sea level and absolute sea level. The relative sea level usually obtained from tidal gauge records contains, beside other sources, the local land subsidence and is more valuable in coastal engineering applications. The absolute sea level is mainly caused by the volume change of ocean basins as a result of tectonic movement and glacier melting and freezing associated with climate change. The absolute sea level change can be obtained from satellite altimeter data and is an important scientific topic in today’s oceanography and climate research.
Influenced by global warming, the global mean sea level has been rising slowly in the last 50 years. According to the 4th assessment reports of the Intergovernmental Panel on Climate Change (IPCC), the mean rising rate of the global mean sea level during the 20th century is 1.7mmyearand increases to 3.1mmyearduring 1993–2003, and the steric sea level accounts for 42% of sea level rise (Yan, 2008). It is predicted that the global mean sea level will rise 0.18–0.59m by the end of the 21st century just considering the contribution of thermostatic change. If the impact of land-based glaciers is added, the probable maximal mean sea level rise will be 0.79m (IPCC, 2007). By the end of the 21st century, the sea level along the coast of China will rise 0.22–0.42m with large regional differences: the sea level rise of the Bohai Sea can be up to 0.37m while in the Yellow Sea and East China Sea, it is about 0.33m (Chen., 2012).
River deltas and coastal plains are the most vulnerable regions to sea level rise and climate change. For low-lying, sandy and sludge coasts, a small sea level rise may significantly aggravate the disaster of storms and marine erosions (Chen., 2008). China has a coastline of 18000km, and the eleven coastal provinces account for 13.6% of the land area of the country. More than 60% of social wealth is distributed in the coastal region and more than 50% of population lives in this region (Yang, 1998). The three major disaster regions that are frequently hit by coastal storms in China are the Bohai bay (the Yellow River delta and Laizhou bay), the coast of Jiangsu and northern Zhejiang (the Yangtze River delta), and the Pearl River delta. These areas account for 70% of the coastal regions threatened by sea level rise (Ji., 1994; Du., 1995, 1997). With the accelerated sea level rise caused by climate warming, the flooded regions will become more and more lager (Yu, 2004).
A few studies on the sea level rise impact on coastal wetlands in China were mostly conducted before the mid-1990s. These studies did not consider the influence of climate change and critical movement of the crust. In this paper, the possible submergence by sea level rise along the coast of China will be discussed based on sea level prediction and high-precision terrain information, and the regions vulnerable to coastal inundation due to sea level rise will be identified.
2 Data and Method
Data from 30 tidal gauges along the coast of China are used in this study (Fig.1). The 100-year return extreme water level is calculated by using the Gumbel Method for a series of annual maximum water level (Gumbel, 1941).
Assuming that the series of annual maximum water level,,,…,,…,, obeys the Gumbel dis-tribution, the frequency, when the water level is higher than a certain valuex, can be expressed as:

, (2-2)
where

Extreme water level with a-year (=1/) return period is calculated by substituting theandinto Eqs. (2-1) and (2-2).
,
where

,
which is dependent onandthat can be obtained from relevant tables.
As an example, the data from the Shanwei Station have been used to calculate the extreme water level of 100-year return period with the above formulas (Fig.2).
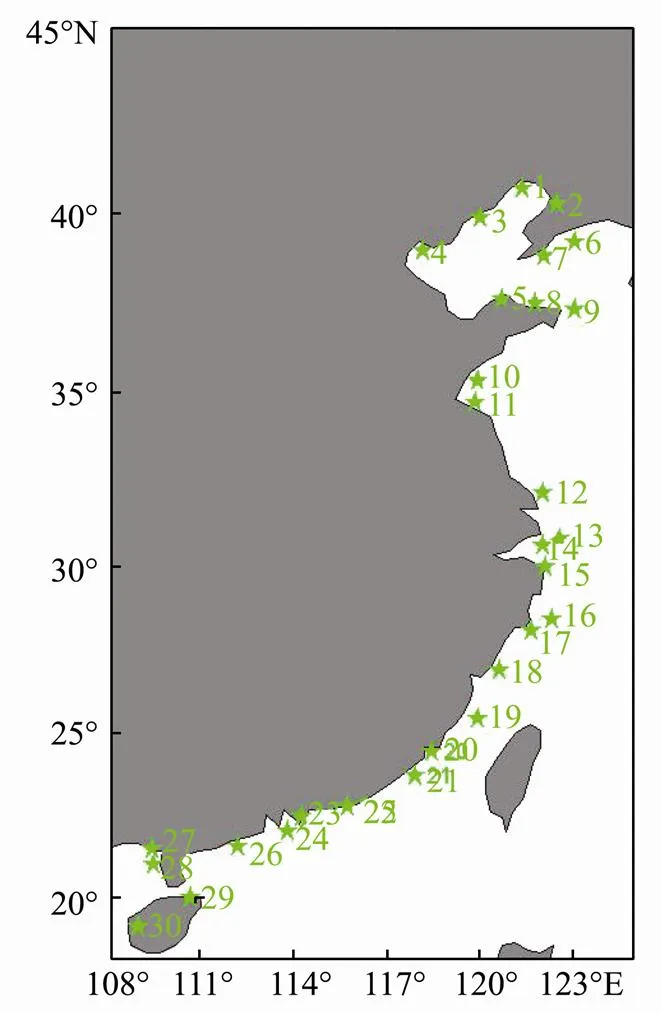
Fig.1 Location of the long term tidal stations.
The horizontal resolution and precision of topographic data influence the accuracy of computation of submergence. In this paper, the topographic data are obtained from the Shuttle Radar Topography Mission (SRTM) conducted by U.S. National Aeronautics and Space Administration (NASA). The SRTM data are available from 3 arc second (approximately 90m resolution) DEM, the SRTM3 version 4.1 (http://srtm.csi.cgiar.org) published in 2009, from which the topographic data along the coast of China (18˚–45˚N, 108˚–125˚E) are extracted.
The vertical datum of the SRTM data is the Earth Gravity Model 96 (EGM96) geoid and the horizontal datum is the World Geodetic System 1984 (WGS84). When converting EGM96 to China’s 1985 National Height Datum (NHD), a 35.7cm vertical shift is added to the elevation data (Guo., 2004).
There are three main methods to predict wetland loss due to sea level rise, the elevation-area method, the sedimentation rate method, and the numerical method (Li., 2006). The elevation-area method, one of the more popular methods, is used in this study. By applying the SRTM data with a horizontal resolution of (1/1200˚)×(1/1200˚)in the coastal area, the relative sea level and the submerged land area in 2050 and 2080 are calculated. The predicted sea level rise includes the effect of land glacier melting causing on extreme water level with a 100-year return period, and the crust subsidence. The inundated area due to the future sea level rise is calculated by adding up the areas of all submerged land grid cells. In this paper all the predicted values are calculated starting from 2000.
3 Sea Level Variation in the Future
3.1 Prediction of Sea Level Variation Along the Coast of China
Based on the assumption of the linear trend of global warming under the scenario of the IPCC A2 and trend prediction of the 21st century global sea level change by Community Climate System Model (CCSM), the general ocean circulation model Parallel Ocean Program (POP) predicts that by the end of the 21st century, the sea level will rise by 22–42cm due to greenhouse gas emissions, changes in ocean water density and dynamic factors along the Chinese coast (Chen., 2012). Fig.3 shows the sea level rise relative to the 2000 sea level in 2050 and 2080, respectively. Relative to China’s 1985 National Height Datum, the 2050 and 2080 sea surface elevations are obtained by adding the predicted sea level rise to the 2000 sea level. As the spatial resolution of the POP model is lower than the SRTM elevation data, the sea levels of 2050 and 2080 are linearly interpolated to the grid of the SRTM data.
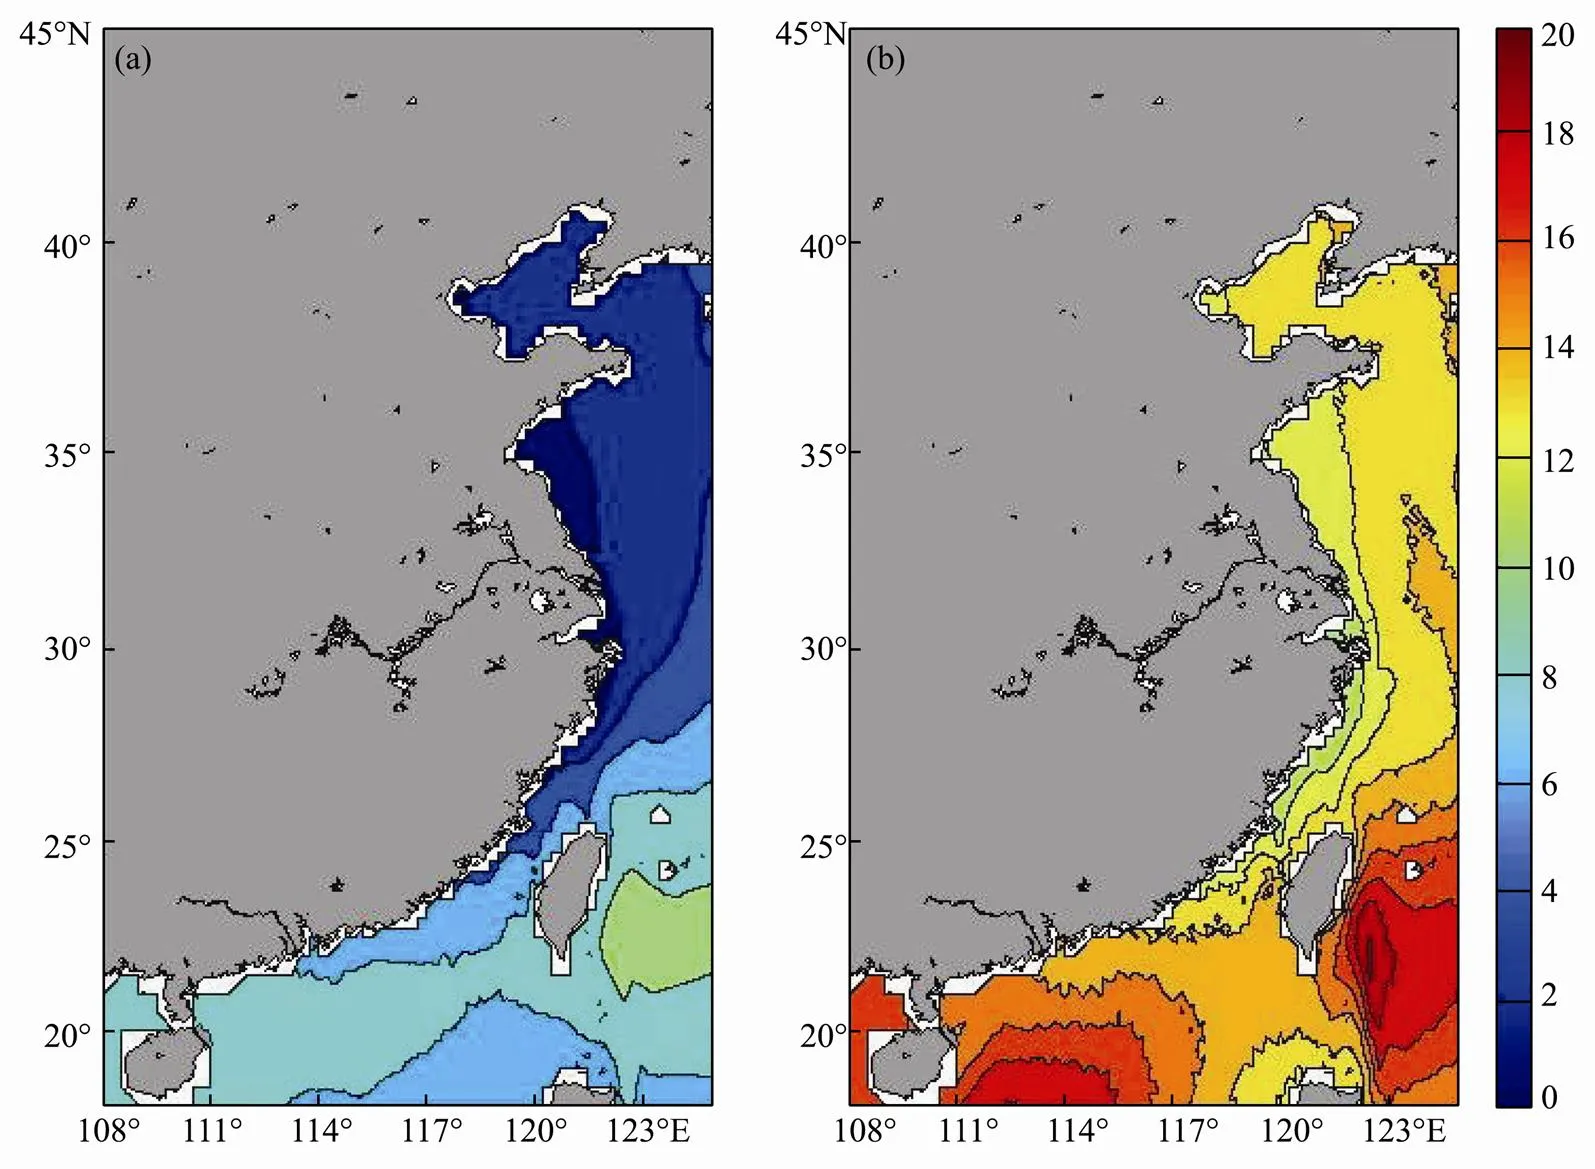
Fig.3 Absolute sea level rise along the coast of China in 2050 (left) and 2080 (right) (unit: cm).
3.2 Contribution of Land Ice Melting
Melting of land glaciers and polar ice sheets caused by global warming increases the mass of seawater and results in sea level rise. Church. (2001) indicated that the ice melting may contribute to the global sea level change in the 21st century, which is about 10–20cm as pointed out in the IPCC report (2007). On the other hand, excluding the impact of land glacier melting, the CCSM model predicts that the sea level change is also caused by the changes in seawater density and ocean dynamic processes following climate change. Mitrovica. (2001) showed that the sea level change in the northwestern Pacific Ocean resulting from the Antarctic and Greenland glacier melting is close to the global average. Thus the global average value of 15cm is used for the sea level rise due to land glacier melting along China’s coast from 2000 to the end of the 21st century. A linear interpolation of this value yields the sea level rises of 7.5cm and 12cm for 2050 and 2080, respectively.
3.3 Contribution of Land Subsidence
Vertical movement of earth crust and land subsidence makes a significant contribution to regional sea level rise, especially in the deltas of large rivers. Big coastal cities lying on the alluvial plain of large rivers such as Tianjin, Shanghai, and Guangzhou have remarkable ground compactness problem. Meanwhile, excessive exploitation of groundwater and additional load of large buildings accelerate the land subsidence and indirectly contribute to the sea level rise.
It has been pointed out that the coastal land subsides at the same vertical rate as the tidal gauge bench marks obtained from the isostatic model (Huang., 1991; Dong., 2010; Han., 1994). If the future land subsidence rate is such as predicted by Huang. (1991), the subsidence from 2000 to 2050 and 2080 can be obtained. Using two observed elevation datasets of the tidal gauge bench marks in 1965 and 1979, the land subsidence rates at 15 tide stations are calculated and interpolated to the coastal elevation data grid. Divided by the Wenzhou to Hangzhou zone, the coast of China is basically descending at an average rate of −2.3mmyearin the north and ascending with an average rate of 1.4mmyearin the south. The average rate of vertical movement of the entire coast is −0.8mmyear(Huang., 1991).
3.4 Relative Sea Level Variation in the Future
The low-lying coastal areas can be submerged due to the relative sea level rise. The main factors influencing the relative sea level variation are land subsidence, seawater volume change due to heat expansion and cold contraction and land glacier melting, and regional sea level change related to the transport of ocean circulation. The relative sea level rise will be predicted by adding up these factors (Fig.4).
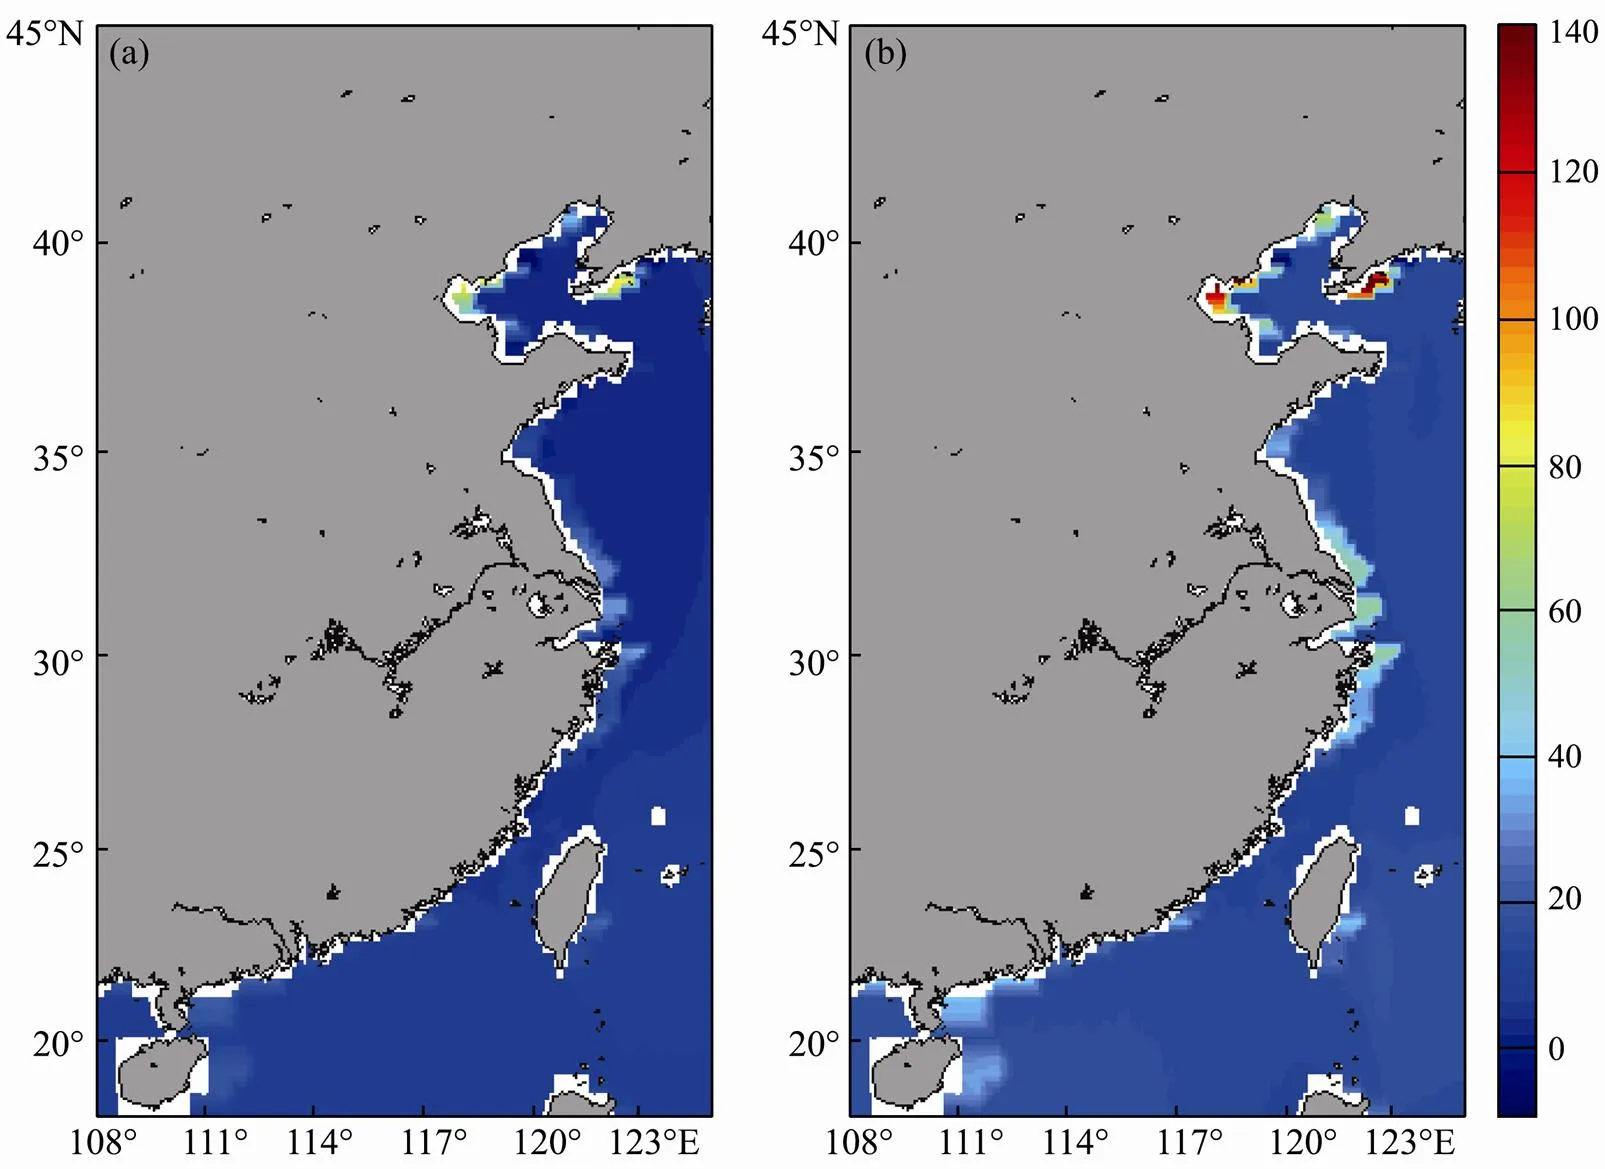
Fig.4 Relative sea level rise in 2050 (left) and 2080 (right) (unit: cm).
4 100-Year Return Water Level
The sequences of annual highest water levels at 30 tidal stations are analyzed and the 100-year return extreme water levels are calculated using the Gumbel Method (Gumbel, 1941) (Table 1). The 1985 National Height Datum was usedasthereferencelevel(Chen,1988)andthetrans- formed results were interpolated to the elevation grids.

Table 1 Extreme water levels of 100-year recurrence of 30 long term tidal stations
5 Predicted Submerged Areas Along the Coast of China
The extreme high water level has direct impact on coastal regions. For most of the low-lying coasts of China, especially the Bohai Bay, the Yangtze River Delta, and the Pearl River Delta, even a small sea level rise may cause catastrophic submergence when the extreme water level occurs.
Considering the concurrence of the 100-year return water level and the sea level rise due to global warming, land ice melting, and land subsidence, the coastal submergence was predicted for 2050 and 2080. The detailed discussion on submergence will focus on the three coastal regions vulnerable to sea level rise without considering the seawalls along the coast of China,, the coast of the Bohai Bay (the Yellow River Delta), the Yangtze River Delta and the neighboring coasts of Jiangsu and the northern Zhejiang, and the Pearl River Delta. The following is not referring to the actual submerged area, for the impact of overtopping dam water quantity is not considered in this study.
5.1 The Possible Flooding Along the Coast of China by 2050 and 2080
Most studies about the land submergence have assumed a constant sea level rise for different regions. For example, Du. (1997) calculated the coastal submergence in China by assuming a sea level rise of 30, 65 and 100cm, respectively. However, the spatial distribution of sea level change and vertical crustal movement is very complex and the calculation of Du. cannot reflect the true situation. In this paper, we have given different values of sea level rise and considered the main factors affecting sea level rise; the possible submerged area along the coast of China by 2050 and 2080 is given when extreme water level of 100-year recurrence occurs under sea level rise condition (Table 2, Figs.5 and 6).

Table 2 Predicted areas of submergence under the concurrence of the 100-year return water level and sea level rise along the coast of China in 2050 and 2080
Table 2 shows that the possible flooded areas along the coast of China are about 98.30×10kmand 104.94×10kmrespectively in 2050 and 2080, which account for 1.02% and 1.09% of the nation’s territory. Using the same extreme water level, the submerged area in 2080 is 6.65×10kmlarger than that in 2050, which is directly associated with relative sea level rise. The land submergence mainly occurs in the river deltas with the largest submergence in the Bohai Bay and the northern Jiangsu (Figs.5 and 6).
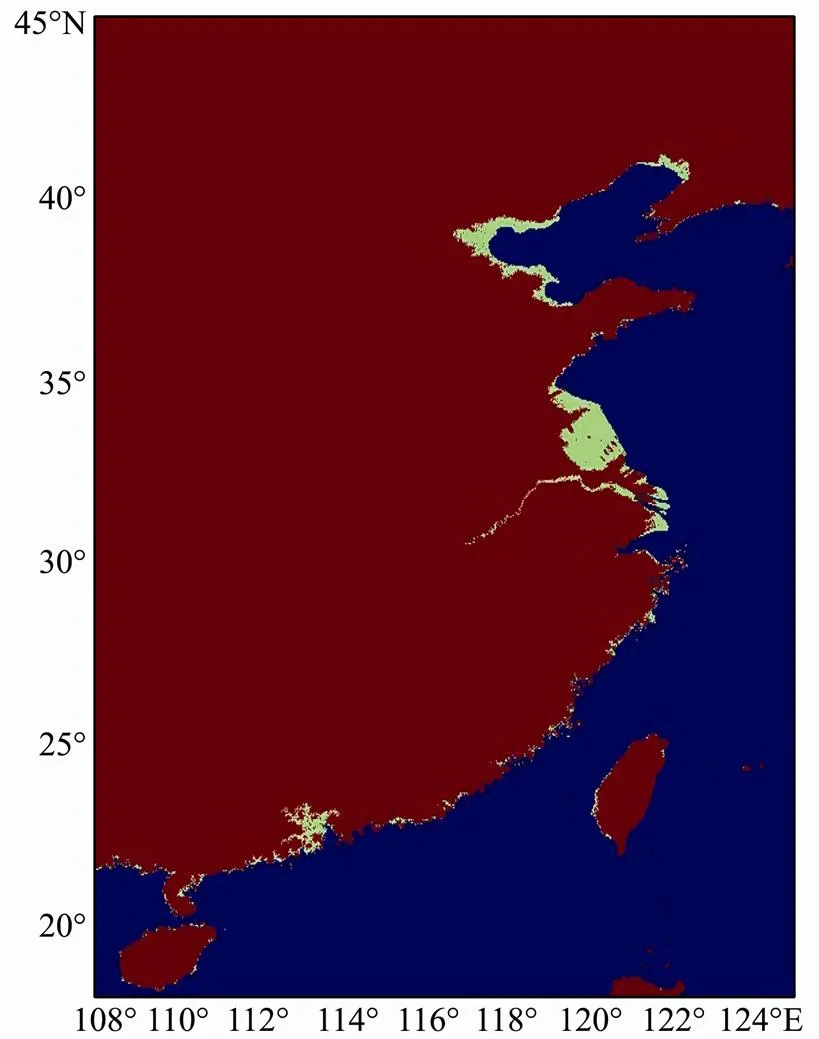
Fig.5 The possible flooding under the concurrence of the 100-year return water level and sea level rise along the coast of China in 2050.
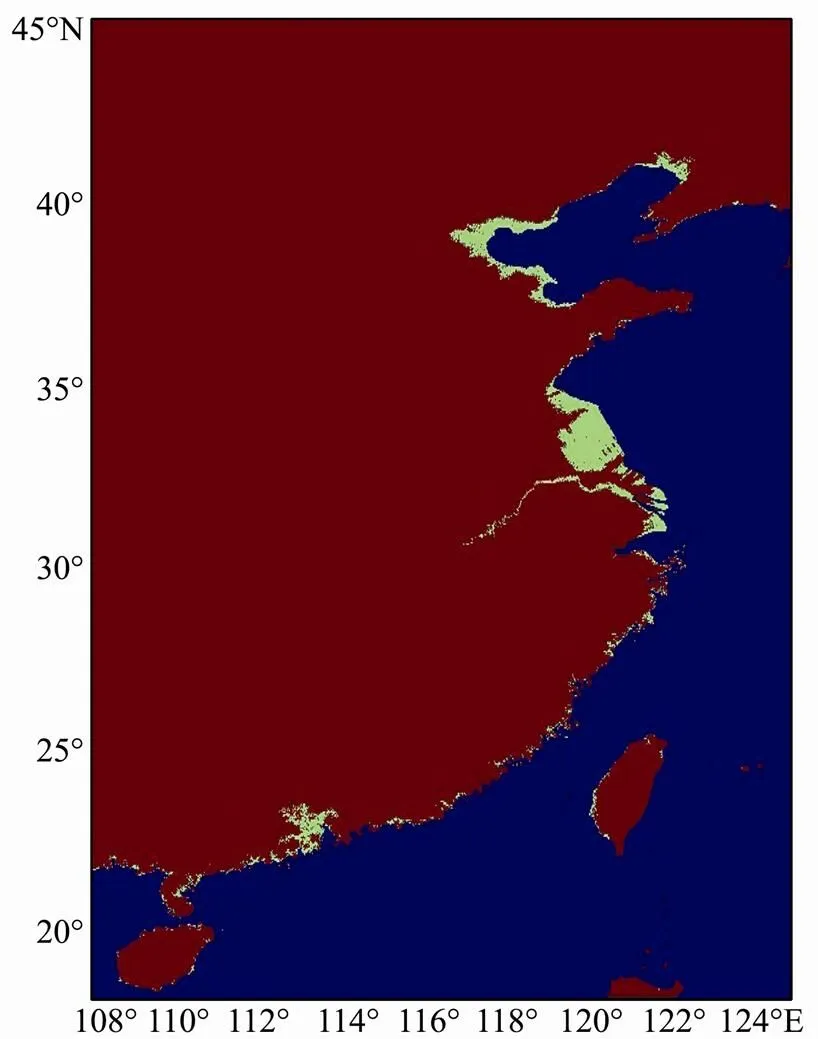
Fig.6 The possible flooding under the concurrence of the 100-year return water level and sea level rise along the coast of China in 2080.
5.2 Flooding of the Three Regions in 2050 and 2080
For the low-lying coastal areas, sea level rise will significantly aggravate the land submerging. China’s river deltas account for most of these areas. As mentioned earlier, the three major low-lying regions from north to south are the Bohai Bay (the Yellow River Delta, 36˚30΄–40˚30΄N, 116˚00΄–120˚30΄E), the Yangtze River Delta (the Jiangsu coast and the northern coast of Zhejiang, 28˚30΄–35˚20΄N, 118˚00΄–123˚00΄E), and the Pearl River Delta (21˚00΄–24˚00΄N, 112˚00΄–116˚00΄E). The surrounding areas impacted by the land submergence of the three regions in 2050 and 2080 are showed in Table 3 and Figs.7, 8 and 9.

Table 3 The influenced areas of the three major endangered regions under concurrence of the 100-year return water level
The possible influenced areas by the land submergence of the three major endangered regions are 84.50×10and 90.19×10kmin 2050 and 2080, respectively, which accounts for 85.96% and 85.94% of total influenced area along the Chinese coast under the 100-year return water level. Thus these regions could be the major disaster areas related to future sea level rise.
The possible influenced areas of the Pearl River Delta are 5.02×10kmand 5.18×10kmin 2050 and 2080, respectively, accounting for 5.94% and 5.74% of the total influenced area of the three major influenced regions mentioned above. The possible influenced area in the Pearl River Delta is larger in 2080 than in 2050, but accounts for a lower percentage of the total influenced area of the three regions. Separated by the Wenzhou to Hangzhou zone, the northern coast tends to descend, and the southern coast tends to rise (Du, 1993).
The possible influenced areas of the Yangtze River Delta are 64.14×10and 67.80×10kmin 2050 and 2080, respectively, and account for 75.91% and 75.18% of the total influenced area contributed by the three major regions. The Yangtze River Delta, together with the Jiangsu and the northern Zhejiang coasts, has the largest local influence among the three regions. Comparing the results for 2080 and 2050, the possible influenced area increases by 3.66×10km, but the percentage decrease by 0.92% due to the non-linear change in sea level rise from 2050 to 2080.
The possible influenced areas of the Bohai Bay are 15.34×10kmand 17.21×10km, in 2050 and 2080, respectively, and account for 18.15% and 19.08% of total influenced area of the three regions. Different from the other two regions, the influenced area for the Bohai Bay region is larger in 2080 than in 2050 and the percentage of the total submerged area for the three regions also increases by 0.95% due to the coastal sink in the north China (Du., 1993).
Figs.7, 8, and 9 show that sea level rise would submerge the low-lying coastal areas around the three regions. The possible influenced area is larger in 2080 than that in 2050. The low-lying areas around the Pearl River Delta include 3 rivers and 8 estuaries. Sea level rise combined with the 100-year return water level will flood the land along rivers and estuaries (Fig.7). The possible influenced area of the Yangtze River Delta is the largest among the three regions. 653000 hectares of tidal flats in Jiangsu account for 1/4 of the total tidal flat area in China (Ren, 1996), which makes Jiangsu the most seriously influenced province by sea level rise. The possible influenced area along the Jiangsu coast is 3.14×10kmand 3.27×10kmin 2050 and 2080, respectively. As a result of ground subsidence due to groundwater over-mining and construction of large buildings around and in the cities Tianjin and Tanggu, located beside the Bohai Bay, larger land area would be submerged because of relative sea level rise. The subsidence rate (Huang., 1991) adopted reflects the natural tectonic movement, but would lead to the increase of possible submerged area in the region confronting the 100-year return water level (Fig.9).

Fig.7 The possible influenced areas of the Pearl River Delta under the 100-year return water level for 2050 (left) and 2080 (right).

Fig.8 The possible influenced areas of the Yangtze River Delta under the 100-year return water level for 2050 (left) and 2080 (right).
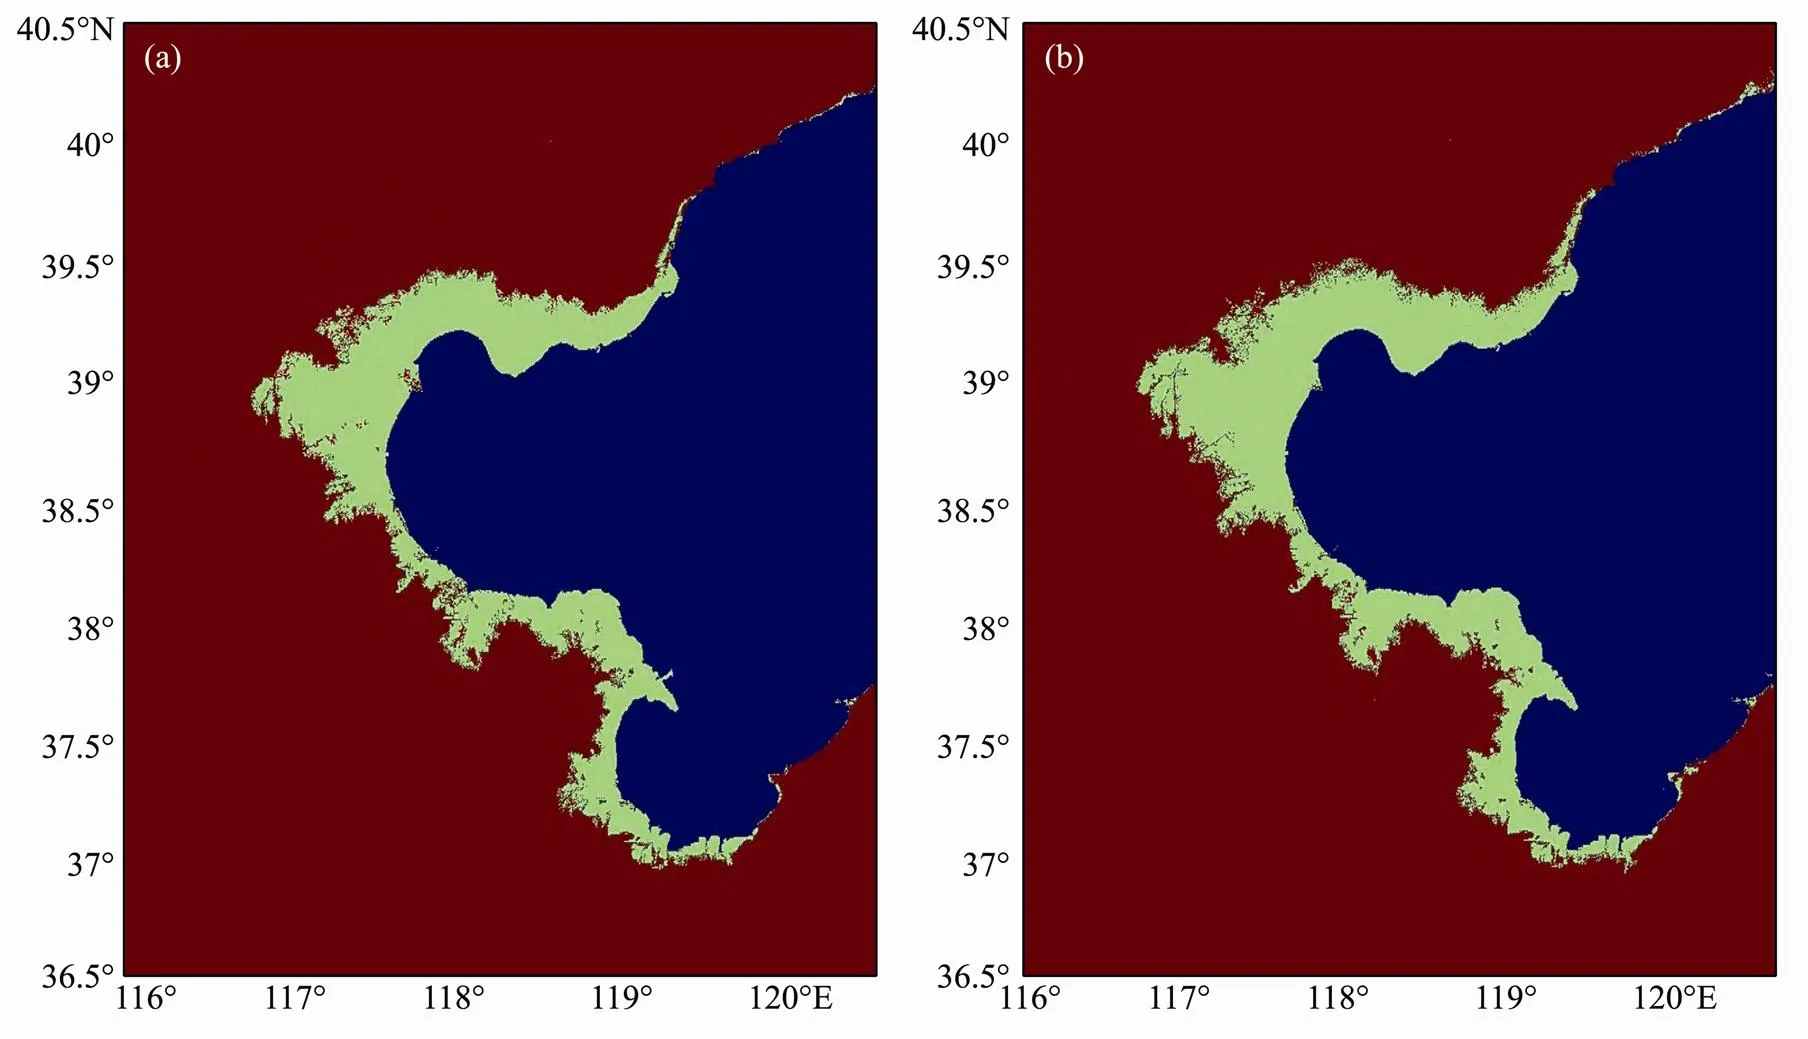
Fig.9 The possible influenced areas of the Bohai Bay under the 100-year return water level for 2050 (left) and 2080 (right).
6 Conclusions
The horizontal resolution and precision of the elevation data determine the calculation accuracy of submerged land areas due to sea level rise. Different from the 1:1000000 terrain database and Digital Elevation Model (DEM) used in previous studies, the SRTM3 digital elevation data are adopted in this study.
Assuming that all regions have a constant value of sea level rise, Du. (1997) calculated submerged areas along China’s coast. But in reality the spatial variation of sea level rise can be great on account of vertical deformation of earth crust. In this study, numerical simulations are conducted to calculate synchronous sea level rise due to climate change along China’s coast for the 21st century.
The simulation shows the absolute sea level change. However, the relative sea level changes account for the influence of ground vertical movement. IPCC (2007) reported that global sea level would rise about 10–20cm more should land glacier melting be considered. Because the simulation results in this study has excluded the effect of land glacier melting on sea level change, it is assumed that sea level change along China’s coast agrees with the global average and a linear sea level rise exists for the future. Thus the land glacier melting would cause a 7.5cm and 12cm sea level increase along China’s coast in 2050 and 2080, respectively.
Applying China’s 1985 National Height Datum for the topographic and water level data, and considering the sea level change due to climate change obtained by CCSM, the ground vertical movement, and the 100-year return water level, the potential submerged areas along the Chinese coast are 98.2988×10kmand 104.9437×10kmin 2050 and 2080, respectively. Under the condition of the 100-year return water level, the possible submerged areas in three regions,, the Bohai Bay (the Yellow River delta), the Yangtze River delta, and the Pearl River Delta, are 5.0×10, 64.1×10and 15.3×10kmin 2050, and 5.2×10, 67.8×10and 17.2×10kmin 2080, respectively.
Acknowledgements
This study is supported by the National Key Technology R&D Program (No. 2007BAC03A06), the National Natural Science Foundation of China (NSFC) project (No. 40976006), the National Marine Public Welfare Research Project of China (No. 201005019), Key Laboratory Project (Key Laboratory of Coastal Disasters and Defence, Ministry of Education, No. 200808), Laboratory of Coastal Disasters and Defence, Ministry of Education) (No. 200802).
Chen, C. L., Zuo, J. C., Du, L., and He, Q. Q., 2012. Long term trends in global sea level under IPPCC SRES A2 scenario., 34 (1): 29-38 (in Chinese with English abstract).
Chen, M. C., Zuo, J. C., Chen, M. X., Zhang, J. L., and Du, L., 2008. Spatial distribution of sea level trend and annual range in the China Seas from 50 long terms tidal gauge station data., 583-587.
Chen, Z. Y., Zhou, T. H., Yu, Y. F., Tang, E. X., and Huang, Y. F., 1988. A study on the 1985 national datum level of altitude., 18 (1): 9-13 (in Chinese).
Church, J. A., Gregory, J. M., Huybrechts, P., Kuhn, M., Lambeck, K., Nhuan, M. T., Qin, D., and Woodworth, P. L., 2001. Changes in sea level., 639-694.
Dong, K. G., Xu, M., Yu, Q., and Wang, W., 2010. Threshold of groundwater over–exploitation and conservation–restortion in Tianjin land subsidence area., 32 (1): 30-33 (in Chinese with English abstract).
Du, B. L., 1993. The preliminary vulnerability assessment of the Chinese coastal zone due of sea level rise., 10 (4): 1-8 (in Chinese).
Du, B. L., Tian, S. Z., and Yu, J., 1995. Impacts of sea level rise on Pearl River Delta and response strategies., 12 (4): 1-8 (in Chinese).
Du, B. L., Tian, S. Z., Shen, W. Z., Gui, Z. Q., Jiang, J. T., and Wang, D. H., 1997.. China Ocean Press, Beijing, 47-49 (in Chinese).
Gumbel, E. J., 1941. The return period of flood flows., 12: 163-190.
Guo, H. R., Jiao, H. W., and Yang, Y. X., 2004. The systematic difference and its distribution between the 1985 National Height Datum and global quasigeoid., 33 (2): 100-104 (in Chinese with English abstract).
Han, M. K., Mimura, N., Hosokawa, Y., Machida, S., Yamada, K., Wu, L., and Li, J., 1994. Vulnerability assessment of coastal plain west of Bohai Sea, north China, to sea level rise., 49 (2): 107-116 (in Chinese).
Huang, L. R., Yang, G. H., and Hu, H. M., 1991. Isostatic datum of sea level change in China’s coastal area., 13 (1): 1-7 (in Chinese).
IPCC, 2001. Climate Change 2001: The Scientific Basis. Contribution of Working Group I to the Third Assessment Report of the Intergovernmental Panel on Climate Change. Houghton, J. T., eds., Cambridge University Press, Cambridge, United Kingdom and New York, NY, 881.
IPCC, 2007. Climate Change 2007: The Physical Science Basis. Contribution of Working Group I to the Fourth Assessment Report of the Intergovernmental Panel on Climate Change. Solomon, S.,, eds., Cambridge University Press, Cambridge, United Kingdom and New York, NY, 996.
Ji, Z. X., Jiang, Z. X., Zhu, J. W., and Yang, G. H., 1994. Impacts of sea level rise on tidal flat and coastal wetland in the Changjiang River Delta and its adjacent area., 25 (6): 582-590 (in Chinese).
Li, J. L., Wang, Y. H., Zhang, R. S., Ge, Y. J., Qi, D. L., and Zhang, D. F., 2006. Disaster effects of sea level rise–A case of Jiangsu coastal lowland., 26 (1): 87-93 (in Chinese with English abstract).
Mitrovica, J. X., Tamisiea, M. E., Davis, J. L., and Milne, G. A., 2001. Recent mass balance of polar ice sheets inferred from patterns of global sea-level change., 409: 1026-1029.
Ren, M., 1996. The present status and solution of the development and utilization of tidal flat in China., 6: 440-443 (in Chinese).
Yan, M., 2008. The study of termodynamic mechanism of global sea level variation. PhD thesis, Ocean University of China (in Chinese).
Yang, H. T., 1998. Sustainable development and reduction oceanic disasters in the coast of China., 15 (3): 12-20 (in Chinese).
Yu, Y. F., 2004. Advance of the researches of on the variations of mean-sea-level in the coastal waters of China., 34 (2): 713-719 (in Chinese with English abstract).
(Edited by Xie Jun)
10.1007/s11802-013-1908-3
ISSN 1672-5182, 2013 12 (3): 327-334
. Tel: 0086-10-62105543 E-mail: zjyangyiqiu@163.com
(November 9, 2011; revised March 12, 2012; accepted December 12, 2012)
© Ocean University of China, Science Press and Springer-Verlag Berlin Heidelberg 2013
 Journal of Ocean University of China2013年3期
- Journal of Ocean University of China的其它文章
- Evaluation of Antitumor, Immunomodulatory and Free Radical Scavenging Effects of A New Herbal Prescription Seaweed Complex Preparation
- Shallow Water Body Data Processing Based on the Seismic Oceanography
- A Homogeneous Linear Estimation Method for System Error in Data Assimilation
- The Suspended Sediment Concentration Distribution in the Bohai Sea, Yellow Sea and East China Sea
- Role of Ekman Transport Versus Ekman Pumping in Driving Summer Upwelling in the South China Sea
- Macrobenthic Community in the Xiaoqing River Estuary in Laizhou Bay, China
