
Quantitative comparison of semi- and fully-distributed hydrologic models in simulating flood hydrographs on a mountain watershed in southwest China*
2013-06-01 12:29ZHANGHuilan张会兰
水动力学研究与进展 B辑 2013年6期
ZHANG Hui-lan (张会兰)
Key Laboratory of Soil and Water Conservation and Desertification Combating, Ministry of Education, Department of Soil and Water Conservation, Beijing Forestry University, Beijing, 100083, China
State Key Laboratory of Hydroscience and Engineering, Tsinghua University, Beijing 100084, China,
E-mail: hyestlan@gmail.com
WANG Yu-jie (王玉杰), WANG Yun-qi (王云琦)
Key Laboratory of Soil and Water Conservation and Desertification Combating, Ministry of Education, School of Soil and Water Conservation, Beijing Forestry University, Beijing, 100083, China
LI Dan-xun (李丹勋), WANG Xing-kui (王兴奎)
State Key Laboratory of Hydroscience and Engineering, Tsinghua University, Beijing 100084, China
Quantitative comparison of semi- and fully-distributed hydrologic models in simulating flood hydrographs on a mountain watershed in southwest China*
ZHANG Hui-lan (张会兰)
Key Laboratory of Soil and Water Conservation and Desertification Combating, Ministry of Education, Department of Soil and Water Conservation, Beijing Forestry University, Beijing, 100083, China
State Key Laboratory of Hydroscience and Engineering, Tsinghua University, Beijing 100084, China,
E-mail: hyestlan@gmail.com
WANG Yu-jie (王玉杰), WANG Yun-qi (王云琦)
Key Laboratory of Soil and Water Conservation and Desertification Combating, Ministry of Education, School of Soil and Water Conservation, Beijing Forestry University, Beijing, 100083, China
LI Dan-xun (李丹勋), WANG Xing-kui (王兴奎)
State Key Laboratory of Hydroscience and Engineering, Tsinghua University, Beijing 100084, China
(Received November 26, 2012, Revised July 29, 2013)
To investigate the performance of fully- and semi-distributed hydrologic models in simulating the process of transformation from rainfall to runoff in mountain areas, the fully-distributed models Basin Pollution Calculation Center (BPCC) and HECHMS are calibrated for the Zhenjiangguan watershed located in the upper stream of Minjiang River Southwest China using streamflow observations at the basin outlet. Semi-automatical optimization method is implemented to both models to improve simulated results by removing artificial errors. Based on the consistency of the simulated hydrographs with the observed ones, the statistical coefficients such as the relative error, the probability distribution and the correlation coefficient, are further introduced to evaluate quantitatively the performance of the two models. Analyses indicate that the hydrographs simulated by the BPCC are relatively closer to the observed ones than those simulated by the HEC-HMS in view of the spatial heterogeneity in terrain, soil texture, land cover and meteorological conditions in mountain areas.
Basin Pollution Calculation Center (BPCC), HEC-HMS, hydrologic modeling, mountain area, semi-automatically optimization
Introduction
An increasing demand for accurate hydrologic modeling and analysis to interpret, quantify and assess the complex processes such as the storm discharge from precipitation and its interactions with environment[1], has stimulated interests in semi- and fullydistributed hydrologic models[2]. In the operational hydrology, an accurate estimation of the hydrologic process is essential for making decisions, managing water quality and resources, and watershed planning because of the complexity of the operational hydrologic and hydraulic processes[3]caused by flash flood, agricultural activities and deforestation, and the manmade structures.
Note that the variability of the spatial input information and the basin properties has significant impacts on the hydrologic responses of watersheds[4], and the physically-based distributed models are capable of accommodating the spatial distribution of meteorological conditions (especially precipitation) and physical parameters (e.g., soil saturation and land cover roughness, etc.) typically through a basic calculated unit in which hydrologic processes are mathematically interpreted in that unit. On the other hand, the semi-distributed conceptual models usually simulate the total discharges using the basin or sub-basin averaged inputdata, where the distributed properties such as the land cover, the soil type and the precipitation are lumped into discrete points, thus failing to accurately represent the watershed conditions. However, the potential of over-parameterization accompanied with abundant distributed information and the limit amount of calibration data may lead to incompetent resolutions[5]. Thus, one can not say definitely that the fully-distributed model performs better than a semi-distributed model in simulating hydrologic processes, especially with the emphatic consideration of different topographies. Reed et al.[6]reported that a lumped model outperformed some distributed models in more cases than the distributed models outperformed the lumped model, while Carpenter and Georgakakos[7]stated that the fully distributed models had a great advantage for improving the hydrologic forecasting. Nevertheless, El-NASR et al.[2]revealed that both of the semi-distributed SWAT model and the fully-distributed MIKE SHE model simulated the hydrology of the catchment in an acceptable way, which confirmed the conclusion of Refsgaard and Knudsen[8]that all models (NAM lumped conceptual modeling system, MIKE SHE distributed physically based system and the intermediate WATBAL approach) performed equally well after a model calibration.
In this study, we compare the performance of two hydrologic rainfall-runoff models, i.e., the fully-distributed model Basin Pollution Calculated Center (BPCC) and the semi-distributed HEC-HMS (Hydrologic Modeling System) model, in simulating flood hydrographs on a mountain watershed in southwest China, the Zhenjiangguan watershed located in the upstream of Minjiang River. The BPCC was developed by the Research Institute of River Mechanics, Tsinghua University. The GIS-based model assimilates the advanced technology of GIS and NEXRAD, and was successfully used for various rainfall-runoff events with good simulating accuracy[9-11]. The BPCC uses the TOPAZ to discrete the Digital Elevation Model (DEM) and underlying conditions into slopeconceptual calculated units, with separately assigned input information for each unit. Meanwhile, the HECHMS is a physically based model developed by the US Army Corps of Engineers and widely used in many regions[12]. The HMS model uses the underlying DEM information to partition the basin into several sub-watersheds, where the hydrometeorological inputs and basin information are lumped into discrete points. Considering that the model calibration may significantly affect the model accuracy[13], a semi-automatic calibration method is applied in this study to alleviate the uncertainty caused by manual manipulations.
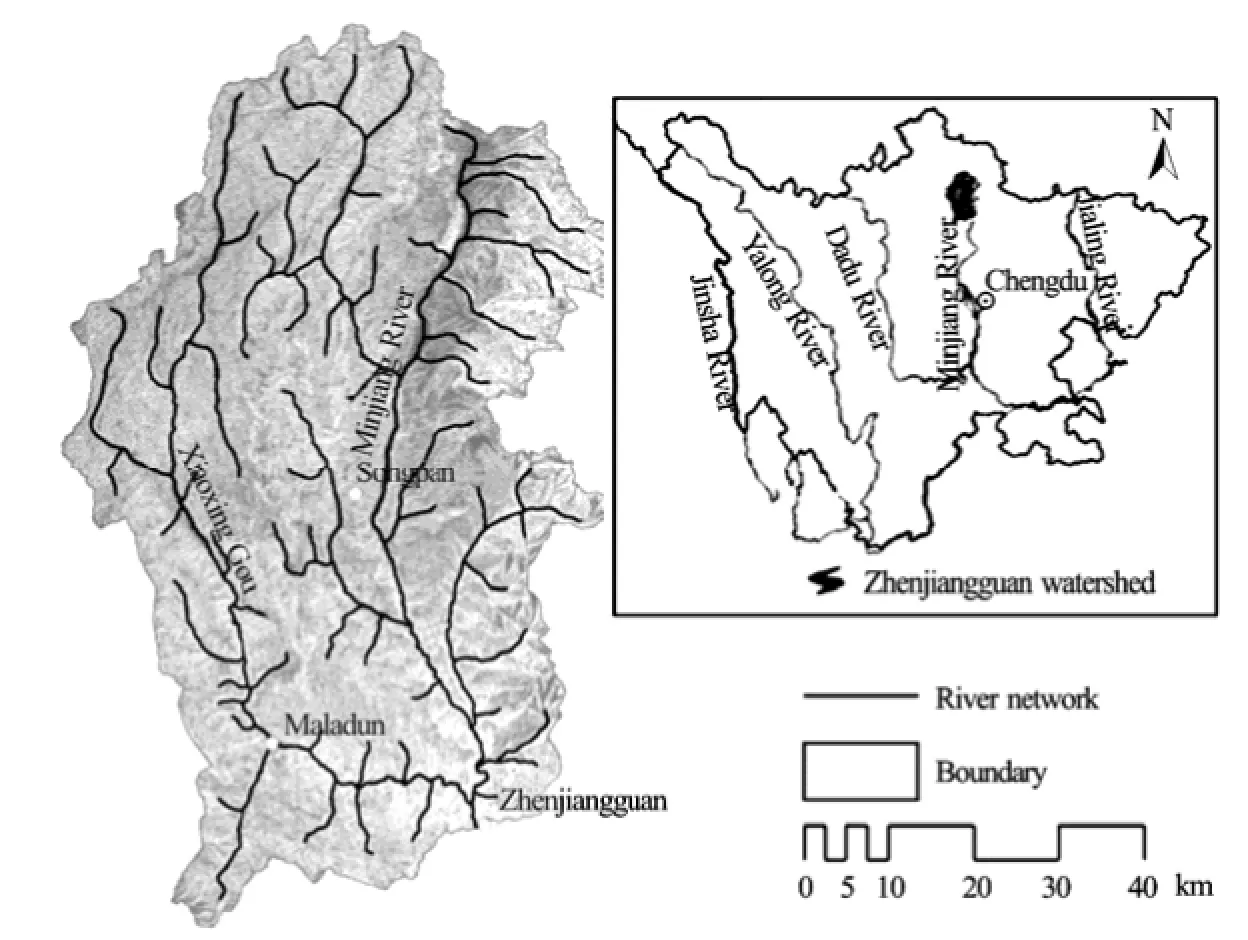
Fig.1 Location and boundary of the Zhenjiangguan watershed, Minjiang River. Also shown are the dendritic river network and the gauge stations within this watershed
1. Materials
Zhenjiangguan watershed, with an area of
4 486 km2, is located in the upper stream of Minjiang River, north-eastern Tibet Plateau and the main part of West Sichuan Plateau (Fig.1). The average annual precipitation over the watershed is 0.57 m and 80 percent of the total rain events occur during the flood season from May to October. The average annual discharge at Zhengjiangguan station is 55.0 m3/s with the maximum and minimum discharges of 410.0 m3/s and 9.2 m3/s, respectively. Elevation changes are mild andrange from 2 445 m at the outlet to 5 360 m at the highest point of the watershed.
The watershed is gauged at its outlet node, allowing for the model calibration and the validation. In the BPCC, the hourly rainfall and the temperature inputs calculated by the temporal interpolation method[14]based on the daily measurements of three different gauge stations are used, while the inverse distance weighted interpolation method provided in the HEC-HMS is chosen for each sub-basin, where all rainfall values are the same. In this way, the precipitation inputs in the BPCC are smoothly distributed for all calculated units but they are lumped into discrete points for each sub-basin in the HEC-HMS. This may be the primary cause of the variability of modeling results.
The land surface is approximately covered by 64.1% of herbaceous land, 18.5% of forest, 14.9% of shrub, and 2.5% of agricultural land, while the dominant soil type is Sand Clay Loam (SCL) accounting for almost 43.6% of the total soil types. Additionally, the soil within this area is very thin (41 cm-60 cm in thickness) leading to a marked tendency of water and soil loss. Similarly as the meteorological inputs, the primary information of the land cover and the soil type, the interaction between the precipitation and the land surface, is spatially interpolated to a distribution and to semi-lumped discrete values in the BPCC and the HEC-HMS, respectively. Data resources and basic information are shown in Table 1.
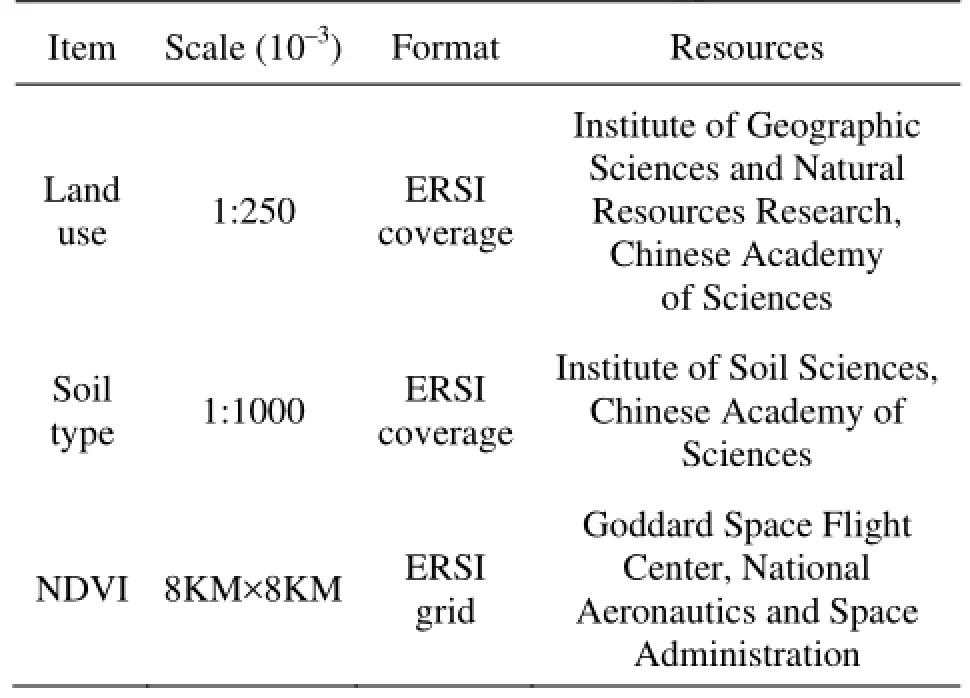
Table 1 Attributes of land cover and soil type
2. Methodology
2.1Theory
2.1.1 The BPCC model
The model of the BPCC[14], developed by the Research Institute of River Mechanics, Tsinghua University, is a DEM-based fully-distributed hydrologic model. Coupled with the sedimentation and pollution modules, the BPCC is capable of interpreting the whole process of the rainfall-runoff-pollute transport. The BPCC model uses the TOPAZ to discrete the topographical, meteorological and underlying surface conditions (i.e., the land cover and the soil type), into basic calculated slope-level units, where the process of the rainfall-runoff-pollutant erosion is mathematically described. The “+1” river network graded method[9]is employed in the BPCC model as discrete river channels for the flow routing simulation. Generally, the hydrologic mechanism can be mathematically interpreted by two successive parts: the runoff produced at the slope unit and the discharge conveying. The methods used in the BPCC can be described as follows:
The vegetation interception and the evapotranspiration are two main resources of the precipitation loss, and are calculated by Sellers’s equation and Penman Equation, respectively

wherevIandcKare the interception capacity and the coefficient of the vegetation canopy, respectively,dcreflects the spatial distribution of the land cover, andLAI(t) is the leaf area index at timetwhich is a function of the Normalized Difference Vegetation Index (NDVI).
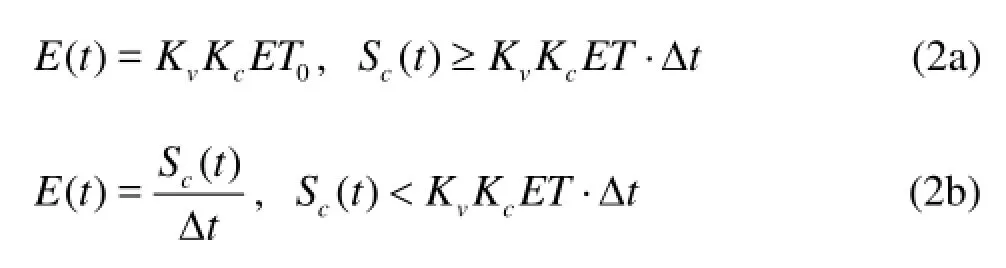
whereKvandKcare the rate of the coverage and the crop coefficient, andET0is the potential evaporation rate, andSc(t) is the accumulated surface water depth.
Within each calculated unit at the hillslope level, 1D dynamic model is used[14]
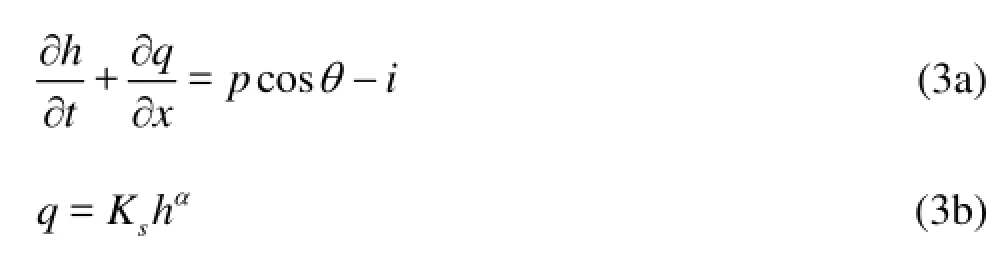
wherexis directed downward along the hillslope,his the water depth,qis the unit discharge,pis the precipitation intensity,iis the infiltration rate,Ks=S0.5/nwith the slopes=sinφ(φis the angle of
0s0the slope), andsnis the Manning roughness coefficient.αtakes the value of 5/3 in this study.
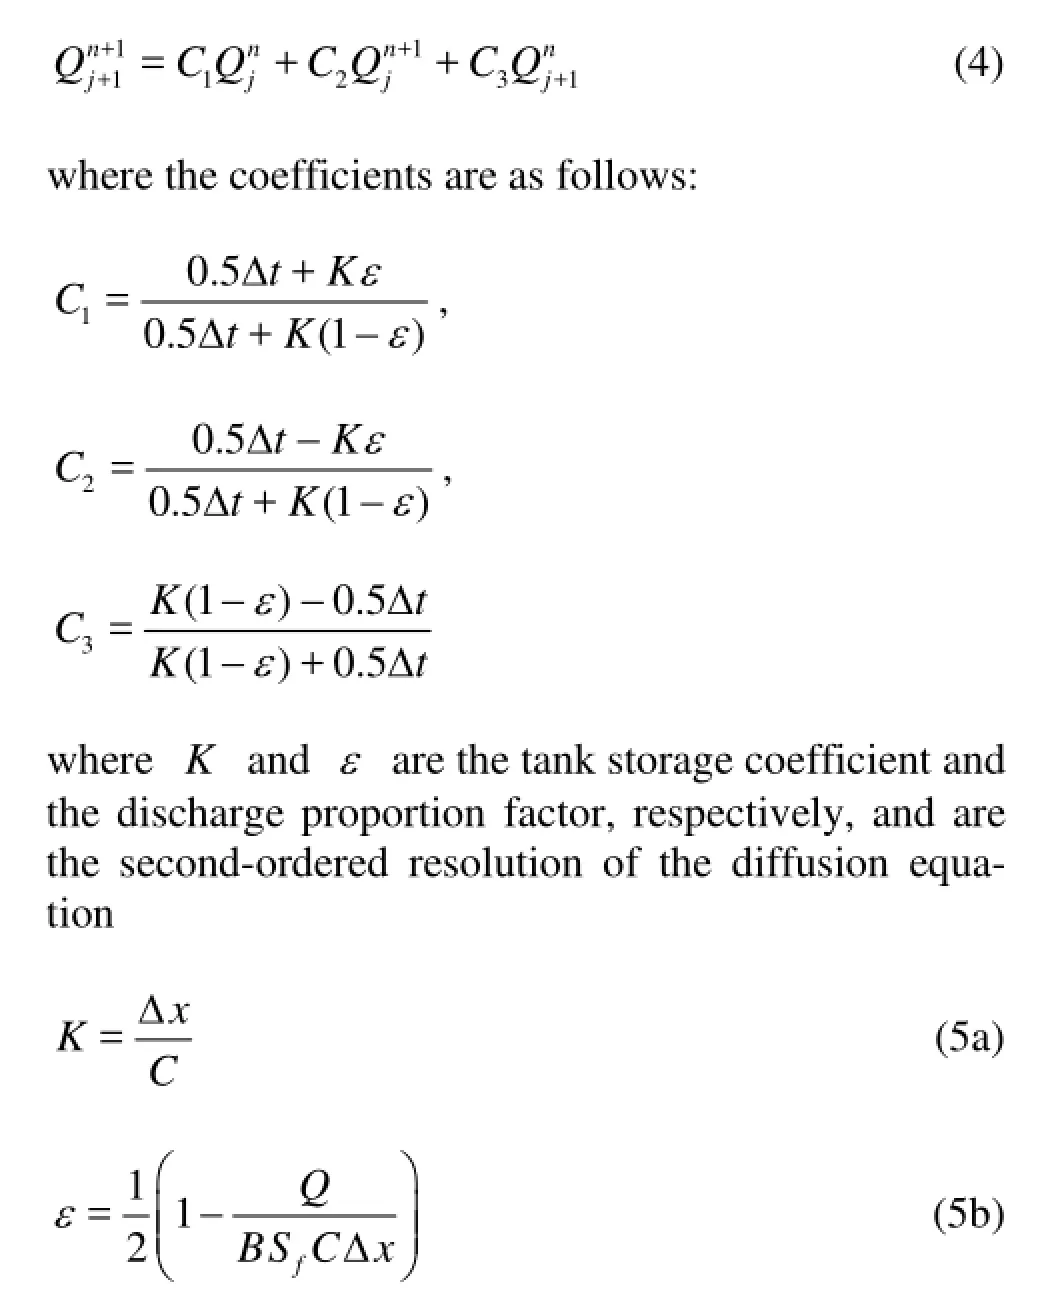
The commonly used Muskingum-Cunge routing method is applied in the BPCC model and is solved by a simple finite difference approximation method
2.1.2 The HEC-HMS model
Developed by the U.S. Army Corps of Engineers, the Hydrologic Engineering Center-Hydrologic Modeling system (Version 3.4) is a physically based, semidistributed model designed to simulate the precipitation-runoff process with the choice of numerous slope- and channel-leveled parameters. The HECHMS at its early stage is released to estimate the infiltration capacity for each soil type depending on the Curve Number (CN number), a parameter derived from the Soil Conservation Service (SCS) and based on the land use and the soil type (hydrologic soil group)[3]. Routing methods for river channels are used to simulate the transportation of the water body. The implementation starts from the partition of the underlying DEM information, and each sub-watershed, for which the hydrologic process and the model parameters are calculated in a lumped way, is linked by the river channels and the river water is transported down to the outlet of the whole basin. The methods used are described as follows:
The hydrologic mechanism described by the direct runoff on the hillslope is first given by the SCS loss model
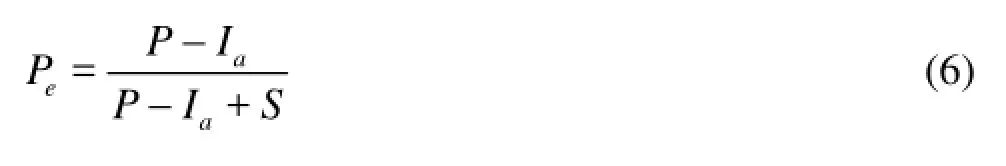
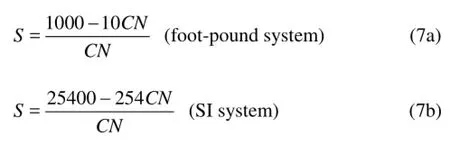
whereePis the excess precipitation,Pis the accumulated precipitation, andaIis the initial abstraction (loss) and can be empirically initialized as 0.2S.Sis the potential maximum retention and is related to the CN number as[15]
Then, the process, referred to as the transformation of the precipitation to the direct runoff, is simulated by the direct runoff modeling, i.e., the empirical models such as the traditional unit hydrograph and the conceptual models such as the kinematic wave model. The model selected in this study is the SCS Unit Hydrograph (UH) approach.
For the baseflow, the exponential recession model is chosen,Q=Qkt, whereQis the initial
t00baseflow andkis an exponential decay constant.
With five options of the river channel routing methods, the Muskingum routing method is chosen to keep correspondence with that of the BPCC model, thus emphasizing the calculation differences from the slope/sub-basin runoff producing instead of the river routings.
2.2Strategy of optimization
The HEC-HMS 3.4 provides 7 objective functions for the automated parameter estimation. These include the Sum Squared Residuals (SSR), which emphasizes the water balance, the Peak Error (PE), the Mass Balance Error (MBE), the Nash-Sutcliffe Efficiency Coefficient (ENS), and the Relation Coefficient (R2)[15]. In this study, the objective function is formulated as a non-dimensional function based on the SSR measurement emphasizing the water balance. The function is described as follows
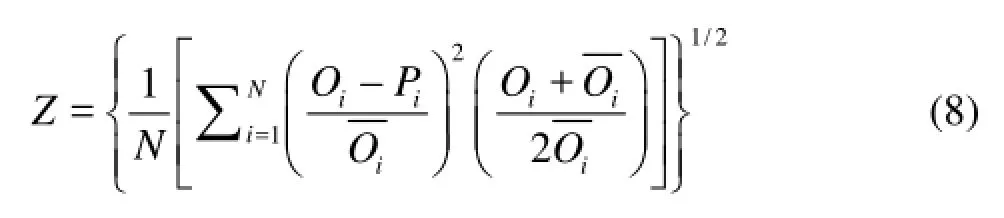
whereQiandPiare the observed and the predicted discharges at timei, respectively, andQiis the averaged observed discharge.
An algorithm of the univariate-gradient based the Newton iteration is employed in both models to achieve the optimized data set of the calibrated parameters. The optimization process is actually semi-automatically converged since the upper and lower bounds for the parameter initial values are firstly estimated by running the simulation manually. In this way, the optimal values of the model parameters can be obtainedsuccessfully in a way of the mathematical calculation instead of an experience-dependent try-out. Meanwhile, the calculation time can also be saved.
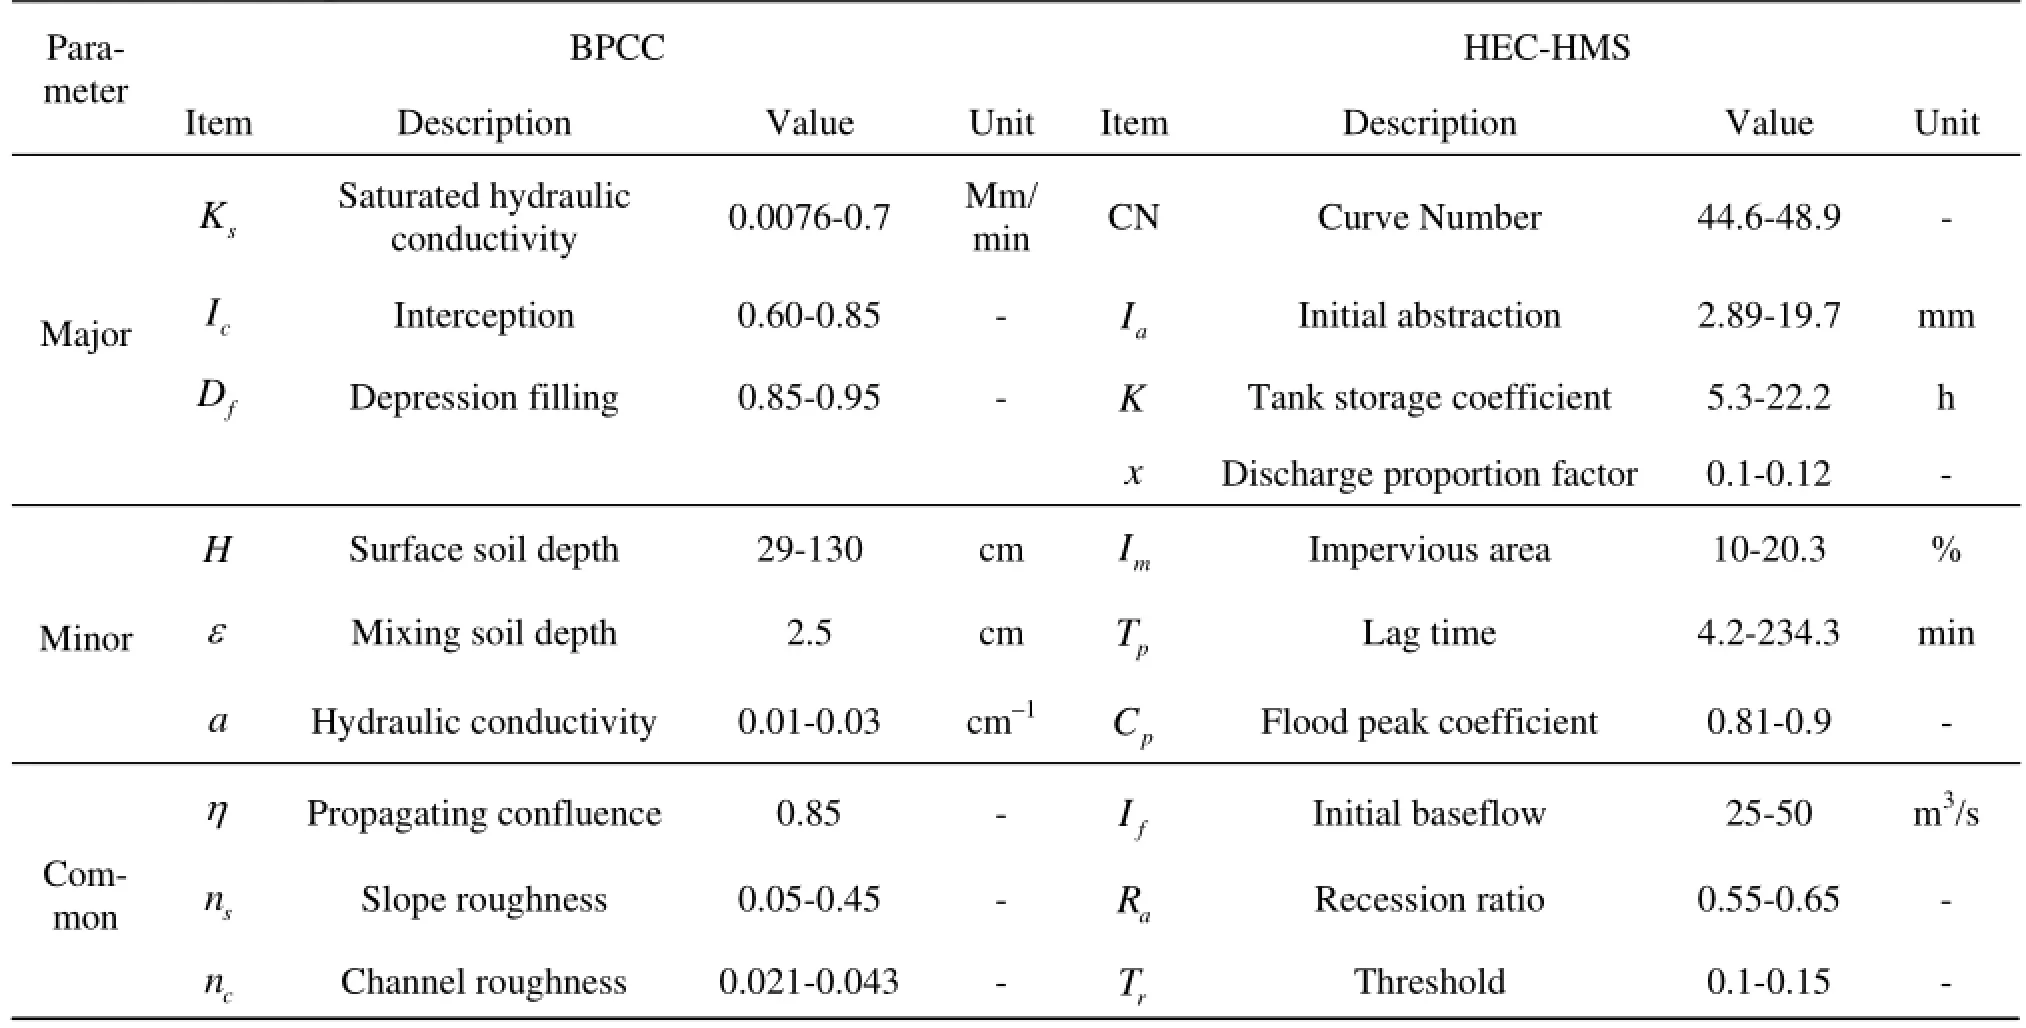
Table 2 Calibrated parameters in BPCC and HEC-HMS[14]
2.3Criteria for performance indices
For the model calibration and validation, and the model inter-comparison, the quantitative information is required to measure the model performance as compared to the field measurements. In this study, the river discharge data at the outlet of the watershed are used to evaluate the accuracy of the predictions by each model. Two parameters, namely the Nash-Sutcliffe efficiency coefficientnsEand the relation coefficientr2from a previous study[16]are the indices chosen for the model calibration and verification.Ensranges between -∞ and 1.0 and the value of 1.0 indicates that the simulated hydrograph perfectly matches the observed one, whiler2can be seen to be related to the unexplained variance.
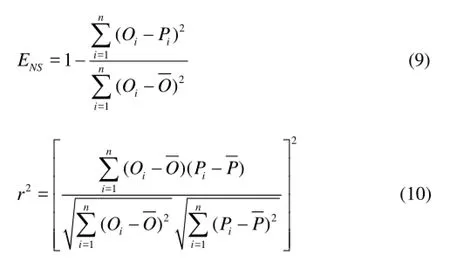
wherePis the averaged observed discharge.
Meanwhile, the performance assessment is based on a systematic statistical analysis, which is described as follows: (1) The dominant characteristics of the surface water processing including the closure of the water balance (i.e. the total evaporation and volume) and the flood peak values are compared, (2) the distribution of the error probability density depicting the mean value and the standard deviation of the model error values has the priority to explain the degree of the discrete features and the model stability, (3) the slope coefficient of the simple regression and the correlation coefficient between the observed measurements and the simulated estimates are used as the correlation indices.
3. Results and discussions
3.1Calibrated and verified results
Floods occurred in the upper Minjiang River during past years of 1993, 1998, 2004 and 2006. The daily measurements from three rain gauges and weather stations are available while the discharges are observed at the outlet of the basin. The hydrometeorological datasets for 1993, 1998 and 2004 were selected for the model calibration. Using the calibrated model parameter values, the datasets of 1998 and 2006 flood events were chosen for the model verification.
In the calibrating process, the initial model parameter values of the BPCC were estimated either from literature[9]or by experience, e.g., the interception coefficient and the depression filling, while a part of critical parameters (e.g., the CN values as a combined function of the landcover, theUSDAsoiltextureclass, and the imperious area) of the HEC-HMS were initialized by physical considerations and technically implemented by the HEC-GeoHMS[17], and the remains were from literature[18]or according to modeler’s experience. The calibration costs for both models are comparable due to the approximately same number of the calibrated model parameters (see Table 2). Successively, both BPCC and HEC-HMS models were automatically optimized with the previously mentioned non-dimensional object function. Both models were used at a time step of 30 and the calculated discharges were aggregated into daily values. Table 2 also gives the suggested value spectrum for simulating hydrographs within Zhenjiangguan watershed. It should be awared that in Table 2 the critical parameter values for the HEC-HMS are the averaged means for each subbasin (total 10 sub-basins in this study) and river channel (total 10). The hydrographs from the field observations and the two models at the outlet are shown in Fig.2 and Fig.3, in which the rainfall values are the basin averaged values. Note that the flood events are sequenced in order of calibration and verification, therefore the number of 1, 2, 3, 4 and 5 labeled in the following figures and tables in this study represent the five flood events of 1993-6-18-1993-7-11, 2004-8-30-2004-9-16, 2006-4-27-2006-5-30, 1998-8-8-1998-9-11 and 2006-9-15-2006-9-18, respectively.
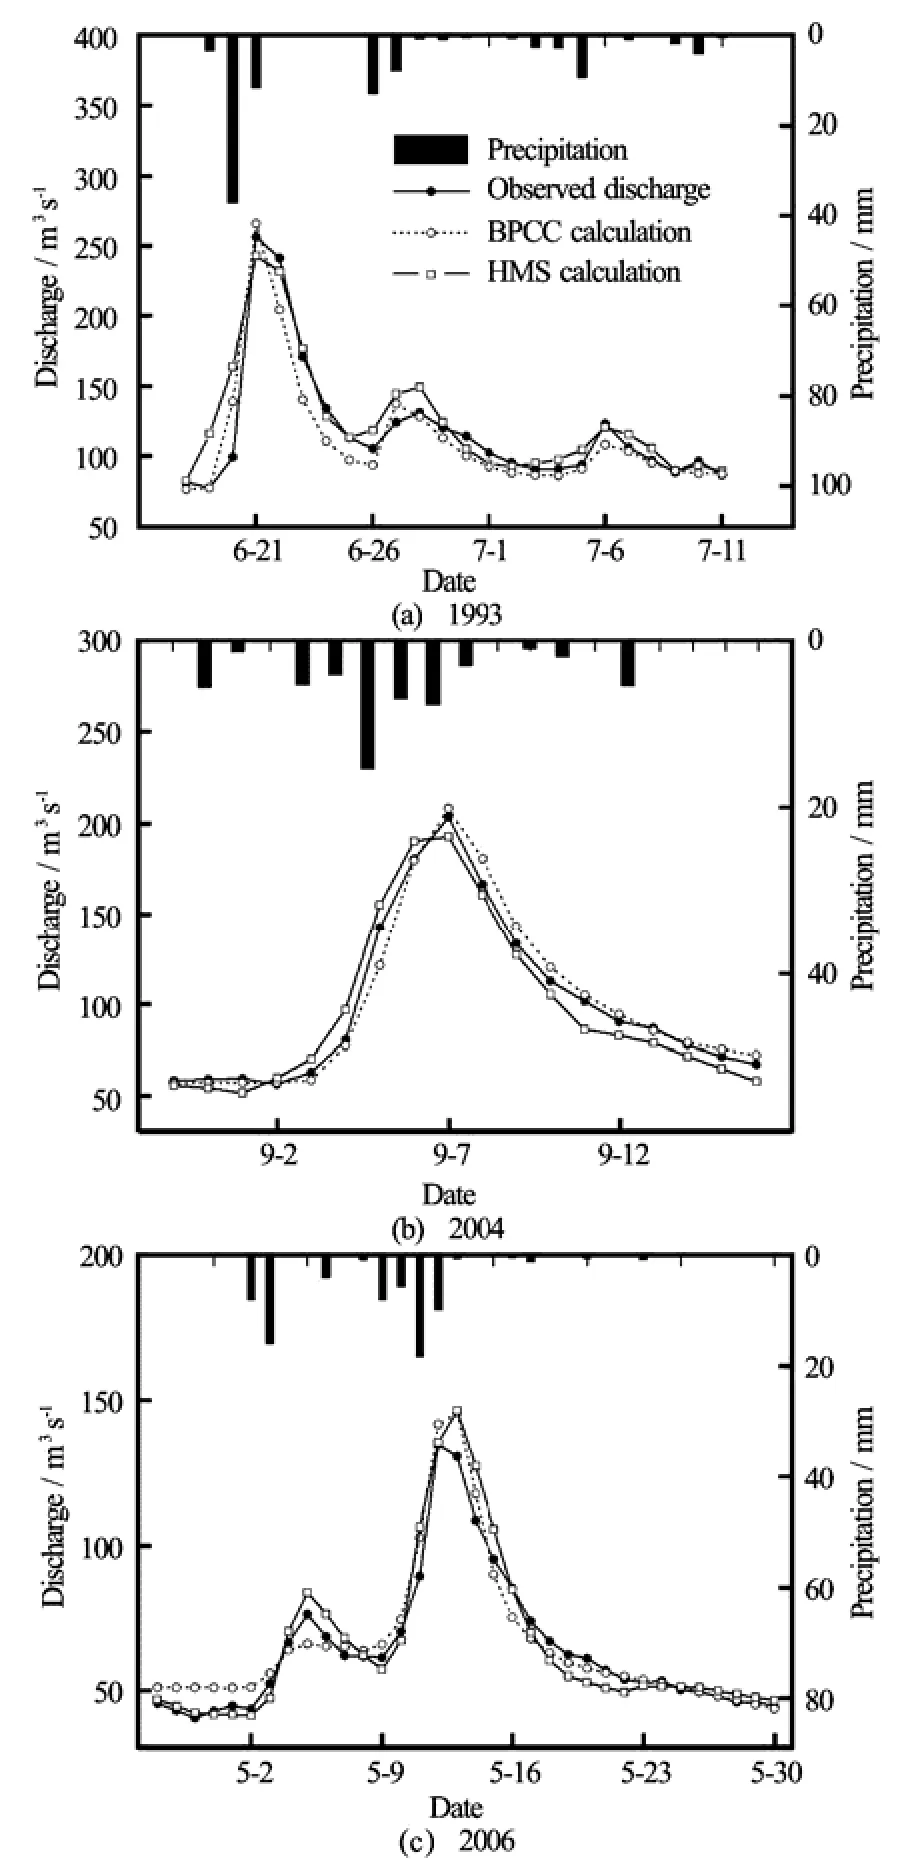
Fig.2 Semi- and Fully-distributed simulations versus observed discharge during calibration periods
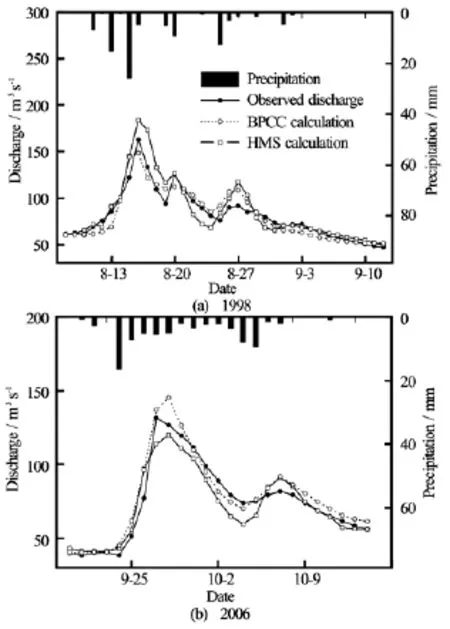
Fig.3 Semi- and fully-distributed simulations versus observed discharge during validation periods
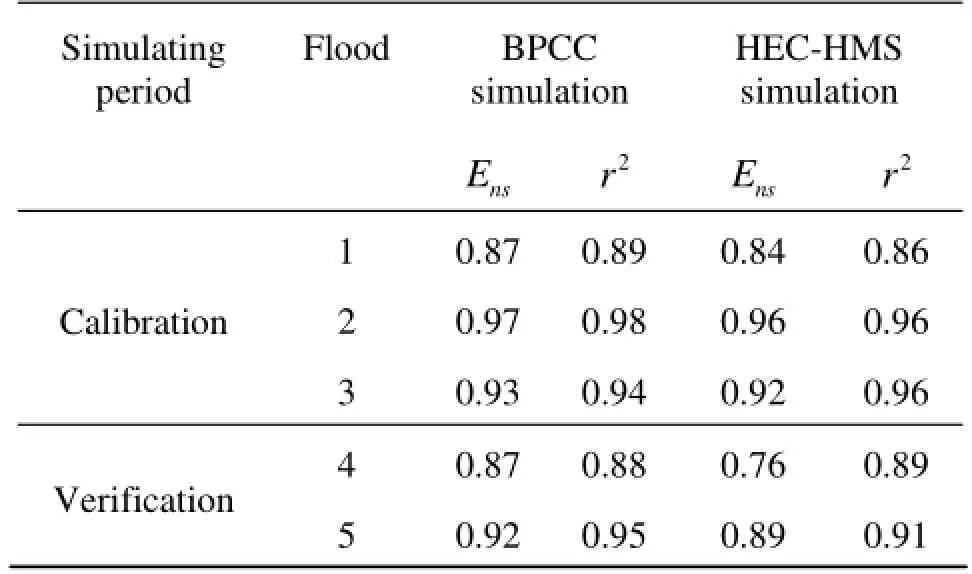
Table 3 Indices of model calibration and verification
Figure 2 shows the comparisons of three representative flood events during the calibration periods, and Fig.3 shows two representative flood events duringthe validation periods. It can be seen from Figs.2 and 3 that both models enjoy a good performance in simulating the watershed response as indicated by the similarity of the patterns of all hydrographs. However, a closer visual inspection of the residuals reveals that both models, although closely following the observations, do occasionally over- or under-estimate the discharge across the entire spectrum of floods. Nevertheless, a slightly better performance of the BPCC simulation can be discovered via the evaluation criteria parameters listed in Table 3.
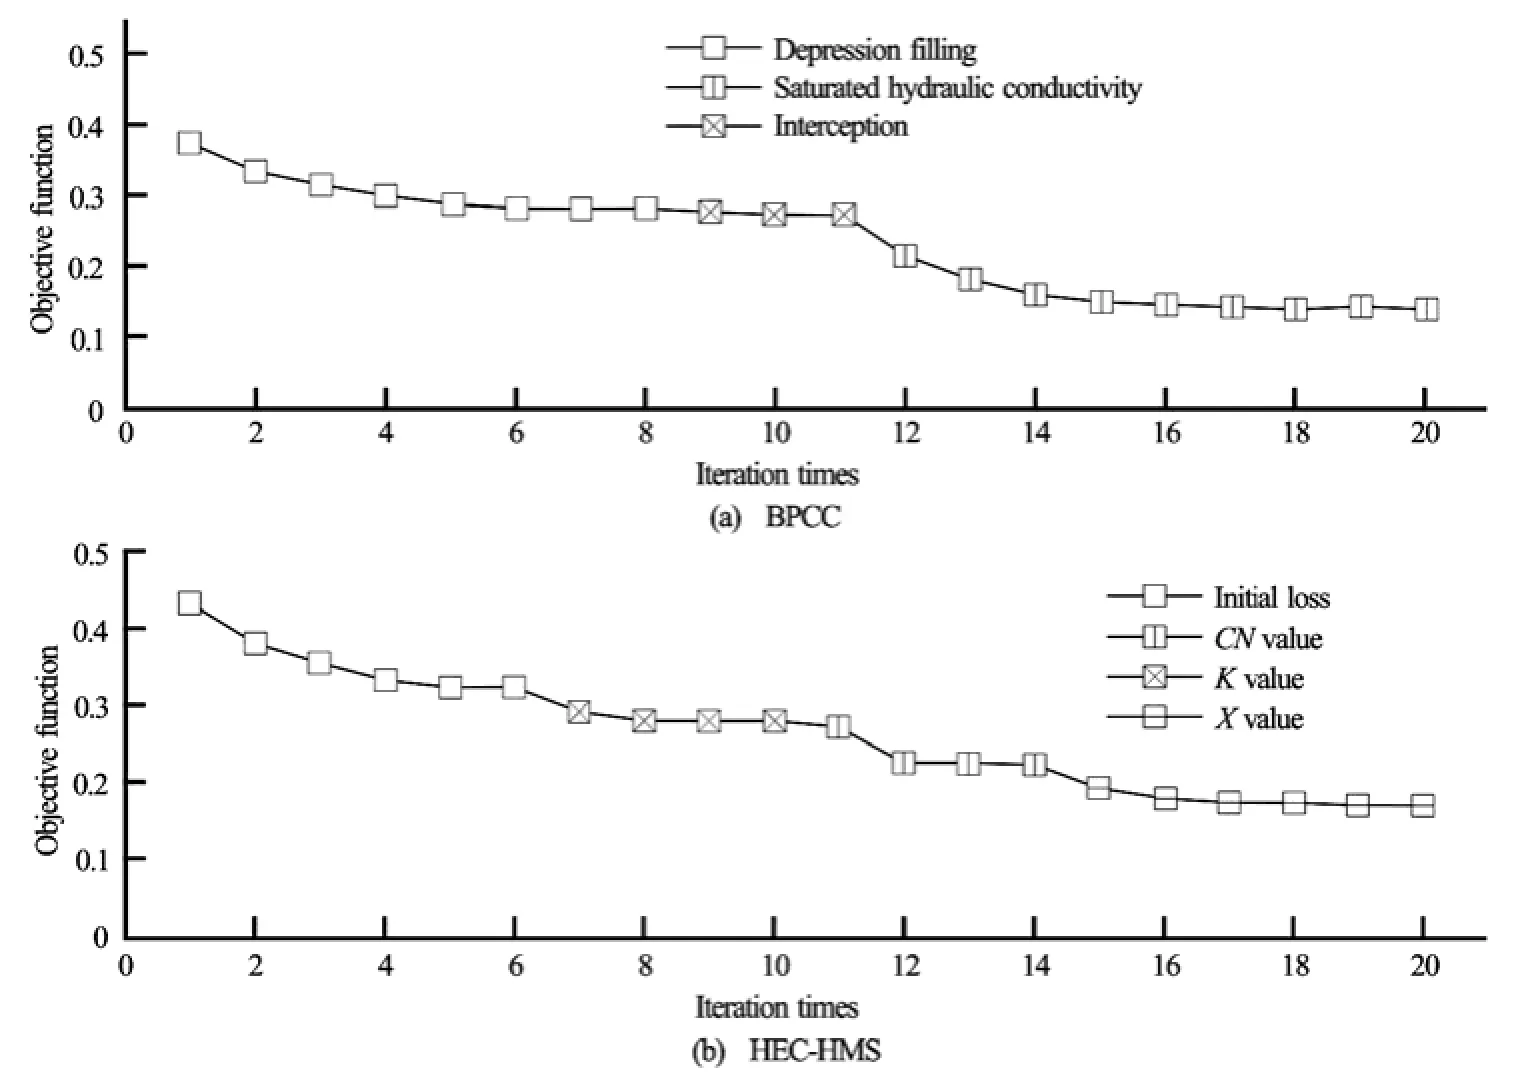
Fig.4 Iteration procedure of objective function with semi-automatic calibration
3.2Optimization processes
With the automatic optimization from the given initial parameter values, Fig.4 demonstrates the convergence processes of the non-dimensional objective functionZ, where flood 2 event (2004-8-30-2004-9-16) is chosen for the demonstration.
As listed in Table 2, only the major parameters for both models are optimized in this study. It can be seen from Fig.4 that the critical parameters are univariate-calibrated, which means that the first calibrated parameter (Depression Filling in the BPCC and the Initial Loss in the HEC-HMS) is tried and modified while the remains take the initial assigned values. When the objective functionZslightly changes, the first parameter is determined and fixed, and the remains are successively optimized until all parameters are determined when the iteration procedure ends and the model is optimized.
3.3Quantitative comparison
To assess the performance of both models with respect to their capacity to simulate the water balance components, the maximum values of the discharge, and the runoff depth over all study area, the total amount of precipitation, the evaporation, the flood peak values and the runoff depth for the five flood events are chosen and listed in Table 4.
It can be estimated from the values of the evaporation and the precipitation in Table 4 that the proportion of the calculated evaporation to the total rainfall ranges from 10% to 20% during the rainfall-flood events in the flood season, and it is noted that the evaporation estimations from the HEC-HMS are relatively higher than that of the BPCC. With respect to the flood peaks, the majority of relative flood peak errors do not exceed 10%±, and the spectrum goes occasionally beyond for both BPCC and HEC-HMS by 10.4% and 12.9%, respectively. As indicators of the water balance control, the runoff depths are well simulated by the BPCC that the relative error for flood events 2, 3 and 4 are within 1%. As a comparison, the relative runoff errors simulated by the HEC-HMS range between 2%-5%. Therefore, it can be concluded that the BPCC gives better estimation of the runoff depths than the HEC-HMS in the montane Zhenjiangguan watershed.
The performance of both models with respect to the simulated river discharge is further examinedusing the statistical criteria, with respect to the calculated discharge errors for 137 samples from both calibration and verification. Figure 5 shows the frequency distribution of the probability density of the calculated errors for both models, where the abscissa and the ordinate represent the difference values between simulation and observation, and error density, respectively.
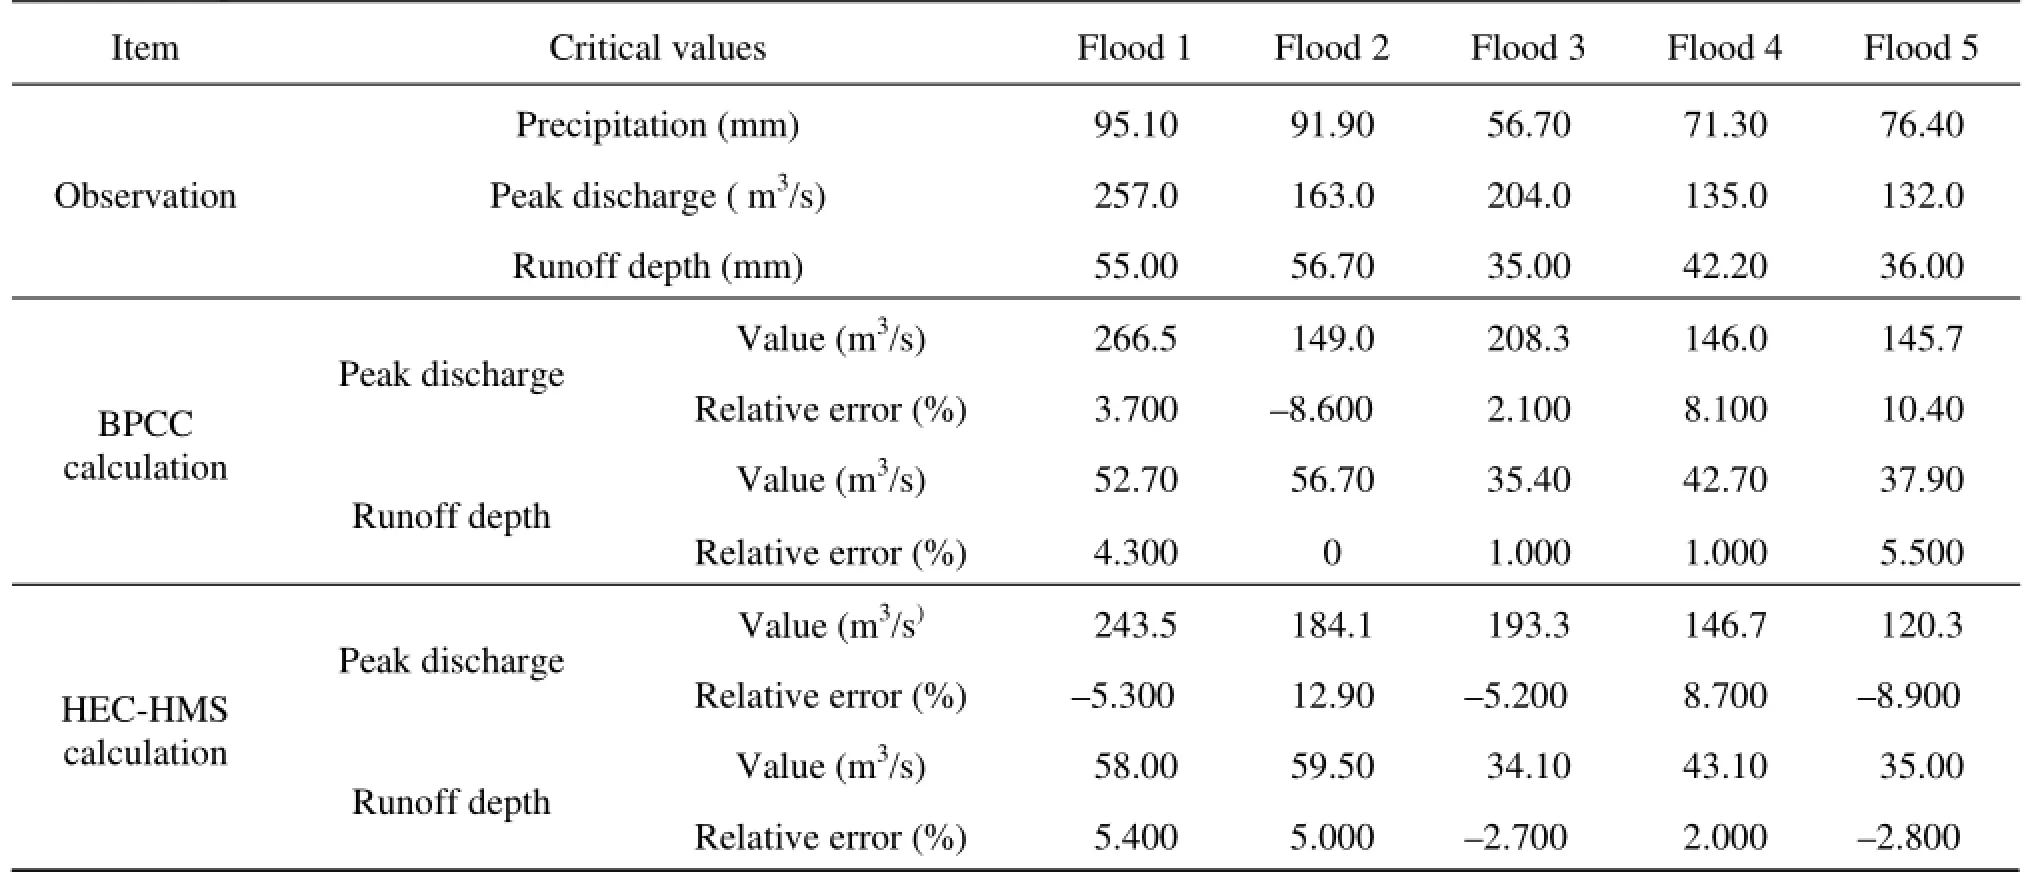
Table 4 Comparisons of characteristic values of BPCC and HEC-HMS simulations with observations
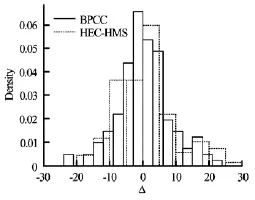
Fig.5 Probability density distribution of calculated errors
It can be seen from Fig.5 that the calculated error values are intensively distributed around zero, but extend to a large distribution spectrum aggravating the statistical analysis of the model performance. Herein, the mean and the standard deviation of the above two differential sequences are calculated for the quantitative evaluation. The results show that the means of the simulation errors from the BPCC and the HEC-HMS are 0.2 and 1.8, respectively, indicating that the simulation errors from the HEC-HMS are systematically greater than those from the BPCC, meanwhile, the standard deviations from the BPCC and the HEC-HMS are 9 and 11, respectively, demonstrating that the BPCC model is stable and robust in simulating the discharge within the mountain area than the HECHMS.
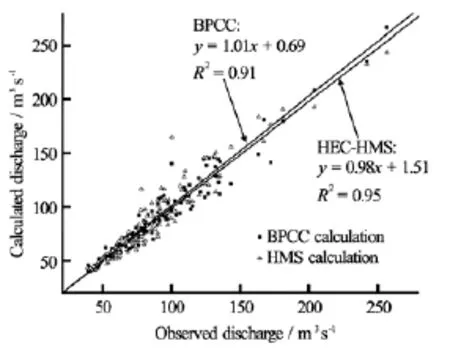
Fig.6 Comparison between BPCC and EC-HMS simulations and observed discharge
Based on the comparison of the characteristic values and the statistical analysis of the calculation errors, the correlation between the model estimation and the field observation are analyzed, which is regarded as the final criteria for the model performance evaluation. In Fig.6, the calculated discharges from both models and field observations are shown.
4. Conclusions
The hydrographs simulated by the physically semi-distributed HEC-HMS model and the fully-distributed BPCC model are compared with the observed hydrographs for five flood events over Zhenjiangguan watershed in the upstream of Minjiang River.
The strategy of the semi-automatic optimization in this study is applied to the situations when quick and simple hydrologic processes are to be performed. It is noteworthy that both models were built by inco-rporating the non-dimensional objection function, which alleviates the shortcomings of the experiencedependency and the time-consuming. Besides the visual observation of hydrographs and the comparison of the selected accuracy parametersnsEand2r, a set of criteria is set up for the model performance assessment. Based on the satisfactory reproduction of five rainfall-runoff flood events during the flood seasons, the HEC-HMS and BPCC simulations are systematically compared. The quantitative analyses of the characteristic values (peak value and runoff depth), the statistical assessment of the calculated errors, and the correlation fitting demonstrate that the performance of the BPCC in simulating and matching the observed hydrographs are slightly better than that of the HECHMS for Zhenjiangguan mountain watershed. The spatial heterogeneity is assumed in terrain, soil texture, land cover and meteorological condition in mountain area.
It can never be ignored that the calibrated parameters are classified according to the magnitude of importance to the model calibration, i.e., those assigned as major, minor and common (as listed in Table 2), which would lead to the guidance of the parameter assignment for similar topography and land cover, as well as comparable hydrometeorology conditions.
[1] KALIN L., HANTUSH H. M. Comparative assessment of two distributed watershed models with application to a small watershed[J].Hydrological Processes,2006, 20(11): 2285-2307.
[2] El-NASR A. A., ARNOLD J. G. and FEYEN J. et al. Modeling the hydrology of a catchment using a distributed and a semi-distributed model[J].Hydrological processes,2005, 19(3): 573-587.
[3] El HASSAN A. A., SHARIF H. O. and TERRANCE J. et al. Performance of a conceptual and physically based model in simulating the response of a semi-urbanized watershed in San Antonio, Texas[J].Hydrological Processes,2013, 27(24): 3394-3408.
[4] BEHNAZ K., BISHER I. and, KUOLIN H. et al. From lumped to distributed via semi-distributed: calibration strategies for semi-distributed hydrologic models[J].Journal of Hydrology,2012, 418-419: 61-67.
[5] BEVEN K., BINLEY A. The future of distributed models: Model calibration and uncertainty prediction[J].Hydrological processes,1992, 6(3): 279-298.
[6] REED S., KOREN V. and SMITH M. et al. Overall distributed model intercomparison project results[J].Journal of Hydrology,2004, 298(1-4): 27-60.
[7] CARPENTER T. M., GEORGAKAKOS K. P. Intercomparison of lumped versus distributed hydrologic model ensemble simulations on operational forecast scales[J].Journal of Hydrology,2006, 329(1-2): 174-185.
[8] REFSGAARD J. C., KNUDSEN J. Operational validation and intercomparison of different types of hydrological models[J].Water Resources Research,1996, 32(7): 2189-2202.
[9] ZHANG Chao. Distributed non-point sources pollution modeling and its application in Xiangxi watershed[D]. Doctoral Thesis, Beijing, China: Tsinghua University, 2008(in Chinese).
[10] ZHANG Hui-lan, LI Dan-xun and WANG Xing-kui. Distributed hydrological and sediment erosion model with its application to Zhenjiangguan watershed in Minjiang River basin[J].Chinese Journal of Hydrodynamics,2011, 26(1): 1-10(in Chinese).
[11] ZHANG Hui-lan, LI Dan-xun and WANG Xing-kui et al. Quantitative evaluation of NEXRAD data and its application in the distributed hydrologic model BPCC[J].Sciences China, Technological Sciences,2012, 55(9): 2617-2624.
[12] KNEBL M., YANG Z. L. and HUTCHISON K. et al. Regional scale flood modeling using NEXRAD rainfall, GIS, and HEC-HMS/RAS: A case study[J].Journal of Environment Manage,2005, 75(4): 325-336.
[13] XIE H., LIAN Y. Uncertainty-based evaluation and comparison of SWAT and HSPF applications to the Illinois River basin[J].Journal of Hydrology,2013, 481: 119-131.
[14] ZHANG Hui-lan. A distributed hydrological model coupled with soil erosion and its application in river basins[D]. Beijing, China: Tsinghua University, 2011(in Chinese).
[15] USACE. Hydrologic modeling system HEC-HMS[R]. Technical Reference Manual. US Army Corps of Engineers, Hydrologic Engineering Center, 2000, 41-104.
[16] KALIN L., HANTUSH M. H. Hydrologic modeling of an eastern pennsylvania watershed with NEXRAD and rain gauge data[J].Journal of Hydrologic Engineering,2006, 11(6): 555-569.
[17] ABUSHANDI E., MERKEL B. Modelling rainfall runoff relations using HEC-HMS and IHACRES for a single rain event in an arid region of jordan[J].Water Resources Management,2013, 27(7): 2391-2409.
[18] CHU X., STEINMAN A. Event and continuous hydrologic modeling with HEC-HMS[J].Journal of Irrigation Drainage Engineering,2009, 135(1): 119-124.
10.1016/S1001-6058(13)60436-9
* Project supported by the Fundamental Research Funds for the Central Universities (Grant No. BLX2012045), the Chinese National “Twelfth Five-Year” Plan for Science and Technology Support (Grant No. 2012BAB04B01).
Biography: ZHANG Hui-lan (1984-), Female, Ph. D., Lecturer
WANG Yu-jie,
E-mail: wyujie@bjfu.edu.cn

- 水动力学研究与进展 B辑的其它文章
- A three-dimensional hydroelasticity theory for ship structures in acoustic field of shallow sea*
- Experimental study of the interaction between the spark-induced cavitation bubble and the air bubble*
- A preliminary study of the turbulence features of the tidal bore in the Qiantang River, China*
- The calculation of mechanical energy loss for incompressible steady pipe flow of homogeneous fluid*
- Experimental study by PIV of swirling flow induced by trapezoid-winglets*
- Analysis of shear rate effects on drag reduction in turbulent channel flow with superhydrophobic wall*