α-Fe2O3表面结构对NH3选择性催化还原NO活性的影响
2012-12-21 06:33杨兴业黄志伟成晓敏张韬伟唐幸福
物理化学学报 2012年1期
杨兴业 李 斌 孙 亮 黄志伟 成晓敏 张韬伟 唐幸福,*
(1中北大学化工与环境学院,太原030051;2复旦大学环境科学与工程系,上海200433)
α-Fe2O3表面结构对NH3选择性催化还原NO活性的影响
杨兴业1,2李 斌1,*孙 亮2黄志伟2成晓敏1张韬伟1唐幸福2,*
(1中北大学化工与环境学院,太原030051;2复旦大学环境科学与工程系,上海200433)
通过水热法合成了两种具有不同形貌的α-Fe2O3纳米棒和纳米立方体,并探索了它们的中温NH3选择性催化还原(NH3-SCR)NO的活性.NH3-SCR测试表明α-Fe2O3纳米棒具有更高的催化活性.X射线粉末衍射(XRD)、场发射扫描电镜(FE-SEM)和高分辨透射电镜(HRTEM)结构分析表明:α-Fe2O3纳米棒暴露有高表面能的{110}活性面,而纳米立方体暴露的主要是低表面能的{012}晶面.H2程序升温还原(H2-TPR)和NO程序升温脱附(NO-TPD)结果证明纳米棒比纳米立方体具有更高的氧化还原性能.因此,α-Fe2O3纳米棒由于暴露高表面能的活性面具有比纳米立方体更高的NH3-SCR性能.
NO;α-Fe2O3;NH3选择性催化还原;表面结构影响
1 Introduction
NO is a major air pollutant that can cause photochemical smog,acid rain,and ozone depletion and may do harm to human health.1The selective catalytic reduction by NH3(NH3-SCR)of NO is one of the most effective and economical methods to remove NO.2-6One of the key problems for NH3-SCR is to develop highly efficient catalysts.Hematite(α-Fe2O3)is an attractive candidate for potential use since it is an high nontox-ic n-type semiconductor and has the most thermal stability among iron oxides.7Liu et al.4prepared an environmental-friendly iron titanate catalyst that showed excellent NH3-SCR activity in the medium range(200-400°C),although in the presense of 10%H2O and 0.01%SO2,NO conversion kept at 100%,even after 48 h sulfation,the catalyst still showed NO conversion above 90%and high N2selectivity.Ma et al.8prepared Fe exchanged zeolite catalyst Fe-ZSM-5 and Carja et al.9synthesized the Fe-Ce-ZSM-5,both catalysts showed good SCR activity in the high temperature range with remarkable H2O and SO2durability.Fe-based catalysts,such as Fe2O3-WO3/ ZrO2prepared by Apostolescu et al.10,exhibited a high SCR activity with selective production of N2and thermal stability. Chen et al.11prepared Fe-Mn mixed-oxide catalysts,this catalytic system had good NH3-SCR properties at low temperatures (80-220°C),and achieved 90.6%conversion of NO with 100%selectivity of N2on an Fe(0.4)-MnOxmixed oxide(molar ratio:n(Fe)/(n(Fe)+n(Mn))=0.4 and calcined at 500°C)at 80°C with a space velocity of 30000 h-1.However,few researchers investigated the face effect of Fe2O3in the NH3-SCR.
As a matter of fact,the catalytic activity depends not only on the chemical composition but also importantly on the exposed crystal faces and surface structure.12It has been revealed that the exposed crystal face plays an important role in adsorption,molecular trafficking,and desorption processes.Hence, catalysts with different well-defined morphologies and reactive crystal faces expectedly result in different chemical properties.13-16For example,we13recently synthesized the Hollandite-type manganese oxide with K+(K-Hol)and β-MnO2. Both catalysts are nanorods with same exposed{110}faces, and the atoms in the{110}faces of K-Hol arrange to form semitunnel structures that are more suitable to adsorb NH3than the smooth surfaces of{110}faces of β-MnO2,which leads to higher catalytic activities of the K-Hol.Choudary et al.14demonstrated that the more the active{100}facets of MgO exposed,the higher the catalytic activity in the NH3-SCR reaction.The{110}faces of spinal structure Co3O4have higher surface energies than the{111}ones,and thus the former exhibited higher catalytic activity toward low-temperature oxidation of CO.15Zhou et al.16synthesized the predominantly exposed {001}and{110}faces of the CeO2nanorods which showed perfect catalytic activity than the exposed stable{111}ones of the CeO2nanoparticles.Therefore,the investigation of surface structure effect of α-Fe2O3on the catalytic activity is of great importance.
In the current work,α-Fe2O3nanocubes and nanorods were synthesized via hydrothermal processes.These samples were characterized by scanning electron microscope(SEM),highresolution transmission electron microscopy(HRTEM),temperatured-programmed reduction by H2(H2-TPR),and temperatured-programmed desorption of NO(NO-TPD).The effect of the crystal faces and surface structures of α-Fe2O3was studied in NH3-SCR of NO.This study proposed the surface structure effect for NH3-SCR and may provide some useful information to investigate the reduction mechanism of NO on the surface of α-Fe2O3.
2 Experimental
2.1 Reagents and synthesis of α-Fe2O3
FeCl3(98.0%)and NaOH(98.5%)were purchased from Acros organics of USA.Hexadecyl trimethyl ammonium bromide(CTAB)(99.0%)was purchased from Sinopharm Chemical Reagent Co.,Ltd.of Shanghai.All chemicals were analytical grade reagents without further purification.The methods used for the synthesis of α-Fe2O3nanocubes and nanorods were similar to the previous reports.17,18Briefly,α-Fe2O3nanocubes(NCs): 8.75 g CTAB was dissolved in 600 mL deionized water to prepare an aqueous solution(0.04 mol·L-1).The solution was stirred for 30 min until it became transparent,and 4.9 g FeCl3was added into the solution.Then,the whole mixture was stirred for 30 min,and it was transferred into Teflon-lined stainless steel autoclaves,sealed,and maintained at 120°C for 14 h.The product was centrifuged,washed several times with deionized water,and dried at 60°C for 12 h.α-Fe2O3nanorods (NRs):4.04 g Fe(NO3)3·9H2O was dissolved in 100 mL deionized water to form a clear solution.Then 2.4 g NaOH dissolved in 20 mL deionized water was added into the Fe(NO3)3· 9H2O solution drop by drop with stirring for 5 min,and then the slurry was transferred into a Teflon-lined stainless steel autoclave with the final pH value higher than 14 and kept at 180°C for 6 h.Finally,both samples were calcined in air at 400°C for 4 h for chemical and physical characterizations and catalytic tests.
2.2 Characterization
X-ray powder diffraction(XRD)patterns were recorded with a D8 advance and davinci design powder diffractometer (Bruker,Germany)operated at 40 kV and 250 mA,using nickelfiltered Cu Kα(λ=0.15418 nm)radiation.
The BET surface areas were measured by N2adsorption at liquid nitrogen temperature using an AUTOSORB-1 instrument(Quantachrome,USA)automated gas sorption system. Prior to the measurements,the samples were degassed in vacuum at 300°C for 2 h.
Morphologies of the samples were investigated by scanning electron microscopy(SEM)(Philips XL30)and field emission scanning electron microscopy(FE-SEM)images were obtained by a Hitachi S-4800 instrument operated at a beam energy of 3.0 kV.
The high-resolution transmission electron microscopy(HRTEM)images of the materials were obtained using a JEM 2100F electron microscope operated at an accelerating voltage of 200 kV.
Temperature programmed reduction by H2(H2-TPR)measurements was carried out on a Micromeritics 2920 adsorption instrument equipped with a thermal conductivity detector (TCD).The samples(100 mg)were loaded and pretreated with N2at 400°C for 1 h to remove the adsorbed carbonates and hydrates.After cooling to room temperature and introducing the reduction agent of a 10.0%H2/Ar mixture with a flow rate of 50 mL·min-1,the temperature was then programmed to rise at a ramp of 10°C·min-1.
2.3 Temperature-programmed desorption of NO
NO-TPD was carried out in a quartz tube reactor(i.d.=8 mm)under an atmospheric pressure.The catalyst(500 mg, 40-80 mesh)was charged and pretreated in 3.0%O2/N2(1000 mL·min-1)at 400°C for 1 h,and cooled to 50°C with the pure N2gas,and then the catalyst was exposed to 0.05%NO,3.0% O2/N2(1000 mL·min-1)until the adsorption of NO reached a saturate state at 50°C.Then,the catalyst with adsorption saturation of NO was purged by pure N2to remove physically adsorbed NO species on the surface at 50°C for 1 h,and subsequently heated from 50 to 400°C at 10°C·min-1in a flowing pure N2(1000 mL·min-1).Both NO and NO2concentrations in the outlet gases were detected by an online chemiluminescence NO-NO2-NOxanalyzer(42i-HL,High Level,Thermo Electron Corporation).The desorption amount was calculated according to integral area of the corresponding desorption curve.
2.4 Catalytic activity measurements
The NH3-SCR reactions were performed in a fixed-bed quartz reactor(i.d.=8 mm)under an atmospheric pressure.Desired amount of the catalyst(40-80 mesh)was charged for each run.The feed gas was composed of 0.05%NO,0.05% NH3,3.0%O2,and balanced N2,and the total flow rate was 1000 mL·min-1.The concentrations of NO in the inlet and outlet gases were measured by an on-line chemiluminescence NO-NO2-NOxanalyzer(42i-HL,High Level,Thermo Electron Corporation).The data were recorded after the reactions reached the steady state for each run.

Fig.1 XRD patterns of the nanorods,nanocubes,and standard pattern of α-Fe2O3in JCPDS
3 Results and discussion
3.1 Structure and morphology
Fig.1 shows the typical XRD patterns of the as-synthesized samples.The peak positions are indexed to α-Fe2O3(JCPDS No.86-0550),suggesting that there are no impurity crystals. There are some differences between the patterns of the two samples,indicative of the differences in the size,morphology, and preferentially exposed crystal faces.The strong peaks of the α-Fe2O3nanocubes show that the α-Fe2O3is well crystalline and has a large size.The peaks of α-Fe2O3nanorods are broader,indicating that the crystal size is smaller.It can be clearly seen that the(110)and(300)peaks of the nanorods are stronger than those of the standard pattern of α-Fe2O3(JCPDS No. 86-0550),while the(104)peak is weaker than the standard pattern.Possibly,it can be concluded that the(110)face of nano-rod is preferential growth crystal face,confirmed by the following HRTEM analysis.The results are line with the BET results that the nanocubes have a smaller surface area(3.0 m2·g-1) than the nanorods(19.1 m2·g-1).

Fig.2 SEM image(a),FE-SEM image(b),and structure model(c)of nanocubes;SEM image(d),TEM image(e),and HRTEM image and selected area electron diffraction(SAED)pattern(f)of the nanorods
Fig.2 shows the morphology,size,and exposed crystal faces of nanocubes in the SEM and FE-SEM image.It can be seen that the α-Fe2O3are quasicubic particles in Fig.2(a).The average length of the single crystal is 450-500 nm.According to the references,17-21the exposed six crystal faces are equivalent with the{012}faces,shown as the model in Fig.2(c).Compared with the nanocubes,the nanorods exhibit different morphology,size,and exposed crystal faces.Fig.2(d,e)show the SEM and low-magnification TEM of the nanorods,respectively,and the product is rod-like and about 300-400 nm in length and 20-40 nm in width.Fig.2(f)displays the approached information from the HRTEM and SAED analysis of a nanorod. The single nanorod shows unambiguous fringes with 0.251 nm,which is consistent with the interplane spacing of the (110)face,indicating that the nanorods expose the{110}faces.This is in conformity with the SAED pattern in the inset of Fig.2(f).
3.2 H2-TPR and NO-TPD
Fig.3 shows the H2-TPR profiles of the two samples.As for α-Fe2O3,the reduction peak below 570°C is due to the transition from α-Fe2O3to Fe3O4.22For α-Fe2O3nanocubes,the lowtemperature reduction peak is located around 430°C,much higher than the corresponding one(about 330°C)of the α-Fe2O3nanorods.The result strongly suggests that the α-Fe2O3nanorods have better reducibility than the α-Fe2O3nanocubes.
Fig.4 shows the NO-TPD results of the two samples.It can be clearly seen that the peak of nanorods is much higher than that of the nanocubes.In order to eliminate the impact of the surface area,the adsorption amounts in terms of the adsorbed NO molcules per unit surface area of two samples are listed in Table 1.The results of the nanocube and nanorod are 2.7×10¹⁸and 7.3×10¹⁸molecules·m-2,respectively,suggesting that the nanorods have much stronger adsorption ability towards NO than the nanocubes.According to the literature,23the densities of iron atoms in the(110)face of the nanorod and the(012)face of the nanocube are 10.0 and 7.3 atoms·nm-2,respectively,possibly resulting in the different adsorbed capabilities,which will have an important influence on their catalytic activities.
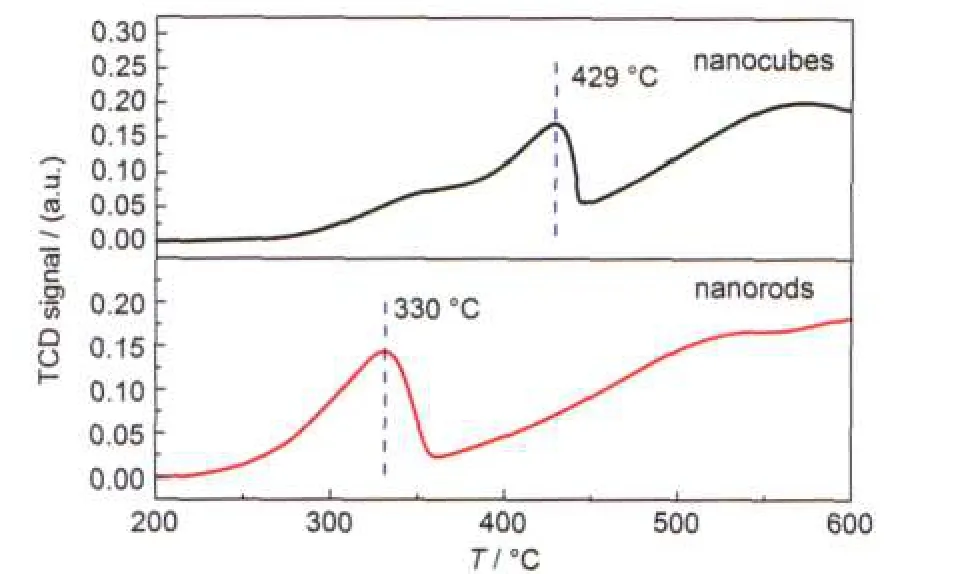
Fig.3 H2-TPR profiles of the two samples
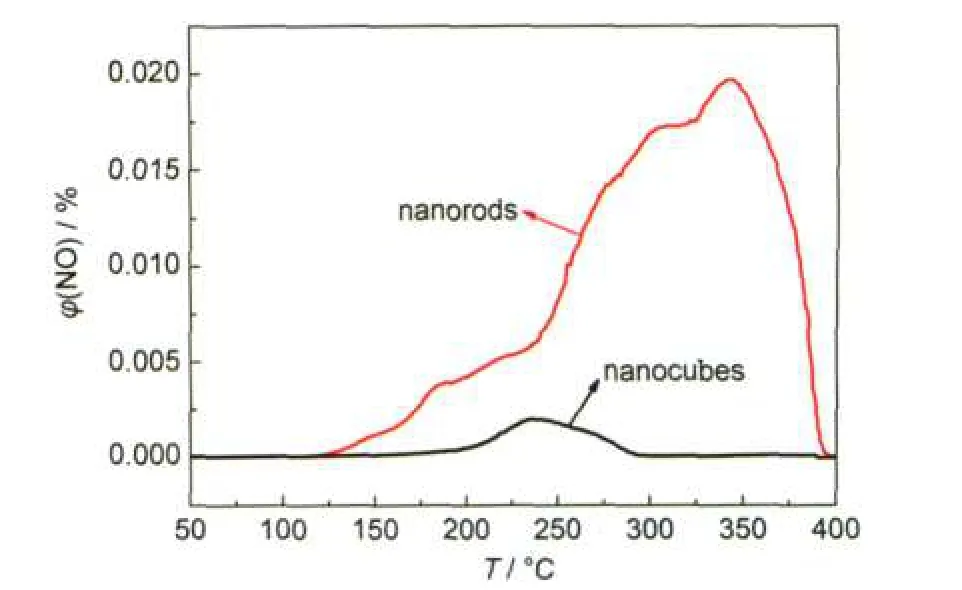
Fig.4 NO-TPD profiles of the two samples
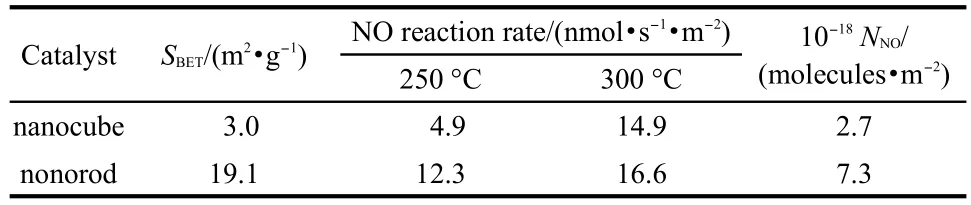
Table 1 Surface areas(SBET),adsorbed NO molecule numbers (NNO),and specific reaction rates of the two samples at 250 and 300°C
3.3 Catalytic activity
Catalytic activity of two samples was measured in the NH3-SCR reactions at 250 and 300°C.Specific reaction rates were calculated in terms of the consumed NO molecule numbers per unit surface area and per second to eliminate the influence of the surface area.The results are listed in Table 1.
It can be seen that the reaction rates of the nanorods at 250 and 300°C are 12.3 and 16.6 nmol·s-1·m-2,respectively,which are higher than those of the nanocubes.Although the α-Fe2O3nanorods have higher BET surface area than the nanocubes, the former showed much higher reaction rates per special surface area than the latter under the same reaction conditions. The exposed crystal face is possibly an important factor to give rise to the different activities.20

Fig.5 Crystal structures of the α-Fe2O3(a)and its(110)(b)and (012)(c)crystal faces
For the NO oxidation on α-Fe2O3,the reaction occurred on the Fe site,where both NH3and NO could been adsorbed.24-27Li et al.25investigated the effect of propene on the activity of Fe-ZSM-5 for NH3-SCR,and proposed a deactivation mechanism of Fe site blockage by propene and the activity for NO oxidation to NO2was significantly inhibited.Therefore,the density of iron atom of the surface structure plays a dominant part in the catalytic activity of NO.For instance,Zheng et al.19synthesized Fe2O3with the{110}faces,and the catalyst exhibited good catalytic performance for CO oxidation at 230°C.The nanocubes and nanorods have different exposed faces from the SEM,HRTEM,and SAED results.The model of α-Fe2O3crystal structure and surface atom arrangement of the(012)and (110)faces are exhibited in Fig.5.On the(110)face,the density of Fe atom is 10.0 atoms·nm-2,higher than that on the (012)face(7.3 atoms·nm-2).23So the nanorods exhibit higher specific reaction rates of NO conversion than the nanocubes.
4 Conclusions
The α-Fe2O3nanocubes and nanorods were successfully synthesized via hydrothermal processes.The α-Fe2O3nanorods show better catalytic activity for selective catalytic reduction by NH3of NO than α-Fe2O3nanocubes.The surface structures of two samples cause the different catalytic performance. SEM,HRTEM,and SAED analyses show that the nanorods exposing more{110}faces with relatively higher density of Fe atoms show more significant catalytic properties than the nanocubes exposing the{012}faces.The studies indicated that the nanomaterials with predictable morphologies,sizes,exposed crystal faces,and surface structures may have high catalytic performance and application prospect in the selective catalytic reduction of NO by NH3.The research may provide some useful information to investigate the reduction mechanism of NO on the surface of α-Fe2O3.
(1) Bosch,H.;Janssen,F.Catal.Today 1988,2,369.
(2) Tomita,A.;Yoshii,T.;Teranishi,S.;Nagao,M.;Hibino,T. J.Catal.2007,247,137.
(3) Li,X.;Zhu,P.;Wang,F.;Wang,L.;Tsang,S.C.J.Phys.Chem. C 2008,112,3376.
(4)Liu,F,D.;He,H.;Zhang,C.B.Chem.Commun.2008,2043.
(5)Wu,P.;Liu,Y.X.;Zhang,F.X.;Li,L.D.;Yang,Y.L.;Guan,N. J.Acta Phys.-Chim.Sin.2008,24,369. [武 鹏,刘运霞,章福祥,李兰冬,杨雅莉,关乃佳.物理化学学报,2008,24, 369.]
(6) Ma,J.R.;Liu,Z.Y.;Huang,Z.G.;Liu,Q.Y.Chin.J.Catal. 2006,27,91.[马建蓉,刘振宇,黄张根,刘清雅.催化学报, 2006,27,91.]
(7)Essweim,A.J.;McMurdo,M.J.;Ross,P.N.;Bell,A.T.;Tilley, T.D.J.Phys.Chem.C 2009,113,15068.
(8)Ma,A.Z.;Grunert,W.Chem.Commun.1999,71.
(9) Carja,G.;Delahay,G.;Signorile,C.;Coq,B.Chem.Commun. 2004,1404.
(10) Apostolescu,N.;Geiger,B.;Hizbullah,K.;Jan,M.T.;Kureti, S.;Reichert,D.;Schott,F.;Weisweiler,W.Appl.Catal.B: Environ.2006,62,104.
(11) Chen,Z.H.;Li,X.H.;Yang,Q.;Li,H.;Gao,X.;Jiang,Y.B.; Wang,F.R.;Wang,L.F.Acta Phys.-Chim.Sin.2009,25, 601.[陈志航,李雪辉,杨 青,李 华,高 翔,江燕斌,王芙蓉,王乐夫.物理化学学报,2009,25,601.]
(13)Wang,C.;Sun,L.;Cao,Q.Q.;Hu,B.Q.;Huang,Z.W.;Tang, X.F.Appl.Catal.B:Environ.2011,101,598.
(14) Choudary,B.M.;Mulukutla,R.S.;Klabunde,K.J.J.Am. Chem.Soc.2003,125,2020.
(15) Xie,X.W.;Li,Y.;Liu,Z.Q.;Haruta,M.;Shen,W.J.Nature 2009,458,746.
(16)Zhou,K.B.;Wang,X.;Sun,X.M.;Peng,Q.;Li,Y.D.J.Catal. 2005,229,206.
(17)Pu,Z.F.;Cao,M.H.;Yang,J.;Huang,K.L.;Hu,C.W. Nanotechnology 2006,17,799.
(18) Sugimoto,T.;Muramatsu,A.;Sakata,K.;Shindo,D.J.Colloid Interface Sci.1993,158,420.
(19)Zheng,Y.H.;Cheng,Y.;Wang,Y.S.;Bao,F.;Zhou,L.H.;Wei, X.F.;Zhang,Y.Y.;Qi,Z.J.Phys.Chem.B 2006,110,3039.
(20) Liu,X.J.;Liu,J.F.;Chang,Z.;Sun,X.M.;Li,Y.D.Catal. Commun.2011,12,530.
(21) Niu,M.T.;Huang,F.;Cui,L.F.;Huang,P.;Yu,Y.L.;Wang,Y. S.ACS Nano 2010,4,681.
(22) Sastri,M.V.C.;Viswanath,R.P.;Viswanathan,B.Int.J. Hydrog.Energy 1982,7,951.
(23) Lv,B.L.;Liu,Z.;Tian,H.;Xu,Y.;Wu,D.;Sun,Y.H.Adv. Funct.Mater.2010,20,3987.
(24) Busca,G.;Lietti,L.;Ramis,G.;Berti,F.Appl.Catal.B: Environ.1998,18,1.
(25) Li,J.H.;Zhu,R.H.;Cheng,Y.S.;Lambert,C.;Yang,R.T. Environ.Sci.Technol.2010,44,1799.
(26)Schwidder,M.;Kumar,M.S.;Bruckner,A.;Grunert,W.Chem. Commun.2005,805.
(27) Iwasaki,M.;Yamazaki,K.;Banno,K.;Shinjoh,H.J.Catal. 2008,260,205.
September 13,2011;Revised:November 14,2011;Published on Web:November 16,2011.
Effect of Surface Structure of α-Fe2O3on the Selective Catalytic Reduction of NO by NH3
YANG Xing-Ye1,2LI Bin1,*SUN Liang2HUANG Zhi-Wei2CHENG Xiao-Min1ZHANG Tao-Wei1TANG Xing-Fu2,*
(1School of Chemical and Engineering and Environment,North University of China,Taiyuan 030051,P.R.China;2Department of Environmental Science and Engineering,Fudan University,Shanghai 200433,P.R.China)
α-Fe2O3samples with nanocube and nanorod morphologies were synthesized by a simple hydrothermal route.The samples were characterized by powder X-ray diffraction(XRD),field emission scanning electron microscopy(FE-SEM),high-resolution transmission electron microscopy(HRTEM), temperature-programmed reduction by H2(H2-TPR),and temperature-programmed desorption of NO (NO-TPD),and tested for the selective catalytic reduction with NH3(NH3-SCR)of NO at moderate temperatures.The α-Fe2O3nanocubes possessed predominantly exposed{012}faces with low surface energy,while the nanorods also had some high energy{110}faces exposed.The catalytic activities of the α-Fe2O3samples were predominantly governed by their surface structures.The nanorods showed much higher activity than the nanocubes under identical conditions,consistent with the better redox properties of the nanorods as confirmed by H2-TPR and NO-TPD measurements.Therefore,α-Fe2O3nanorods with exposed high energy faces have much higher activity for NH3-SCR than nanocubes with exposed low energy faces under identical reaction conditions.
NO;α-Fe2O3;Selective catalytic reduction by NH3;Surface structure effect
10.3866/PKU.WHXB201111162
*Corresponding authors.LI Bin,Email:libin4y@163.com;Tel:+86-351-3922116.TANG Xing-Fu,Email:tangxf@fudan.edu.cn; Tel:+86-21-55664880
O643;O649
猜你喜欢
无机化学学报(2021年7期)2021-07-10
科学导报(2021年91期)2021-01-11
中北大学学报(自然科学版)(2019年6期)2019-11-22
第一财经(2019年8期)2019-08-26
无机化学学报(2019年5期)2019-05-07
读者(2018年15期)2018-07-18
中学生天地(A版)(2017年6期)2017-06-23
太空探索(2016年9期)2016-07-12
小学生导刊(低年级)(2016年6期)2016-07-02
学习月刊(2015年14期)2015-07-09