基于启发式方法和支持向量机方法预测有机物的热导率
时静洁 陈利平 陈网桦,* 石 宁 杨 惠 徐 伟
(1南京理工大学化工学院安全工程系,南京210094;2化学品安全控制国家重点实验室,山东青岛266071)
基于启发式方法和支持向量机方法预测有机物的热导率
时静洁1,2陈利平1陈网桦1,*石 宁2杨 惠1徐 伟2
(1南京理工大学化工学院安全工程系,南京210094;2化学品安全控制国家重点实验室,山东青岛266071)
构建147个有机物分子结构与其热导率值之间的定量结构-性质关系(QSPR)模型,探讨影响有机物热导率的结构因素.以147个化合物作为样本集,随机选择118个作为训练集,29个作为测试集.应用CODESSA软件计算了组成、拓扑、几何、静电和量子化学等描述符,通过启发式方法(HM)筛选得到5个结构参数并建立线性回归模型;用所选5个结构参数作为支持向量机(SVM)的输入,建立非线性的支持向量机回归模型.预测结果表明:支持向量机回归模型的性能(复相关系数R2=0.9240)虽略低于启发式回归模型的性能(R2=0.9267),但是支持向量机方法预测性能(R2=0.9682)高于启发式方法的预测性能(R2=0.9574),对于QSPR模型来说,预测性能更重要.因此,总体来说支持向量机方法优于启发式方法.支持向量机方法和启发式方法的提出为工程上提供了一种根据分子结构预测有机物热导率的新方法.
启发式方法;支持向量机;热导率;预测;定量结构-性质关系
1 Introduction
Thermal conductivity,also known as the coefficient of thermal conductivity,reflects the capacity of heat transmission.1Thermal conductivity data are most important for the engineering design of any thermal processes.2Thermal conductivities of organics at 20°C in a liquid state were studied in this research. Usually thermal conductivity is experimentally measured.Several different approaches could potentially be used to study thermal conductivity:(i)heat flux meter techniques,3(ii)flash technique,4(iii)transient plane-source method,5(iv)transient hotwire method.6Yet such measuring methods are time-consuming and technique-limited.Furthermore,an accurate determination of this property is very difficult because of convection and radiation accompanying the heat losses during experiment.7Thus,the prediction of the thermal conductivity with a theoretical method becomes important and necessary.
Quantitative structure-property relationship(QSPR)models are obtained through analyzing and calculating the correlation between the property and a variety of structural information.8-11The purpose of constructing a QSPR model is to find factors that determine the property.Meanwhile,such a model can also predict the property of compounds including those not yet synthesized,since the property is determined by the molecular structure which is translated into the so-called molecular descriptors.Recently,HM and SVM have been developed to predict nematic transition temperatures in themotropic liquid crystal,12binding affinities of adenosine A2Areceptor antagonists,13the activities of imidazothienopyrazines14and so on.Bini and his research team15also built an HM model on the thermal conductivity,but their study had some disadvantages.There were only 33 data in their sample dataset,although the squared correlation coefficient(R2)was a bit higher.Furthermore,they did not divide the sample dataset into the training set and the test one.As a result,it is impossible to know the predictive ability of the model.What is more,they did not study the non-linear model.Hence,we cannot figure out the non-linear relationship between the thermal conductivity and the molecular structure.
The objective of our work is to find the structural factors which play important roles in the thermal conductivity for organics and to establish the quantitative linear and non-linear relationships(HM and SVM)between the thermal conductivity and molecular descriptors.
2 Materials and methodology
2.1 Data
The accuracy of the prediction model can be affected directly by the reliability of experimental values.Thus it is important to select a reliable dataset.The data source in this work is from Data Manual for the Physical Property of Organic Compounds which is carefully compiled by Qingdao Institute of Chemical.
The whole dataset is composed of 147 compounds containing C,H,O,N,Cl,S,and F,and covers hydrocarbons,halogen compounds,ethers,alcohols,esters,aldehydes,ketones, amines,and amino compounds.These compounds with wide chemical diversities lay the foundation for a robust and effective prediction model.In order to build a QSPR model,the dataset was randomly divided into two subsets,the training set and the test one,consisting of 118(80%)and 29(20%)compounds,respectively.The training set was used to select variables and to construct the models,and the performance of the models was evaluated by the test one.In addition,for the purpose of comparison,the two subsets which were employed to build an HM model,and the two ones employed to build an SVM model,were exactly the same.
2.2 Descriptors
Descriptors are defined as numerical characteristics associated with chemical structures.They are derived from the chemical constitution,topology,geometry,wave function,potential energy surface,and some combinations of these items of a given chemical structure.The value of a particular descriptor can be set by the user or calculated automatically by software,such as CODESSA.Each descriptor value must be associated with a previously defined structure.In this paper,CODESSA was employed to compute values of these descriptors.The software, designed by Katritzky team,can be used to calculate 804 descriptors covering constitutional,geometrical,topological,electrostatic,quantum-chemical,and thermodynamic descriptors. The classification of these descriptors is listed in Table 1.
The selection of suitable molecule descriptors is very critical throughout the QSPR research.An efficient descriptor must be capable of providing as much structural information as possible,and the more precise the better.Recently,there are a variety of variable selection methods such as the genetic algorithm (GA)method and the HM.Herein,HM was chosen in this paper to select variables due to the two advantages of HM.First, with this approach,the global optimal solution could be found.16When selecting variables from large amounts of data, we are in need of a method to go beyond the local best solution so as to find a global best solution.But owing to their own limitations,traditional methods could be only used to search the partial solution,not the global optimal solution.The second advantage is that HM is very simple and convenient compared with GA.Although GA can also obtain the global optimal solution,people need to compile complicated codes in MATLAB environment when using this method.
HM is employed to remove some descriptors by pretreat-ment according to the following four criteria.(1)Not all compounds share the same parameters;(2)to all compounds,numerical value of descriptors changes within a small range;(3) in the equation related to parameters,HM eliminates the descriptors which do not match the following criterion:the F-test F<0.1;(4)HM deletes the descriptors whose t-test value t is less than the defined one.After the pre-selection of descriptor, multiple linear regression method is developed in a stepwise procedure.First,starting with the top descriptor from the pre-selected list of descriptors,the two-parameter correlation is calculated using the following pairs:the first descriptor with each of the remaining descriptors and the second descriptor with each of the remaining descriptors,etc.The best pairs,as evidenced by the highest F-values in the two-parameter correlations,are chosen and used for further inclusion of descriptors in a similar manner.Then,new descriptors are added one-byone until the pre-selected number of descriptors in the model is achieved.Astepwise addition of further descriptor scales is performed to find the best multi-parameter regression models with the optimum values of statistical criteria(highest values of R2, the F-test,and the standard deviation(S)).From the above processes,five descriptors are selected from descriptors pool and the linear model is produced by the HM.17

Table 1 Classification of descriptors
2.3 Computational methods
SVM was introduced by Vapnik18and has been applied to classification as well as regression tasks.For a given regression problem,the main goal of using SVM is to find the optimal hyperplane with the largest margin separating classes of data.The schematic diagram is shown in Fig.1.
For the linear regression problem,a data set is considered, and each input{(xi,yi),i=1,2,…,n}is mapped into the corresponding output.The approximate value can be obtained by the linear function:

In order to ensure the flatness of the function(1),finding out the minimum w is essential.A hypothesis is suggested:all the data points can fit with the linear function in the accuracy of ε. Then minimizing w transforms into the problem of reducing model complexity,namely,the following quadratic programming problem:min(1/2||w||2)

Fig.1 Principle description of SVM for regression problems

In consideration of the fitting error,the slack variablesand C are introduced.The constant C>0 is a regularization constant determining the trade-off between the training error and the model flatness.Then the problem correspondingly changes into the following optimization one:

The solution is a linear regression function of the optimal hyperplane as follows:

where,αi,and b are the parameters which play the performance of determining the optimal hyperplane and can be achieved by means of working out the above constraint conditions(3).
For the non-linear regression problem,with the help of the nonlinear mapping ψ,all data points are mapped into the high dimensional feature space.Then the problem can be perfectly solved just by using the above linear regression method.With the transformation of the nuclear function,the points are successfully mapped into the high dimensional feature space by the support vector machine.The kernel function accords with the following constraint:K(x,xi)=<ψ(x)·ψ(xi)>.
Once the coefficients are determined,the regression estimate is given by Eq.(5):

In the present study,the kernel function mainly contains four forms:linear nuclear,polynomial nuclear,radial basis function (RBF),and sigmoid.Herein,the widely used technique RBF was adopted for research.
2.4 Model validation
Model validation is proved to be crucial to QSPR modelling. It is acknowledged that the three aspects of fitting ability,robust performance,and predictive power are all very important. If one of them is ignored,we would never reach any comprehensive evaluation.Hence,according to OECD principles,the QSPR models,which have been built,must be comprehensively validated from the above mentioned three indices.The quality of fitting ability of the models is judged by the squared correlation coefficient R2,the average absolute error(AAE),and the root mean square error(RMSE).R2is an indicator that measures linear correlation degree between one variable and another.RMSE indicates dispersion degree of random error.The larger R2is,the smaller RMSE will be,and the model will have more fitting ability.However,good fitness does not stand for good robustness and predictive ability,thus internal validation is considered to be necessary for model validation.The internal predictive capability of a model is evaluated by leave-one-out cross-validationon the training set,which is defined as the following equation(6):

Excellent Q2can illustrate robustness as well as excellent internal predictive ability of the QSPR models;yet,it cannot guarantee the true predictive ability of the models.Roy20and Pinheiro21et al.pointed out that the external validation was a crucial and indispensable validation method used to determine the true predictive ability of the QSPR models for new chemicals.The predictive ability of a model on external validation set can be expressed byby the following equation(7):

where,yiandare respectively the experimental,predicted values of the test set,andis the mean experimental lnTC values of the samples in the training set.
3 Results and discussion
3.1 Interpretation of the selected descriptors
The descriptors of each compound were calculated by CODESSA.HM can give one-to six-parameter models.When adding another descriptor cannot improve significantly the statistics of a model,it shows that the optimum subset size has been achieved.To avoid over-parametrization of the model,an increase in the value which is less than 0.02 is chosen as the breakpoint criterion.22The influences of the numbers of descriptors on R2are shown in Fig.2.
Fig.2 shows that 5-parameter correlation is an ideal choice and adopted for the model input.Therefore,five descriptors were proposed as the model input.
3.2 Results of HM
After the heuristic reduction,a linear model was built shown in the following equation(8):


Fig.2 R2versus descriptor number
where,lnTC is the logarithm value of the thermal conductivity, F is Fish criterion,S is corrected mean square error,and n is the number of the sample.The type and the definition of the five descriptors and statistical parameters are described in Table 2.The comparison of the predicted and the experimental values are presented in Fig.3.
The aim of this study is to seek the structural factors that influence the thermal conductivity by the analysis of the descriptors.There are five descriptors including two electrostatic descriptors,two constitutional descriptors,and one quantumchemical descriptor.These descriptors reflect different characters of the molecular structure.It is observed that constitutional descriptors and electrostatic descriptors play a main role.HA dependent HDSA-1/TMSA among electrostatic descriptors represents solvent-accessible surface area of H-bonding donor H atoms which is affected by the size of the hydrogen bonding interaction.The definition of FPSA3 fractional PPSA(PPSA3/ TMSA)[Zefirovʹs PC]is FPSA3=PPSA3/TMSA,PPSA3 indicates total charge weighted partial positively charged molecular surface area,TMSA refers to total molecular surface area, and FPSA3 is expressed by fractional atomic charge weighted partial positive surface area.Relative molecular weight and relative number of C atoms are the constitutional descriptors. Quantum-chemical descriptor of the model is minimun(Min>0.1)bond order of an F atom.How much influence each descriptor has on the thermal conductivity is judged by comparing the coefficients before descriptors.If the coefficient is positive,the correlation between the descriptors and the thermal conductivity is positive,otherwise,negative.The larger the absolute value of the coefficient is,the more influence the descriptor is.Accordingly the permutation order is X3>X1>X2>X4>X5.
3.3 Results of SVM
For further research on the non-linear relationship betweenthe thermal conductivity and the molecular structure,SVM was proposed for the non-linear model.Descriptors were selected by HM as input and the thermal conductivity as output. It is difficult to choose related parameters when SVM is developed to predict.Inappropriate parameter selection can make a serious impact on the precision or accuracy of the prediction.

Table 2 Selected descriptors and statistical parameters

Fig.3 Comparison between the predicted and experimental lnTC by HM for test set
RBF was chosen as a kernel function for appropriate related parameters which is most widely used at present.23-25Grid point search(GS)was applied to choose the best parameter combination.The search range of C and γ named the width of RBF, were both from 2-8to 28,and the step length was 1.Then the best coefficient was determined on the basis of Q2loocalculated by leave-one-out cross-validation for the training set.The optimal parameters are displayed as follows:C=256,γ=0.2500,ε= 0.1.The main performance parameters are presented in Table 3 and the comparison between the predicted and the experimental values are shown in Fig.4.
3.4 Comparison and analysis of the results
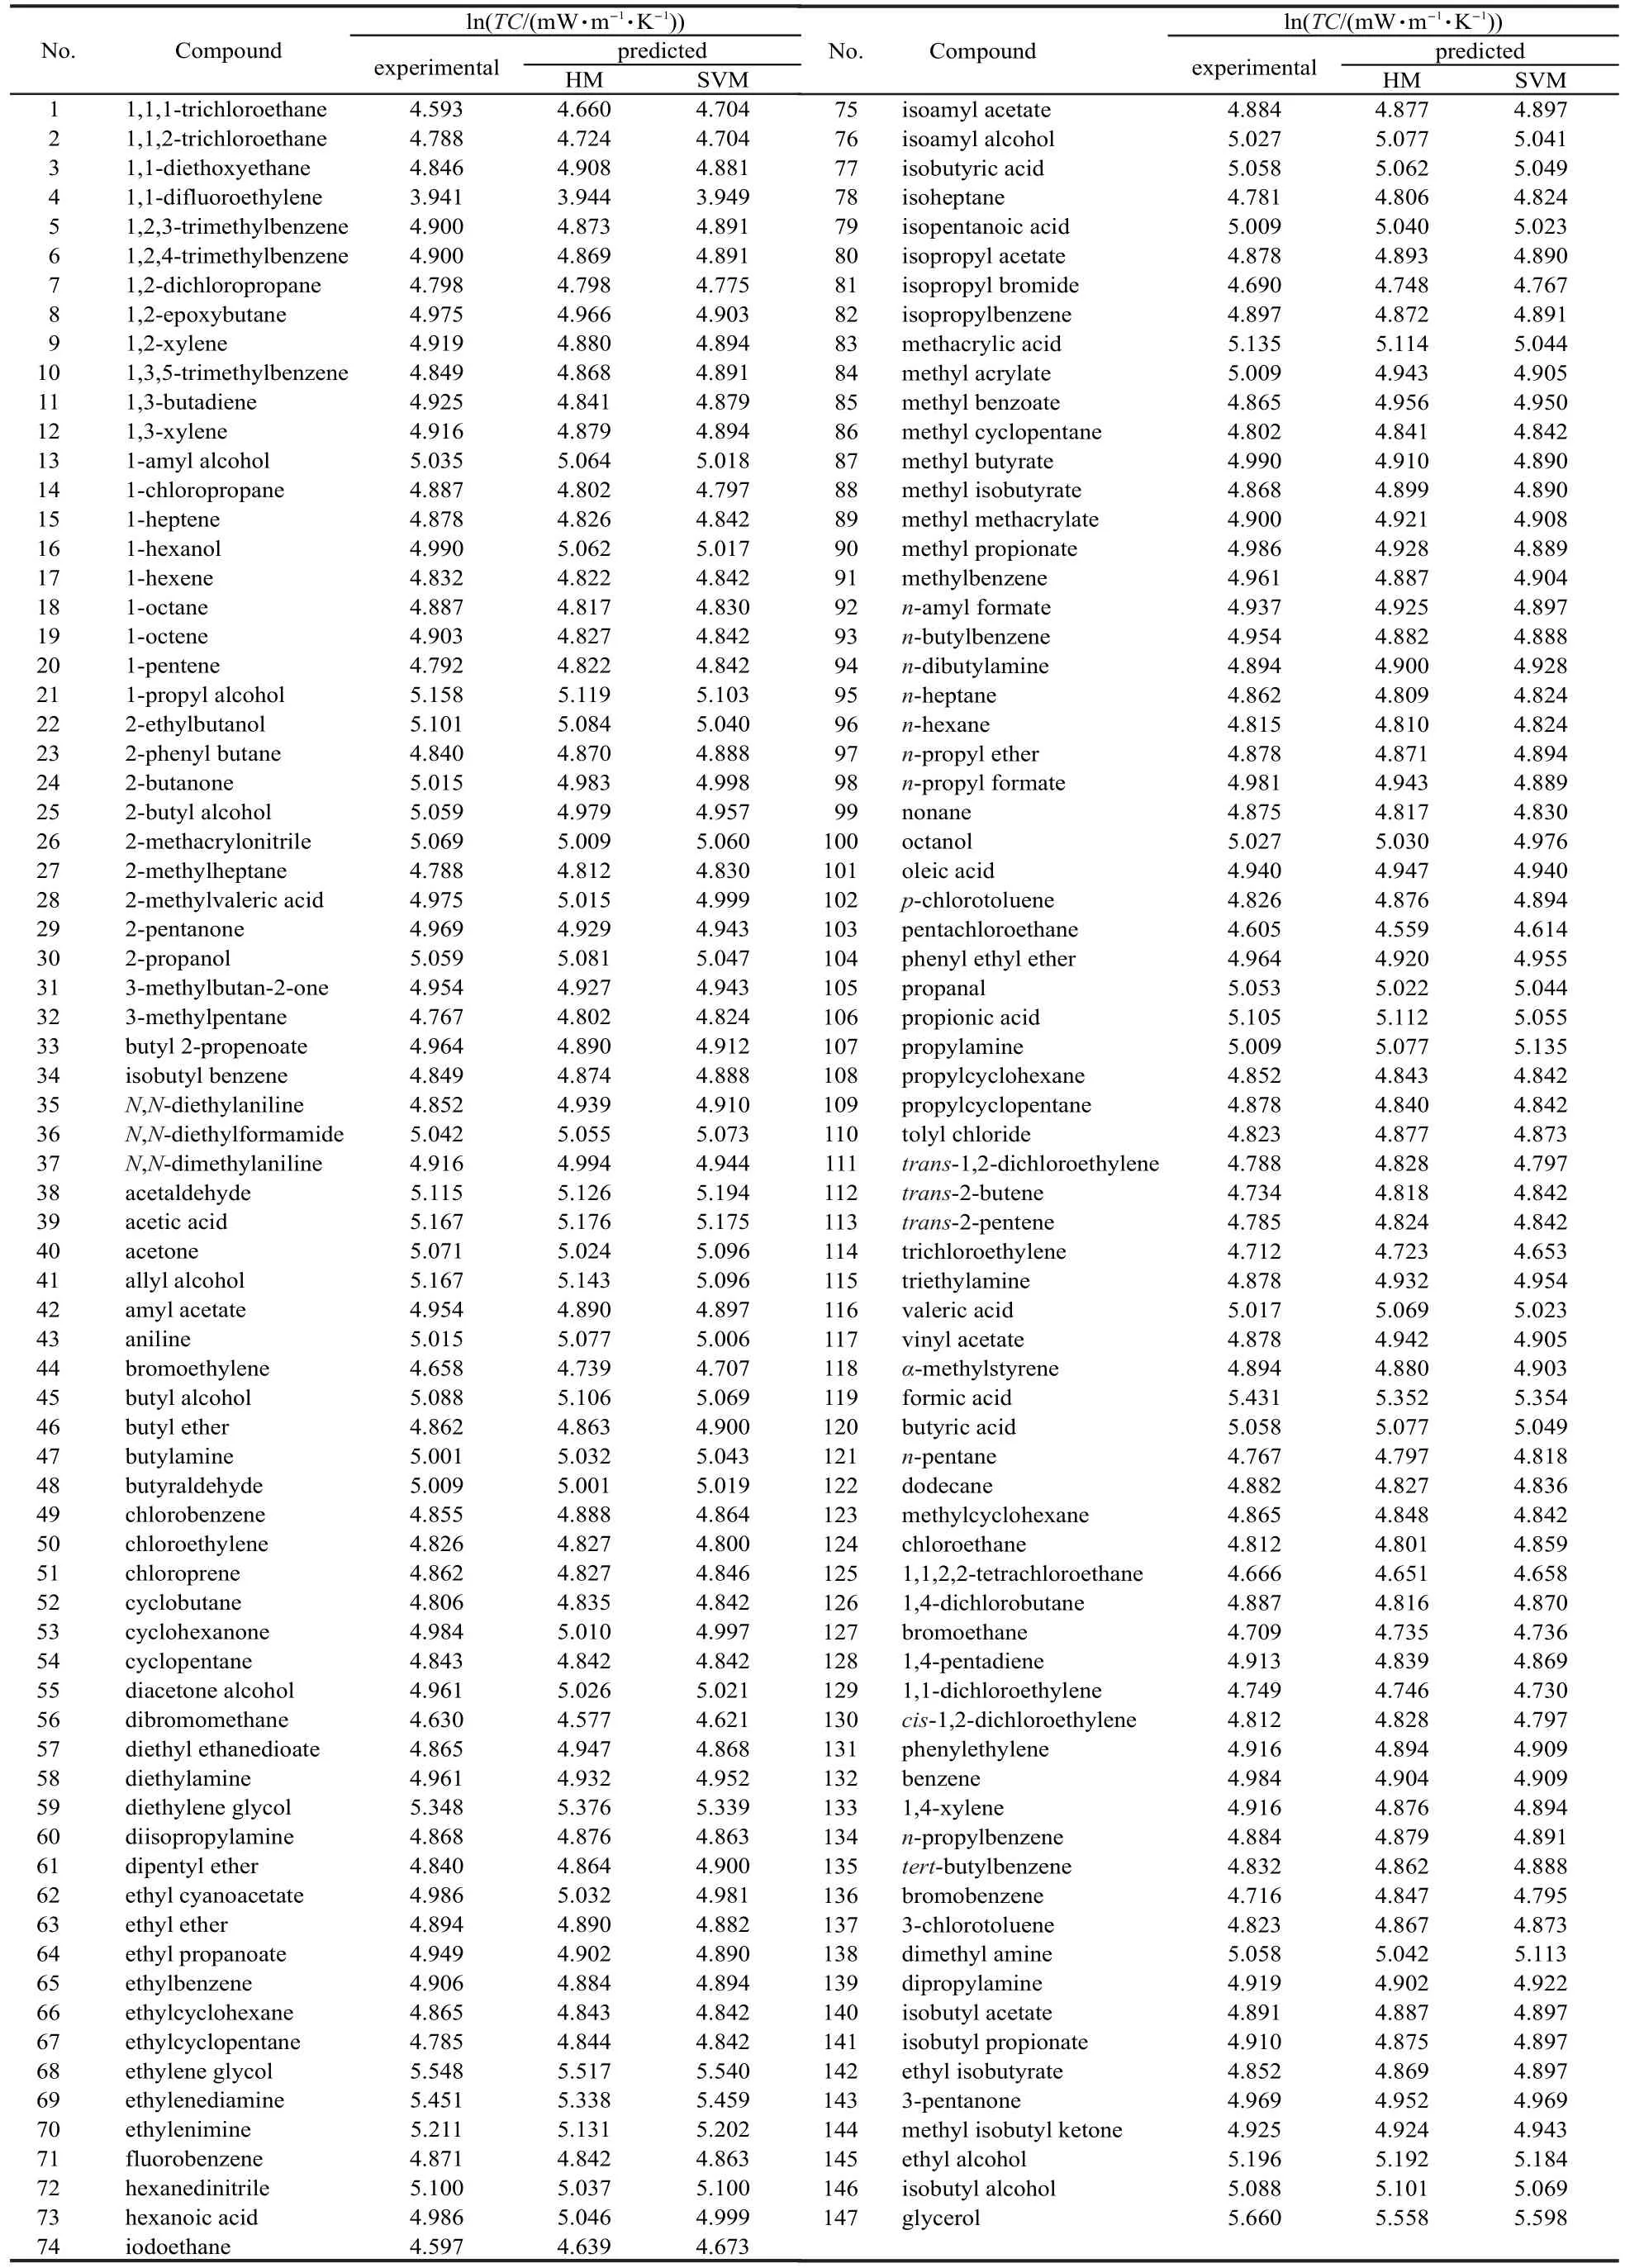
From Fig.3 and Fig.4,one can see that the calculated conversion values of HM and SVM are in good agreement with the experimental ones(Table 4),and the prediction accuracy is satisfying.As shown in Table 3,RMSE and AAE of HM and SVM are both small for the test set,and compared the training set with the test one,the prediction error is close to each other. This depicts that the constructed models have not only higher prediction ability but also better generalization performance than previous ones.
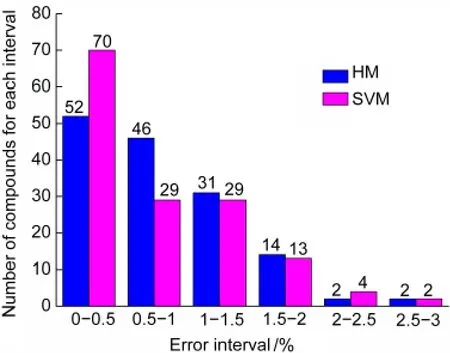
In addition,the specific calculation results of relative errorfor HM and SVM are shown in Fig.5.In terms of HM,the mean relative error is 0.7961%and the maximum relative error is 2.986%.The relative errors of 52 compounds are smaller than 0.5%,whose number accounts for about 35%of the whole samples.For SVM,the mean relative error is 0.7435% and the maximum relative error is 2.965%.The relative errors of 70 compounds are smaller than 0.5%,whose number accounts for more than 50%of the whole samples.Compared with HM,the number of larger prediction error in SVM is significantly reduced.The data in Table 3 reveals that for the training set,R2of SVM is a bit smaller than that of HM,but for the test set,R2of SVM is higher than that of HM;however,prediction ability is regarded more important,therefore,SVM model for the thermal conductivity is better than HM model.

Table 3 Performance comparison between the results of two models

Fig.4 Comparison between the predicted and experimental lnTC by SVM for test set
Although prediction effect of the two models in this study is satisfying,abnormal values still exist.Abnormal values(Table 5)severely influence the prediction performance of the models.If abnormal values of HM and SVM are screened,the performance of the models is greatly improved.
Further residual analysis on the test set of the two models was performed(Fig.6).The residuals of HM model and SVM model are both randomly distributed in both sides of the line. Thus it can be concluded that the system error is not produced in the built process for HM model and SVM model,and the built models are very robust.

Fig.5 Number of compounds for each interval and the percent errors obtained by HM and SVM

Table 4 Experimental and predicted lnTC by HM and SVM

Table 5 Abnormal values of predicted ln(TC/(mW·m-1·K-1))

Fig.6 Comparative residuals vs experimental lnTC of test set for the HM and SVM models
4 Conclusions
(1)HM in software CODESSA not only screens molecular descriptors but also builds a linear model in this paper.Then SVM constructs a non-linear model with the screened descriptors.The two models are satisfying;especially SVM has stronger ability to predict.
(2)Analysis of the screened abnormal values and the residual figure can improve the built model and make the model robust.
(3)The interpretation of the models indicates that the influential factors are solvent-accessible surface area of H-bonding donor H atoms,fractional atomic charge,weighted partial positive surface area,relative number of C atoms,and relative molecular weight.Of all the factors,solvent-accessible surface area of H-bonding donor H atoms,fractional atomic charge,and weighted partial positive surface area are primary ones.
(1) Gao,S.;Cao,C.Z.Acta Phys.-Chim.Sin.2006,22,1478. [高 硕,曹晨忠.物理化学学报,2006,22,1478.]doi:10.3866/ PKU.WHXB20061209
(2) Khajeh,A.;Modarress,H.Struct.Chem.2011,22,1315.doi: 10.1007/s11224-011-9828-6
(3) Rides,M.;Morikawa,J.;Halldahl,L.;Hay,B.;Lobo,H.; Dawson,A.;Allen,C.Polymer Testing 2009,28,480.doi: 10.1016/j.polymertesting.2009.03.002
(4) Coquard,R.;Panel,B.Int.J.Therm.Sci.2009,48,747.doi: 10.1016/j.ijthermalsci.2008.06.005
(5) Huang,L.H.;Liu,L.S.J.Food Eng.2009,95,179.doi: 10.1016/j.jfoodeng.2009.04.024
(6) Nagasaka,Y.;Nagashima,A.Rev.Sci.Instrum.1981,52,229. doi:10.1063/1.1136577
(7) Sastri,S.R.S.;Rao,K.K.Chem.Eng.J.1999,74,161.
(8)Toropov,A.A.;Toropova,A.P.;Benfenati,E.J.Math.Chem. 2009,46,1060.doi:10.1007/s10910-008-9491-3
(9) Shi,J.J.;Chen,L.P.;Shi,N.;Xu,W.;Yang,H.;Chen,W.H. China Safety Science Journal 2011,21,125.[时静洁,陈利平,石 宁,徐 伟,杨 惠,陈网桦.中国安全科学学报,2011, 21,125.]
(10)Tamm,K.;Burk,P.J.Mol.Model.2006,12,417.doi:10.1007/ s00894-005-0062-2
(11) Gharagheizi,F.Comput.Mater.Sci.2007,40,159.doi:10.1016/ j.commatsci.2006.11.010
(12) Gong,Z.G.;Zhang,R.S.;Xia,B.B.;Hu,R.J.;Fan,B.T. QSAR Comb.Sci.2008,27,1282.doi:10.1002/qsar.200860027 (13)Lu,P.;Wei,X.;Zhang,R.S.;Yuan,Y.G.;Gong,Z.G.Med. Chem.Res.2011,20,1220.doi:10.1007/s00044-010-9431-1
(14)Long,W.;Liu,P.X.;Li,X.R.;Xu,Y.;Yu,J.;Ma,S.T.;Yu,L. L.;Zou,Z.M.J.Chemometrics 2009,23,304.doi:10.1002/ cem.1235
(15) Bini,R.;Malvaldi,M.;Pitner,W.R.;Chiappe,C.J.Phys.Org. Chem.2008,21,622.doi:10.1002/poc.1337
(16) Pan,Y.Research on Prediction Model and Quantitative Relationship between the Structures and Flammability Characteristics of Organic Compounds.Ph.D.Dissertation, Nanjing University of Technology,Nanjing,2009. [潘 勇.有机物定量结构-燃爆特性相关性及预测模型研究[D].南京:南京工业大学,2009.]
(17)Katritzky,A.R.;Lobanov,V.S.;Karelson,M.CODESSA Version2.0 Reference Manual;University of Florida:Florida, 1995-1997.
(18) Vapnik,V.N.The Nature of Statistical Learning Theory;Wiley: New York,1998.
(19) Ojha,P.K.;Mitra,I.;Das,R.N.;Roy,K.Chemomet.Intell. Lab.Syst.2011,107,194.doi:10.1016/j.chemolab.2011.03.011
(20) Roy,K.;Mitra,I.;Kar,S.J.Chem.Inf.Model.2012,52,396. doi:10.1021/ci200520g
(21)Pinheiro,L.M.V.;Ventura,M.C.M.M.;Moita,M.L.C.J.J. Mol.Liq.2010,154,102.doi:10.1016/j.molliq.2010.04.013
(22) Strouf,O.Chemical Pattern Recognition;Wilely:New York 1986.
(23) Lin,S.L.;Liu,Z.Journal of Zhejiang University of Technology 2007,35,163.[林升梁,刘 志.浙江工业大学学报,2007, 35,163.]
(24) Pan,Y.;Jiang,J.C.;Wang,R.;Cao,H.Y.;Cui,Y.J.Hazard. Mater.2009,164,1242.doi:10.1016/j.jhazmat.2008.09.031
(25)Yang,H.;Chen,L.P.;Xie,C.X.;Shi,N.;Chen,W.H.Fire Safety Science 2011,20,62.[杨 惠,陈利平,谢传欣,石 宁,陈网桦.火灾科学,2011,20,62.]
July 16,2012;Revised:September 10,2012;Published on Web:September 27,2012..
Prediction of the Thermal Conductivity of Organic Compounds Using Heuristic and Support Vector Machine Methods
SHI Jing-Jie1,2CHEN Li-Ping1CHEN Wang-Hua1,*SHI Ning2YANG Hui1XU Wei2
(1Department of Safety Engineering,School of Chemical Engineering,Nanjing University of Science&Technology,Nanjing 210094, P.R.China;2State Key Laboratory of Chemical Safety and Control,Qingdao 266071,Shandong Province,P.R.China)
To build the quantitative structure-property relationship(QSPR)between the molecular structures and the thermal conductivities of 147 organic compounds and investigate which structural factors influence the thermal conductivity of organic molecules,the topological,constitutional,geometrical, electrostatic,quantum-chemical,and thermodynamic descriptors of the compounds were calculated using the CODESSA software package,where these descriptors were pre-selected by the heuristic method (HM).The dataset of 147 organic compounds was randomly divided into a training set(118),and a test set (29).As a result,a five-descriptor linear model was constructed to describe the relationship between the molecular structures and the thermal conductivities.In addition,a non-linear regression model was built based on the support vector machine(SVM)with the same five descriptors.It was concluded that,although the fitting performance of the SVM model(squared correlation coefficient,R2=0.9240)was slightly worse than that of the HM model(R2=0.9267),the predictive performance of the SVM model(R2=0.9682)was better than that of the HM model(R2=0.9574).As the predictive parameter is more important than the fitting parameter,it can be seen that the SVM model is superior to the HM model.The proposed methods(SVM and HM)can be successfully used to predict the thermal conductivity of organic compounds with pre-selected theoretical descriptors,which can be directly calculated solely from the molecular structure.
Heuristic method; Support vector machine; Thermal conductivity;Prediction;QSPR
10.3866/PKU.WHXB201209273
O641
∗Corresponding author.Email:chenwh_nust@163.com;Tel:+86-25-84315526.
The project was supported by the National Key Basic Research Program of China(973)(2010CB735510).
国家重点基础研究发展规划项目(973)(2010CB735510)资助

