
Clinical Application of Photopic Negative Response of the Flash Electroretinogram in Primary Open-angle Glaucoma
2012-08-24 10:39:46LinaHuangXiaoliShenNingFanJingHe
眼科学报 2012年3期
Lina Huang, Xiaoli Shen, Ning Fan, Jing He
Shenzhen Eye Hospital, Jinan University, Shenzhen 518040, China
Introduction
Materials and methods
Study subjects

ERG recordings
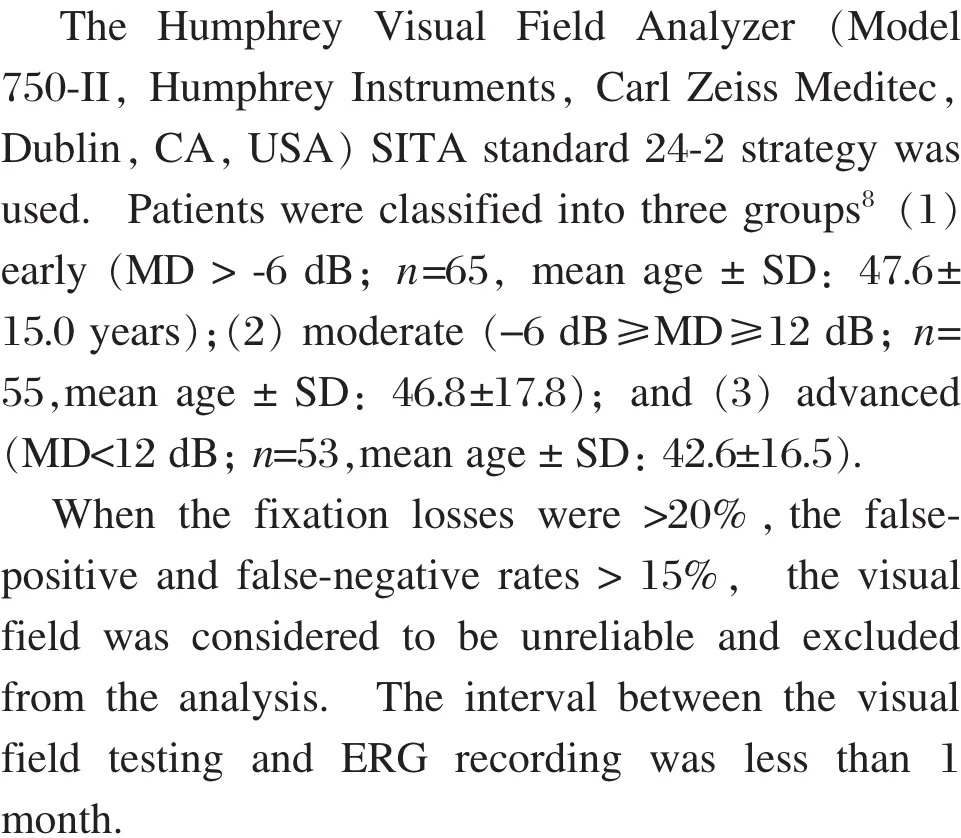
Visual field analyses
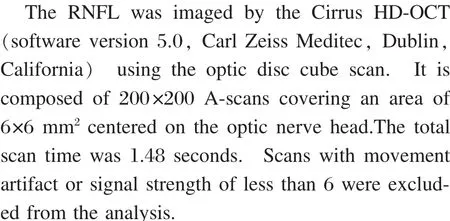
SD-OCT
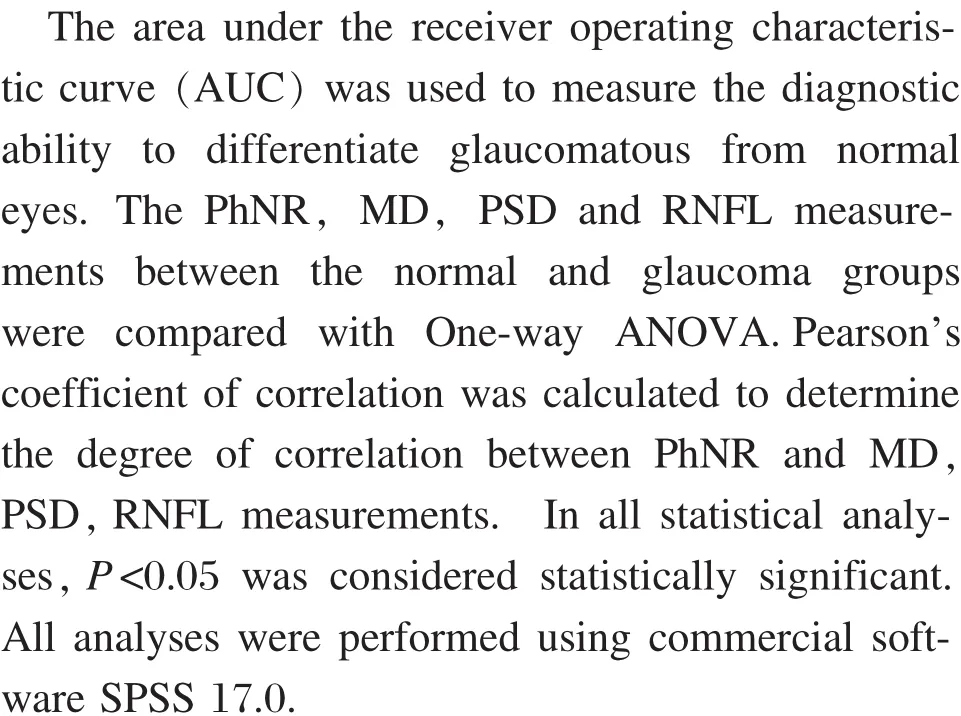
Statistical analysis
Results
ComparisonbetweenthenormalandPOAG groups
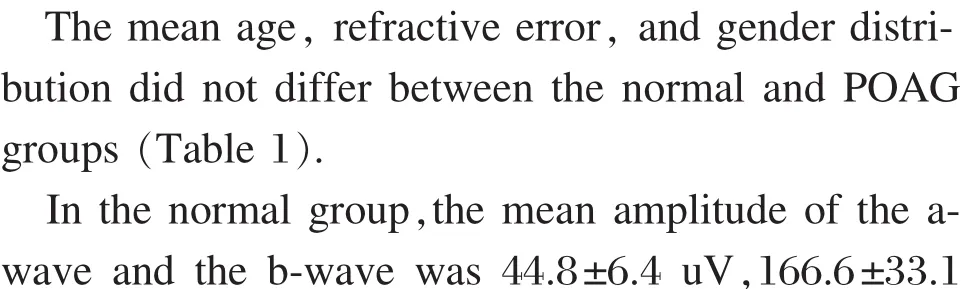
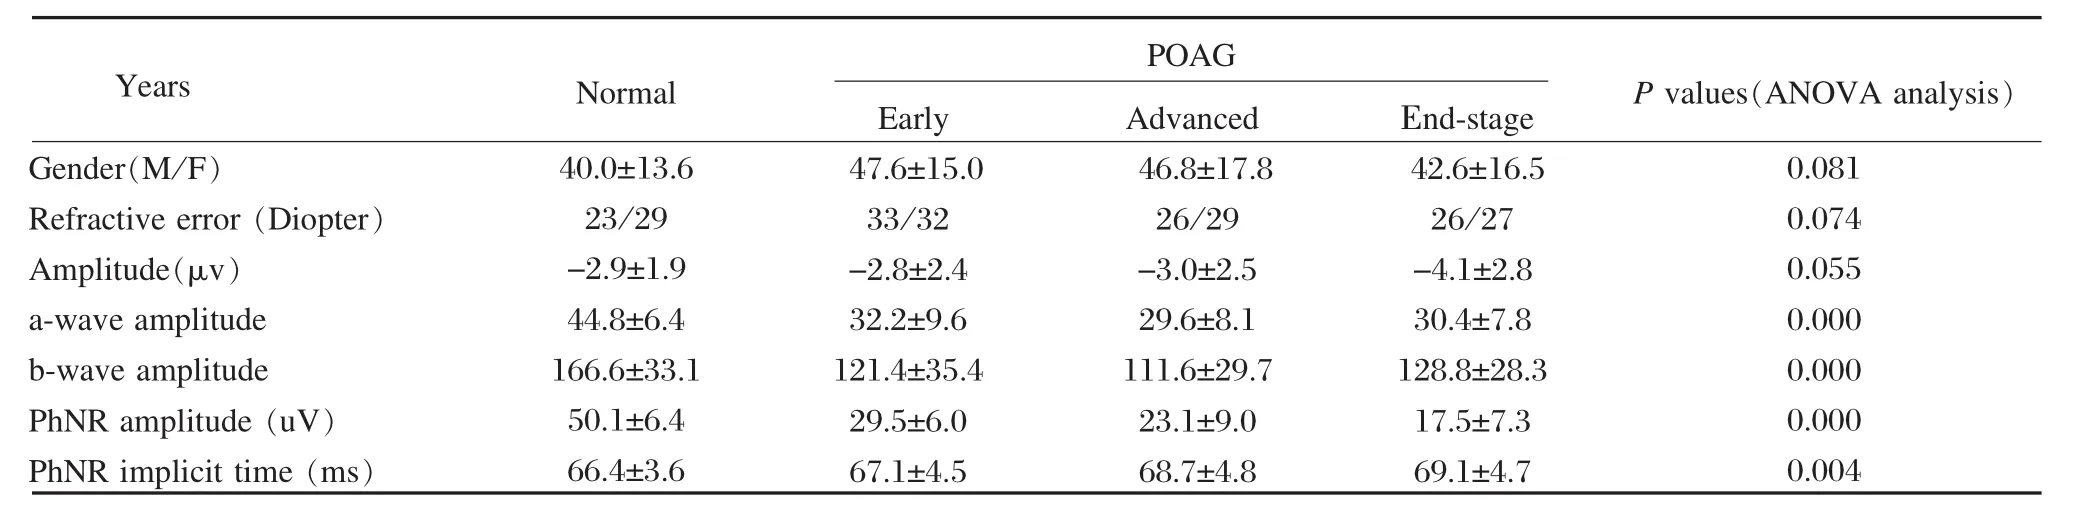
Table 1 Demographic and clinical data for this study
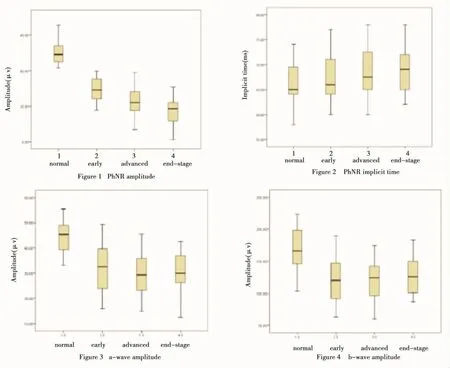
Figures 1,2,3,4 Comparison of a-waves, b-waves and photopic negative responses (PhNRs) among the four groups

Correlation between the PhNR and other parameters


Table 2 The correlation coefficient between the PhNR and other parameters
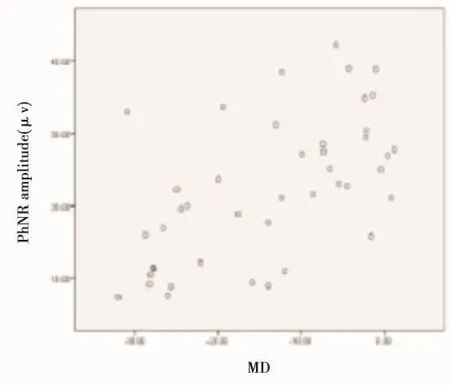
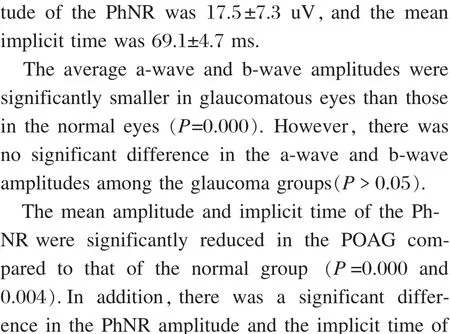
Figure 5 The scatter plots of PhNR amplitude and MD
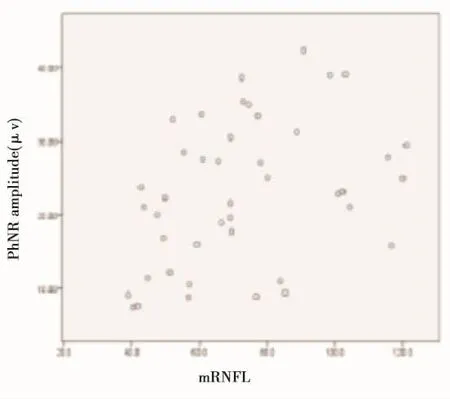
Figure 6 The scatter plots of PhNR amplitude and mRNFL
Figure 7 The scatter plots of PhNR amplitude and PSD
Sensitivity and specificity of the PhNR in early POAG
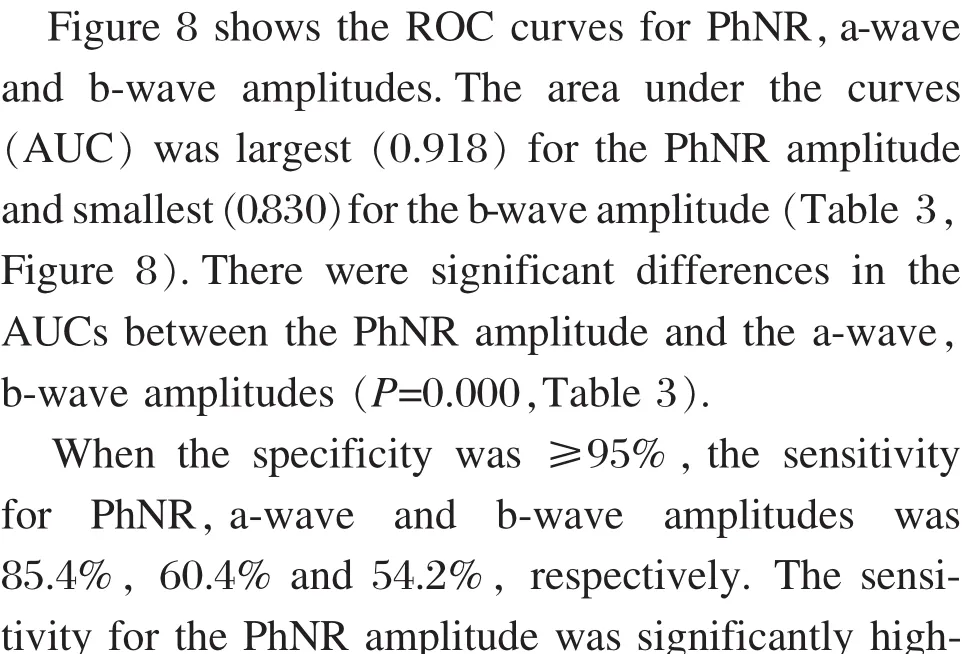
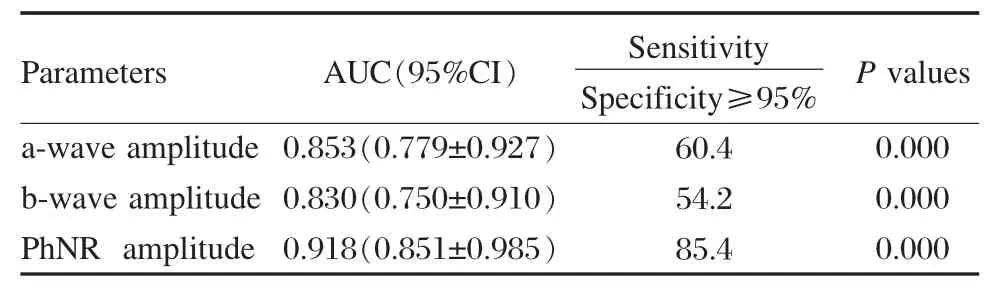
Table 3 The ROC curves analysis between the early POAG group and normal group
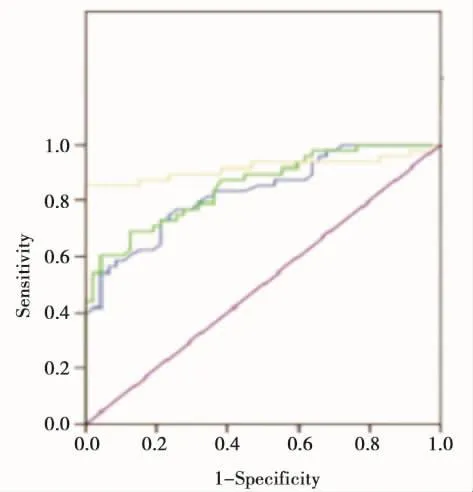
Figure 8 Receiver operating characteristic(ROC)curves for PhNR,a-and b-wave amplitudes

Discussion

- 眼科学报的其它文章
- Hydrophobic Acrylic Intraocular Lens in Both Eyes
- Different Dosages of Intravitreal Triamcinolone Acetonide Injections for Macular Edema Secondary to Central Retinal Vein Occlusion
- Clinical Analysis of Cataract Surgery Complicated by Endophthalmitis
- Efficacy of Progressive Addition Lenses in the Treatment of Ametropia after the Single Eye's IOL Implantation
- Lipofuscin-and Melanin-related Fundus Autofluorescence in Patients with Submacular Idiopathic Choroidal Neovascularization
- Application Value of Topical Aneasthesia in Children Strabismus Surgery