Spectral Match Optimization Based on Grey Relational Analysis
JIA Qi(贾其),LV Xu-liang(吕绪良)
(Engineering Institute of Corps of Engineers,PLA University of Science and Technology,Nanjing 210007,Jiangsu,China)
Introduction
The high-spectral imaging technology develops rapidly in recent years and has been applied in remote sensing,aeronautics and astronautics reconnaissance[1-3].Some high-spectral sensors can record up to 200 continuous spectrum bands,and the spectral resolution can reach to 10 nm[4].The hyper-spectral imaging Artemis carried by TacSat-3 launched in 2009 can record 400 channels in range of 400-2 500 nm with the resolution of 5 nm.The applications of remote sensing depend on the particular futures in the spectrum of ground objects more and more[5].Because existing camouflage materials can not be made in the same spectrum and color with background vegetations,the high-spectral imaging technology can discover camouflage equipments made of man-made materials in natural background,and it can expose important military targets with multi-camouflage technology,even identify them[6]. Therefore, the degree of spectral match between camouflage material and surrounding background vegetation is an important index in evaluation of camouflage scheme. Usually, partial least squares regression(PLSR)is employed to build prediction model[7],and some scholars also research the design of biomimetic camouflage materials[8]and spectral match[9-10].
The incidence analysis in grey system theory is a new factor analysis method,and it analyzes the incidence degree between factors through geometry relation of data sequences.The closer the geometry shapes of curves are,the bigger the incidence degree between two seguences is,vice versa.Some scholars deeply research the construction[11-12]and application[13-14]of grey incidence models and acquire good effects.In this paper,the spectral match model is constructed on the basis of grey incidence degree and matrix,and it can be used in optimization of camouflage pattern scheme.
1 Construction of Model
The grey incidence matrix model is constructed on the definition of synthetic degree of incidence(SDI).SDI combines the absolute degree of incidence(ADI),distance degree of incidence(DDI)and absolute degree of incidence of derivative(ADID)
Let the set of camouflage pattern schemes be V={V1,V2,V3,…,Vj,… ,Vt},and the number of in-dexes in a scheme be s,represented Vj={X1j,X2j,X3j,…,Xij,…,Xsj},where i=1,2,3,…,s;j=1,2,3,…,t.The reference scheme set can be expressed as V0={X01,X02,X03,…,X0i,…,X0s}.
1.1 Definition of SDI
The factor in the system is represented as Xifor convenience.Its k-th data is xi(k),where k=1,2,…,n.Thus,Xi=(xi(1),xi(2),…,xi(n)),where i=0,1,2,…,m,and it can represent each sequence.The reference sequence is X0=(x0(1),x0(2),…,x0(n)),and others are comparative sequences.
(1)ADI
Let


ADI can be defined as

(2)DDI
The difference between curves can be expressed by Euclidean distance,that is

where,ρ is the resolution coefficient,and ρ=0.5 usually.
(3)ADID
For vegetation and of camouflage materials simulating vegetation,the changes in spectral curve,especially its maximum and minimum,depend upon the biochemistry absorption character of vegetation greatly[4,7].And the first order derivation of spectral curve can reflect such character.If the wavelength interval is Δλ,and the first order derivation can be expressed as

(4)SDI
剖宫产时会给麻醉,但是麻醉只是阻滞了痛觉,触觉还在,手术过程中每个人仍然会有挤压不适的感觉。此外,每个人对麻醉药的敏感性不同,导致麻醉效果也不同,有一些人即使麻醉了仍然会感觉到疼痛;产后子宫会发生收缩产生宫缩痛,在按压宫底、宝宝吸奶的时候尤为明显,麻醉也不能镇住宫缩的疼痛;麻醉效果过去后,剖宫产手术切口的疼痛会出现,这是比阴道分娩额外多出的疼痛……总之,剖宫产也会疼,如果没有医学指征、仅仅因为怕疼而要求剖宫产,则是十分不应该的,也是不值得的。

ADI only reflects shape similarity of curves,DDI only reflects their nearness degree,and ADID only reflects similarity of change trend of curves.They can not represent the similarity of curves all alone.Therefore,we combine three parameters,and the SDI can be defined as
where,α,β,γ are weight values,they are in the interval of[0,1],and α +β+γ =1.If the similarity of geometry shapes of curves is more important,the value of α can be bigger.If the distance between curves is more important,the value of β can be bigger.If the similarity of change trend of curves is more important,the value of γ can be bigger.Let α =0.3,β =0.2 and γ=0.5 on the basis of analyses and applications.

1.2 Grey Incidence Matrix
For s indices of each one of t schemes,SDIs corresponding to the reference scheme are calculated respectively,noted as ηjl,where j=1,2,3,…,t;l=1,2,3,…,s.
Then,the grey incidence matrix[14]can be expressed as
Then,s'0and s'ican be calculated in the same way,and ADID is written as

1.3 Ordering for Schemes
The evaluation coefficient can be defined as

where ωlis the weight of index ηjl,it is determined according to area percentage in the whole background,and∑ ωl=1.
Then,the schemes can be collated according to their evaluation coefficients.The bigger the coefficient is,the more excellent the scheme is.
2 Application
2.1 Spectral Match Method
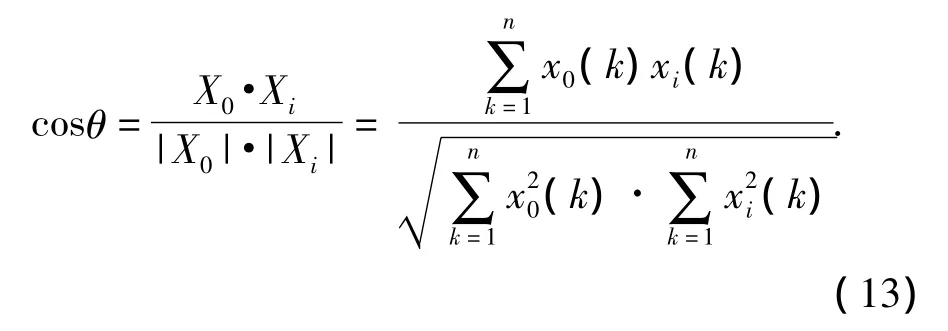
There are three methods to measure the similarity of the scheme’s spectrum to the reference spectrum[9].
Euclidean distance(ED)

Spectral angle match(SAM)

Spectral correlation Fitting(SCF)

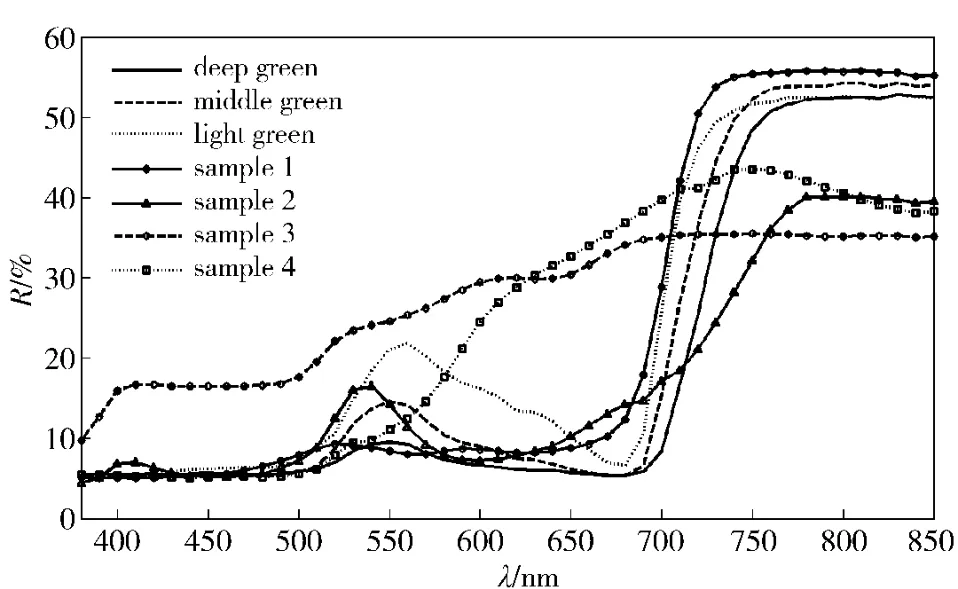
In an experiment,some spectrums of a certain field were obtained,as shown in Fig.1.Total 7 spectral curves represent 3 different stages of the vegetation,colored as dark green,middle green and light green,and 4 samples.The spectrum of dark green vegetation can be taken as the reference,and the match results of other spectrums to the reference are shown in Tab.1.

Fig.1 Spectrums of measured vegetation and samples line

Tab.1 Matching results
The results show that ED can not be used to measure the similarity of spectral curves.It can be seen from Fig.1 that the spectrums of middle green vegetation,light green vegetation and sample 1 are close to the reference spectrum.Their maximum and minimum values appear in almost the same positions,and they have the same trend.Their SAMs,SCFs and SDIs are also close to each other.And also,SAMs,SCFs and SDIs of sample 3 and 4 are all smaller.However,SAM,SCF and SDI of sample 2 are clearly different.The trend of sample 2 is also different with that of dark green vegetation,and the minimum of sample 2 is at 590 nm,that of dark green vegetation is at 680-690 nm.Whereas,SAM and SCF of sample 2 are all bigger than 0.97,and SDI is only 0.661 1 and much less than 0.84-0.89 of middle green vegetation,light green vegetation and sample 1.Therefore,SAM and SCF do not reflect the spectral similarity accurately,while SDI can measure the degree of similarity of spectral curves.It completely reflects the matching degree between the reference spectrum and the sample’s spectrum in impersonality and can be used to evaluate the camouflage effect.
2.2 Selection of Camouflage Pattern Scheme
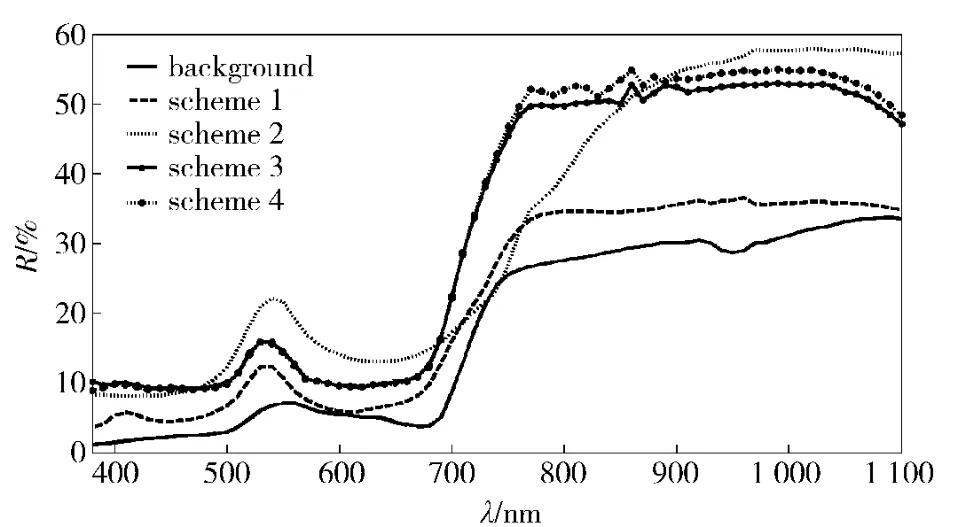
In a certain scene,the percentage of dark green vegetation is 50%,the percentage of light green vegetation is 30%,and the percentage of drab ground is 20%.There are 4 camouflage schemes,which have 3 colors.The spectrums of 4 camouflage schemes in dark green,light green and drab backgrounds are shown in Fig.2,Fig.3 and Fig.4 respectively.
The values of SDI of each index of every camouflage scheme to the reference index are calculated,and the grey incidence matrix can be expressed as

Fig.2 Spectrum ofdark green

Fig.3 Spectrum of light green

Fig.4 Spectrum of field drab

The weights are ω =(ω1,ω2,ω3)=(0.5,0.3,0.2),according to the area percentages.Then,the evaluation coefficients can be calculated as φ=(φ1,φ2,φ3,φ4)=(0.781 4,0.635 5,0.691 2,0.724 9).
Based on the evaluation coefficients,the ordering of camouflage schemes is 1,4,3,2.Therefore,the scheme 1 is the best,which is consistent with the result of observation of some observers.Thereby,the evaluation coefficient of camouflage pattern scheme provides a quantitative method for making camouflage decision.It can also be also used to evaluate other camouflage designs.
3 Conclusions
In this paper,a spectral match method based on grey incidence degree is proposed,and the evaluation model for camouflage pattern scheme is constructed on the basis of spectral match method and grey incidence matrix.The index SDI combines ADI reflecting shape similarity of curves,DDI reflecting distance between curves and ADID reflecting trend similarity of curves.It can reflect the similarity of curves.The advantage of SDI is validated experimentally.In the evaluation model established on the basis of SDI and grey incidence matrix,the weights are determined according to the area percentage in camouflage scene.The schemes can be collated quantitatively according to the evaluation coefficients.The experiment results show that the method is reasonable and practical.It resolves problems in evaluation and selection of camouflage materials.Therefore,it can be used to guide the camouflage design.
[1]DU Pei-jun,FANG Tao,TANG Hong,et al.Spectral features extraction in hyperspectral RS data and its application to information processing[J].Acta Photonica Sinica,2005,34(2):293 -298.(in Chinese)
[2]Kempeneers P,Backer S D,Debruyn W,et al.Generic wavelet-based hyperspectral classification applied to vegetation stress detection[J].IEEE Transactions on Geoscience and Remote Sensing,2005,43(3):610-614.
[3]DU Qian,YANG He.Similarity-based unsupervised band selection for hyperspectral image analysis[J].IEEE Geoscience and Remote Sensing Letters,2008,5(4):564 -568.
[4]LIU Zhi-ming,HU Bi-ru,WU Wen-jian,et al.Spectral imaging of green coating camouflage under hyperspectral detection[J].Acta Photonica Sinica,2009,38(4):885-890.(in Chinese)
[5]ZHANG Fei,Tashpolat Tiyip,DING Jian-li,et al.The reflectance spectroscopy of geo-obects in xingjiang on delta oasisi of weigan and kuqa rivers[J].International Journal of Infrared and Millimeter Waves,2010,29(3):190-195.(in Chinese)
[6]ZHAO Zhi-yong.Research on camouflage detecting for hyper-spectral imaging[D].Nanjing:PLA University of Science and Technology,2010.(in Chinese)
[7]SHEN Zhang-quan,WANG Ke,HUANG Xue-wen.Estimating the content of soil carbon by using near-infrared spectra[J].International Journal of Infrared and Millimeter Waves,2010,29(1):32-37.(in Chinese)
[8]LIU Zhi-ming,WU Wen-jian,HU Bi-ru.Design of biomimetic camouflage materials based on angiosperm leaf organs[J].Science in China,Series E:Technological Sciences,2008,51(11):1902 -1910.
[9]XU Wei-dong,YIN Qiu,KUANG Ding-bo.Comparison of different spectral match models[J].International Journal of Infrared and Millimeter Waves,2005,24(4):296-300.(in Chinese)
[10]DU Hua-qiang,JIN Wei,GE Hong-li,et al.Using fractal dimensions of hyperspectral curves to analyze the gealthy status of vegetation[J].Spectroscopy and Spectral Analysis,2009,29(8):2136 - 2140.(in Chinese)
[11]GU Hui,SONG Bi-feng.Study on effectiveness evaluation of weapon systems based on grey relational analysis and TOPSIS[J].Journal of Systems Engineering and E-lectronics,2009,20(1):106 -111.
[12]XIE Nai-ming,LIU Si-feng.Research on evaluations of several grey relational models adapt to grey relational axioms[J].Journal of Systems Engineering and Electronics,2009,20(2):304-309.
[13]ZHONG Xiao-fang,LIU Si-feng.Grey relation grade for the analysis of robust designs with dynamic characteristics[J].Systems Engineering-Theory & Practice,2009,29(9):147-152.(in Chinese)
[14]LIU Si-feng,XIE Nai-ming,et al.Theory and practice of grey systems[M].Beijing:Science Press,2008:45-71.(in Chinese)
- Defence Technology的其它文章
- Research on Coordinated Antisumarine Attack Effeciency of Two Helicopters Under Countermeasures
- Experimental Study on Plasma Temperature of Semiconductor Bridge
- Design of ANSYS-based Cathode with Complex Groove
- Study on Stable Scanning of Terminal Sensing Ammunition Based on Quaternion Transformation
- Experimental Investigation on Space-dispersed Double-wall Jet Combustion System for DI Diesel Engine
- Research on Three-Echelon Inventory Model and Algorithm for Valuable Spare Parts in Weapon Equipment

