
不同pH值制备的TiO2和TiO2/SiO2催化剂结构、表面性质及光催化活性
2011-12-12 02:41:32任成军龚茂初侯云泽陈耀强
物理化学学报 2011年6期
仇 伟 任成军 龚茂初 侯云泽 陈耀强
(四川大学化学学院,教育部绿色化学重点实验室,成都610064)
1 Introduction
TiO2photocatalyst has drawn great attention due to its stability,lower cost,and nontoxicity.1However,its applications were restricted heavily by its limited photocatalytic activity.There is a desired need to improve the photocatalytic activity of TiO2from industrial point of view.Many efforts have been devoted in the past to inhibit crystal growth,to increase surface area and to retard phase transformation by incorporating another inorganic oxide,such as SiO2,2-6ZrO2,7,8and Al2O3,9into TiO2photocatalysts.Silica is selected as a dopant in our study for following reasons:(1)TiO2/SiO2is acting as a better catalyst; (2)SiO2aqueous sol precursor is cheap and non-toxic.
It is well known that the photocatalytic activity mainly relies on its physicochemical properties,such as the phase composition,the crystallite size,the specific surface area,the pore size distribution,the surface acidity,and the particle morphology. Given here are a few reports relating to the effect of media acidity on the microstructure of photocatalysts.Huang et al.10pointed out that the crystallization and particle sizes of titania were dependent upon the precursor used,the reaction temperature,and the media acidity.Pottier et al.11suggested that the Cl/ Ti molar ratio,the aging conditions,and the acidity were the key factors determining the crystalline phases,the particle size,and morphologies of particles.Zhang et al.12revealed that the H2O2/Ti molar ratio and the pH values of the precursor played a key role in phase formation.Yu et al.13studied the effect of pH on the microstructures and the photoactivity of titania,which was prepared by hydrothermal method using tetrabutyl titanate.
In our work TiO2and TiO2/SiO2catalysts were prepared at different pH values by a precipitation method with TiOSO4and/ or SiO2sol as precursors,respectively.The effect of pH on the formation and properties of TiO2and TiO2/SiO2are different from above studies due to the differences in the preparation procedures and the precursor used.14The phase structure,surface area,surface morphology of particles,surface acidity,and surface hydroxys of the as-prepared photocatalysts will be discussed.
2 Experimental
2.1 Catalyst preparation
SiO2-doped 5%(mass fraction)TiO2was prepared from the aqueous solutions containing TiOSO4and SiO2sol.The solutions were precipitated using ammonium hydroxide to adjust the pH values(such as 7,9,and 11,respectively).The precipitates were filtered,rinsed with distilled water until sulfate ions were removed completely,then dried at 100°C and calcined at 650°C for 3 h.The samples obtained from pH 7,9,and 11 media are denoted as TS7,TS9,and TS11,respectively.The pure TiOcatalyst was prepared by the same method.The TiOsamples labeled with T7,T9,and T11 mean that they were prepared from the media of pH 7,9,and 11,respectively.
2.2 Catalyst characterization
The XRD analysis was conducted on a DX-1000 X-ray diffractometer,using Cu Kαradiation(λ=0.15406 nm),with a scanning rate of 0.05(°)·s-1.The tube voltage and current were 35 kV and 25 mA,respectively.XRD patterns were measured from 20°to 80°.The average crystallite size of anatase can be estimated by the Scherrer equation:D=0.89λ/(βcosθ).Lattice aberrance was calculated from ε=β/tgθ.Herein,β is the halfheight width of the(101)diffraction peak and θ is the Bragg angle of the(101)diffraction peak.The SEM images of the particles were measured on a Hitachi S-4800 scanning electron microscope.Fourier transform infrared(FT-IR)spectra were taken on Thermo Nicolet NEXUS-670 from 4000 to 400 cm-1.
N2adsorption-desorption isotherms were collected on QUADRASORB SI,an Automated Surface Area&Pore Size Analyzer(Uuantachrome Instruments)at-196°C.All samples were degassed at 300°C for 3 h before conducting the analyses.The BET specific surface areas were calculated from adsorption data at a relative pressure ranged from 0.05 to 0.35. The total pore volumes were calculated at a relative pressure of 0.981.Mesopore size distributions were calculated from adsorption bands using the Barrett-Joyner-Halenda(BJH)method.
The diffuse reflectance UV-Vis spectra were recorded on Pgeneral TU-1901 spectrometer,operated in the diffuse reflectance mode,for the wavelength within the range of 200-800 nm.The band gap energy(Eg)was calculated using the equation,Eg=hc/λint.Where,h is Plank′s constant(4.135×10⁻¹⁵eV· s),c the velocity of light(3×10⁸m·s-1),and λintthe wavelength corresponding to the intersection of the extension of linear part of the spectrum and the x-axis.
The NH3-TPD spectra were obtained in a quartz tubular micro-reactor.80 mg of the sample was heat-treated in a flowing Ar at 400°C for 60 min,and cooled to 80°C before taking the measurement.A mixture of 2%NH3-98%Ar was used to flow through the sample and adsorption took place at 80°C for 60 min.Then,the sample was heated from 80 to 800°C at 10°C·min-1in the flowing Ar carrier gas.The amount of desorbed NH3was monitored by a thermal conductivity detector.
Degradation of benzene was carried out in a 165 L of selfdesigned batch reactor equipped with 3 germicidal lamps(3×8 W,λ=253.7 nm).Athin layer of powder sample(0.3 g)was distributed evenly onto an aluminum foil(12 cm×24 cm).Benzene,without further purification,was used to evaluate photocatalytic activity of samples.The required quantity of liquid benzene was injected into the reactor.Once dark-adsorption equilibrium has been reached,photocatalysis gets started by turning on the UV light source.The initial concentration of benzene was 80 mg·m-3and its concentration was monitored every 30 min by GC 2000-II gas-phase chromatogram equipped with a flame ionization detector(FID)and GDX101 column. The determination of CO2concentration in the reactor was performed with a gas chromatograph(GC 2000-II)equipped with a FID and a methane converter.
3 Results and discussion
3.1 XRD analysis
Fig.1 shows that a mixture of anatase-TiO2and rutile-TiO2is obtained from pure TiO2prepared at pH 7,9,and 11,respectively.The peaks and the crystal planes were identified with the help of JCPDS-‘International Centre for Diffraction Data’. Crystal planes(101),(004),(200),(105),(211),(204),(220), (215)match well with those of the anatase phase of TiO2(Card No.73-1764).And crystal planes(110),(101),(301)match well with those of the rutile phase of TiO2(Card No.21-1276). It is also noticed that the diffraction peaks of rutile phase become more evident with increasing the pH values.This observation is different from the investigation by Yu13and Jin15et al. Yu and Jin reported that the intensities of anatase diffraction peaks became stronger with increasing pH values,but the intensities of brookite diffraction peaks decreased gradually.It is well known that the basic unit is octahedral TiO6in titania.Octahedra in anatase are arranged in zigzag chains along(221) plane,while rutile octahedra form linear chains parallel to (001).16,17Based on the experiment results obtained,it is supposed that the orientation of the third octahedron becomes more favorable to the formation of a rutile nucleus at the presence of high concentration of OH-.The TiO2clusters grow further on the nucleus and then form the rutile phase.The formation mechanism of rutile in our work is not in agreement with that proposed by Yanagisawa and Ovenstone.18Perhaps,the phase formation has correlation with the preparation procedure and the precursors used.The mechanism of phase formation for the reaction of TiOSO4and NH3·H2O under the basic conditions will be studied in the future.
Only anatase-TiO2is observed from TiO2/SiO2.Crystal planes(101),(004),(200),(105),(211),(204),(220),(215) match well with those of the anatase phase of TiO2(Card No. 73-1764).No SiO2diffraction peaks appear,which indicates that the silica exists in an amorphous phase.The results suggest the Si dopant retard the phase transformation from anatase to rutile,which is coincident with other′s observations.19-22XRD patterns of TiO2/SiO2show the broad diffraction peaks of anatase phase compared to pure TiO2,moreover,the peaks become broader with increasing the pH values,indicating that a TiO2nanocrystallite is formed.22

Fig.1 XRD patterns of pure TiO2and TiO2/SiO2catalysts prepared at different pH values
The content of phase and the crystallite size of materials are listed in Table 1.It can be seen that crystallite size of anatase-TiO2reduces slightly for all the samples when pH values rise. This result is quite different from the results reported by Yu et al.13The crystallite size of the samples decreases considerably when SiO2is doped into TiO2photocatalyst.The reason for this could be the existence of SiO2,which limits the growth of TiO2grains.Lattice aberrances of anatase-TiO2become big when either the pH values increase or the SiO2is incorporated into TiO2from Table 1.
3.2 SEM image analysis
Fig.2 shows the SEM images of TiO2and TiO2/SiO2catalysts prepared at pH 7 and pH 11.It can be seen that the surface morphologies of the as-prepared particles are quasi-spherical and most of them partially overlap to each other.The size of particles is mainly within the range from 10 to 25 nm.The diameters of titania particles observed in SEM images are a bit larger than the average crystal sizes estimated by XRD.The size of TiO2/SiO2particles is slightly smaller than pure TiO2,indicating that the SiO2used may limit the aggregation of TiO2particles.
3.3 Textural properties
The textural properties of the as-synthesized materials are summarized in Table 1.It can be seen that the BET surface ar-eas of these materials increase as the pH values arise,which is in agreement with the result reported by Li et al.2However, this is inconsistent with the observation of Yu13and Jin15et al. Yu and Jin reported that the BET specific surface areas decreased slightly with increasing the pH values.The surface area of TiO2/SiO2catalysts is drastically larger than that of pure TiO2,although they were prepared at the same pH value.The result confirms that the SiO2doping restrains the growth of TiO2crystal.This is again,in agreement with the observations reported in other literature.2-6,20,22The pore volumes grow slightly as the pH increases for all of the as-synthesized samples. The pore volume of TiO2/SiO2catalysts increases considerably compared to pure TiO2catalyst prepared at the same pH.This implies that more pollutants are likely adsorbed in the mesopores of TiO2/SiO2.

Table 1 Microstructure characteristics and rate constants of TiO2and TiO2/SiO2catalysts prepared at different pH values

Fig.2 SEM images of TiO2(a,b)and TiO2/SiO2(c,d)catalysts prepared at pH 7(a,c)and pH 11(b,d)
The pore size distributions of TiO2and TiO2/SiO2are shown in Fig.3.The TiO2samples have an open distribution of pore size ranging from 3 to 25 nm.The TiO2/SiO2samples,however,have a relatively narrow pore size distribution,mostly ranging from 3 to 10 nm,except the sample prepared at pH 7.The pore size of the samples is reduced when the SiO2is added onto TiO2at pH 9 or pH 11.A narrow pore size distribution likely affords enough residual time for the reactions between the molecules of the pollutant adsorbed and the photo-generated oxidizing radicals.

Fig.3 Pore size distribution of TiO2and TiO2/SiO2catalysts prepared at different pH values

Fig.4 Diffuse reflectance UV-Vis spectra of TiO2and TiO2/SiO2 catalysts prepared at different pH values
3.4 Diffuse reflectance UV-Vis spectra
Fig.4 gives the diffuse reflectance UV-Vis spectra of both pure TiO2and TiO2/SiO2catalysts.The absorption edges of the TiO2appear to have a little red shift at the high pH value.This may be attributed to the increase of the rutile content.Compared to pure TiO2,Si-doped TiO2results in slight blue shift for the absorption edge owing to the broad band gap of SiO2.23As shown in Table 1,the plot of transformed Kubelka-Munch function versus the energy of light affords a series of band gap energy for all the samples studied.But the difference of band gap energy is small for all the samples.A small portion of rutile phase in mixed phase merely causes a little variation in band gap among the TiO2samples prepared at different pH values.A low content of SiO2(only 5%)results in no significant effect on the band gap of the TiO2/SiO2materials.
3.5 NH3-TPD analysis

Fig.5 NH3-TPD profiles of TiO2and TiO2/SiO2catalysts prepared at different pH values
The results of the NH3-TPD measurement are illustrated in Fig.5.The NH3desorption peaks of the six samples are clearly observed from 200 to 220°C,and their acid strengths are very similar to each other.They are all classified as mid-strong acid. The peak area of the samples increases gradually with increasing the pH for both TiO2and TiO2/SiO2.The result demon-strates that the acid amount of the samples gets higher as the pH value increases.This can be explained that the higher pH, the larger surface area,the more acid sites are exposed on the large surface of samples.The peak area of SiO2-doped TiO2samples greatly increases,compared to pure TiO2prepared at the same pH.The incorporation of SiO2enhances the surface acidity of catalysts due to the strong acidity of SiO2.24Thereinto,TiO2/SiO2sample prepared at pH 11 has the highest amount of surface mid-strong acid.
3.6 FT-IR spectrum analysis
Fig.6 depicts the FT-IR spectra of pure titania and the as-synthesized TiO2/SiO2at different pH values.The absorption bands in the range of 400-600 cm-1are attributed to Ti-OTi vibrations,25while the sharp peak about 1610 cm-1is assigned to the bending vibrations of O-H in chemisorbed water.The broad absorption peak appearing near 3410 cm-1relates to a stretching vibration of the surface adsorbed water and hydroxyl groups.26,27The broad absorption peak increases considerably with increasing the pH value.In addition,these bands become stronger in SiO2-doped samples than in pure TiO2samples.This suggests that the addition of silica and the high pH environment bring more surface hydroxyl groups to the photocatalysts.
3.7 Photocatalytic activity
Fig.7 shows that the photocatalytic activity is enhanced considerably with increasing the pH values for both TiO2and TiO2/ SiO2photocatalysts.The photocatalytic activity of TiO2/SiO2catalysts is improved markedly compared to pure TiO2catalysts prepared at the same pH environment.The rate constants calculated are listed in Table 1.As shown in Fig.7,the degradation of benzene carried out easily,however,the mineralization of benzene was relatively difficult.Probably,the intermediates in the photocatalytic process were adsorbed strongly on the active sites of catalysts.Therefore,these intermediates were more difficult to be degradated.The photoactivity of the samples is much interrelated to their surface properties,for example,surface area,surface acidity,and surface OH-,etc.Surface area,surface acidity,and surface hydroxy groups of the as-synthesized photocatalysts increase significantly either when the pH values go up or when the SiO2is doped into TiO2.Therefore,more active sites may participate in the photocatalytic reaction of benzene.The benefit of higher acidity is also observed in different catalytic reactions.28-30More surface hydroxyl groups may be trapped in photoinduced holes,and then form hydroxyl radicals(·OH)with high oxidation capability.25

Fig.6 FT-IR spectra of TiO2and TiO2/SiO2catalysts prepared at different pH values

Fig.7 Degradation and mineralization of benzene on TiO2(a) and TiO2/SiO2(b)catalysts prepared at different pH values
3.8 Durability of catalyst
Fig.8 demonstrates the durability of TiO2/SiO2catalyst via 5 h reaction every cycling.It can be seen that the photocatalytic activity of the catalyst declines slightly with use times when the reaction runs from cycling 1 to 6.Photocatalytic oxidation over TiO2/SiO2can be kinetically retarded due to the accumula-tion of partially oxidized intermediate species on the catalyst surface.Whereas,the activity of the catalyst becomes steady from cycling times 6 to 10,and the catalyst has better activity. Perhaps,the intermediates continue to be degraded under ultraviolet irradiation.
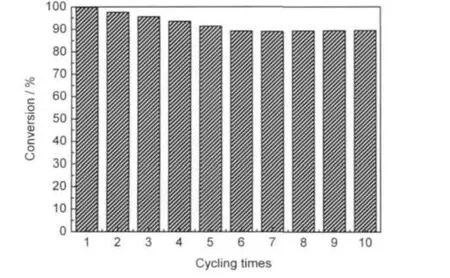
Fig.8 Changes of photocatalytic activity of TiO2/SiO2catalyst with cycling times
4 Conclusions
Low cost and better activity TiO2and SiO2-doped TiO2photocatalysts have been prepared by a precipitation method. Their structure,surface properties,and photocatalytic activity are strongly dependent on the pH values in the preparation process.
(1) Kim,D.S.;Kwak,S.Y.Appl.Catal.A:Gen.2007,323,110.
(2) Hu,Y.F.;Li,Y.X.;Peng,S.Q,;Lü,G.X.;Li,S.B.Acta Phys.-Chim.Sin.2008,24(11),2071.[胡元方,李越湘,彭绍琴,吕功煊,李树本.物理化学学报,2008,24(11),2071.]
(3) Bao,N.;Zhang,F.;Ma,Z.H.;Wei,Z.T.;Sun,J.;Liu,F.Acta Chim.Sin.2007,65(23),2786. [包 南,张 锋,马志会,魏振涛,孙 剑,刘 峰.化学学报,2007,65(23),2786.]
(4) Chen,Y.H.;Shen,J.;Zhang,Z.Chin.J.Catal.2008,29(4), 356. [陈垚翰,沈 俊,张 昭.催化学报,2008,29(4),356.]
(5) Kang,C.H.;Guo,T.;Jing,L.Q.;Cui,H.C.;Zhou,J.;Fu,H.G. J.Inorg.Mater.2009,24(2),229.[康传红,郭 桐,井立强,崔虎成,周 佳,付宏刚,无机材料学报,2009,24(2),229.]
(6) Liu,Z.H.;Su,X.J.;Hou,G.L.J.Inorg.Mater.2010,25(9), 911.[刘朝辉,苏勋家,侯根良.无机材料学报,2010,25(9), 911.]
(7)Wang,G.P.;Qiu,W.;Ren,C.J.;Chai,J.J.;Dong,W.;Chen,Y. Q.;Gong,M.C.Chin.J.Catal.2009,30(9),913.[王光平,仇 伟,任成军,柴军军,董 伟,陈耀强,龚茂初.催化学报, 2009,30(9),913.]
(8)Wang,E.J.;Yang,Y.H.;Cao,Y.A.Acta Chim.Sin.2009,67 (24),2759.[王恩君,杨辉云,曹亚安.化学学报,2009,67 (24),2759.]
(9)Yang,C.S.;Wang,Y.J.;Shih,M.S.;Chang,Y.T.;Hon,C.C. Appl.Catal.A:Gen.2009,364,182.
(10)Huang,W.P.;Tang,X.H.;Wang,Y.Q.;Koltypin,Y.;Gedanken, A.Chem.Commun.2000,1415.
(11) Pottier,A.;Chanéac,C.;Tronc,E.;Mazerolles,L.;Jolivet,J.P. J.Mater.Chem.2001,11,1116.
(12) Zhang,Y.;Wu,L.Z.;Zeng,Q.H.;Zhi,J.F.J.Phys.Chem.C 2008,112,16457.
(13)Yu,J.G.;Su,Y.R.;Cheng,B.;Zhou,M.H.J.Mol.Catal.A: Chem.2006,258,104.
(14)Aguado,J.;van Grieken,R.;López-Muñoz,M.J.;Marugán,J. Appl.Catal.A:Gen.2006,312,202.
(15) Bai,Y.;Sun,H.Q.;Jin,W.Q.J.Inorg.Mater.2008,23(2),387. [柏 源,孙红旗,金万勤,无机材料学报,2008,23(2),387.]
(16) Li,Y.;White,T.J.;Lim,S.H.J.Solid State Chem.2004,177, 1372.
(17) Li,Y.Z.;Kim,S.J.J.Phys.Chem.B 2005,109,12309.
(18) Yanagisawa,K.;Ovenstone,J.J.Phys.Chem.B 1999,103, 7781.
(19) Lim,S.H.;Phonthammachai,N.;Pramana,S.S.;White,T.J. Langmuir 2008,24,6226.
(20) He,C.X.;Tian,B.Z.;Zhang,J.L.J.Colloid Interface Sci. 2010,344,382.
(21) Tobaldi,D.M.;Tucci,A.;Skapin,A.S.;Esposito,L.J.Eur. Ceram.Soc.2010,30,2481.
(22)Dong,W.Y.;Sun,Y.J.;Lee,C.W.;Hua,W.M.;Lu,X.C.;Shi, Y.F.;Zhang,S.C.;Chen,J.M.;Zhao,D.Y.J.Am.Chem.Soc. 2007,129,13894.
(23) Cho,K.;Chang,H.;Park,J.H.;Kim,B.G.;Jang,H.D.J.Ind. Eng.Chem.2008,14,860.
(24) Bonelli,B.;Cozzolino,M.;Tesser,R.;Di,Serio M.;Piumetti, M.;Garrone,E.;Santacesaria,E.J.Catal.2007,246,293.
(25)Hou,Y.D.;Wang,X.C.;Wu,L.;Chen,X.F.;Ding,Z.X.; Wang,X.X.;Fu,X.Z.Chemosphere 2008,72,414.
(26) Prinetto,F.;Ghiotti,G.;Occhhiuzzi,M.;Indovia,V.J.Phys. Chem.B 1998,102,10316.
(27) Marcı,G.;Augugliaro,V.;Rives,V.;Tilley,R.D.;Venezia,A. M.J.Phys.Chem.B 2001,105,1033.
(28)Akurati,K.K.;Vital,A.;Dellemann,J.P.;Michalow,K.; Graule,T.;Ferri,D.;Baiker,A.Appl.Catal.B:Environ.2008, 79,53.
(29) Onfroy,T.;Clet,G.;Houalla,M.J.Phys.Chem.B 2005,109, 14588.
(30)Wang,X.C.;Yu,J.C.;Liu P.;Wang,X.X.;Su,W.Y.;Fu,X.Z. J.Photochem.Photobiol.A:Chem.2006,179,339.
猜你喜欢
石材(2020年9期)2021-01-07 09:30:04
泰山学院学报(2019年6期)2020-01-14 02:34:34
中国盐业(2018年20期)2019-01-14 01:18:42
科技知识动漫(2017年5期)2017-05-11 21:34:16
科技知识动漫(2017年4期)2017-04-15 22:24:55
科技知识动漫(2017年2期)2017-02-06 20:59:46
科技知识动漫(2016年10期)2016-10-18 20:35:00
山东青年(2016年2期)2016-02-28 14:25:31
天津商务职业学院学报(2015年2期)2015-02-28 16:47:22
天津商务职业学院学报(2015年1期)2015-02-28 16:47:12
