Hydrodynamic effects of reconnecting lake group with Yangtze River in China
Ling KANG*, Xiao-ming GUO
School of Hydropower and Information Engineering, Huazhong University of Science and Technology, Wuhan 430074, P. R. China
Hydrodynamic effects of reconnecting lake group with Yangtze River in China
Ling KANG*, Xiao-ming GUO
School of Hydropower and Information Engineering, Huazhong University of Science and Technology, Wuhan 430074, P. R. China
The hydrodynamic effects of reconnecting a lake group with the Yangtze River were simulated using a three-dimensional hydrodynamic model. The model was calibrated and validated using the measured water temperature and total phosphorous. The circulation patterns, water temperature, and water exchange conditions between sub-lakes were simulated under two conditions: (1) the present condition, in which the lake group is isolated from the Yangtze River; and (2) the future condition, with a proposed improvement in which connecting the lake group with the Yangtze River will allow river water to be diverted into the lake group. The simulation period selected was characterized by extremely high temperature and very little rain. The results show that the cold inflow from the river has a significant effect on the water temperature only near the inlets, and the effect is more obvious in the lower water layers than that in the upper ones. The circulation pattern changes significantly and small-scale vortices only exist in part of the lake regions. The water exchange between sub-lakes is greatly enhanced with the proposed improvement. The water replacement rate increases with water diversion but varies in different sub-lakes. Finally, a new water diversion scheme was proposed to avoid contamination of some lakes in the early stage.
hydrodynamic model; lake group; Donghu Lake; Yangtze River
1 Introduction
Lake-wide circulation is the basic object of research on the lake water environment. Nutrient and pollutant transport (Hamilton and Schladow 1997; Cioffi and Gallerano 2000), the distribution and re-suspension of sediments (Bailey and Hamilton 1997; Jin and Ji 2004), and vertical mixing processes (Hamblin et al.1999; Herb and Stefan 2005) are largely determined or at least influenced by lake-wide circulations. The flow can transport and redistribute nutrients and pollutants in the horizontal and vertical directions throughout lakes. Extensive field investigations and numerical simulations of the spatial distribution of phytoplankton, zooplankton, and bacteria (Morin et al.2000; Ben-Dan et al.2001; Thackeray et al.2004) have also shown a close relationship between water flow and lake biology. Spatialand temporal variability in lake hydrodynamics, nutrient loading, and other factors suggest that ecological factors that influence phytoplankton productivity and nutrient dynamics are different in various parts of lake (Tufford and McKellar 1999). Lake-wide circulation patterns may account for 29% to 47% of the basin-scale spatial variance in certain planktonic abundance (Thackeray et al.2004).
Donghu Lake, Shahu Lake, Yanhu Lake, and Beihu Lake, which are located in the middle reaches of the Yangtze River in China, form a lake group centered around Donghu Lake (Fig. 1). Donghu Lake is a large shallow lake located in Wuhan, China. With a surface area of 30.7 km2and a lake boundary of more than 138.2 km, it is the largest freshwater lake located totally within an urban area in China. It has an average depth of less than 3 m and a storage capacity of 7.35 × 10⁷m3at a stage of 19.5 m (based on the 1956 Yellow Sea height datum of China). It used to be a whole lake with no sub-lakes and have natural hydraulic relations with the Yangtze River. In the 1960s, to ease the traffic pressure of Wuhan City, Donghu Lake was divided by dikes into six sub-lakes, Guohu Lake, Tanghu Lake, Tuanhu Lake, Houhu Lake, Guanhu Lake, and Shuihu Lake. The dikes with a width of about 20 m can allow two cars to pass side by side. The sub-lakes were not completely separated. The dike between Tanghu Lake and Guohu Lake has a gap, over which a bridge was built for passing. A similar bridge lies between Guohu Lake and Tuanhu Lake. In the 1980s, Donghu Lake was totally separated from the adjacent Yangtze River and experienced an accelerated eutrophication process with the urbanization development (Gao et al. 2006). Presently, there is no more water exchange in the Donghu Lake hydrologic system, except for the sewage, rainfall, evaporation, and underground flow. Inevitably, the lake has lost its ecosystem service functions. Shahu Lake, Yanhu Lake, and Beihu Lake have had a similar environmental evolution as Donghu Lake. At present, these four lakes are isolated and their water quality continues to worsen. In order to improve this lake group, the Donghu Lake Ecological Water Network Project (DLEWNP) is being carried out by the Wuhan Municipal Government. This project will reconnect the lake group and the Yangtze River by diverting water from the river to the lake group through some existing and newly-built channels (Fig. 1).
Based on the plan, the project has two inlets, Qing Port and Zeng Port, both located near the Yangtze River (Fig. 1). They have a design flow of 30 m3/s and 10 m3/s, respectively. In future years, when the Yangtze River has high enough water levels from June to October, water will automatically flow into the lakes from these two ports and ultimately be discharged back into the Yangtze River (Fig. 1). Due to the absence of data from Yanhu Lake and Beihu Lake, only Donghu Lake and Shahu Lake were examined in this study. A program to collect data from Yanhu Lake and Beihu Lake is ongoing.

Fig. 1 Lake group and sketch of DLEWNP
Many previous studies have focused on lake hydrodynamics and its water environment in the current situation (Ahsan and Blumberg 1999; Jin et al.2000; Rueda and Schladow 2003). Diverting water from the Yangtze River will change the lake’s hydrodynamic characteristics greatly; it is essential to compare the lake hydrodynamic characteristics before and after the project. In this study, a three-dimensional hydrodynamic model was constructed. This model was calibrated and validated using the measured water temperature and total phosphorus (TP). Two conditions were designed: (1) the present condition, in which the lake group is isolated from the Yangtze River; and (2) the future condition, in which the lake group will be reconnected with the Yangtze River and the river water will be diverted into the lake group. Using the model, the lake group’s hydrodynamic characteristics and water temperature under the two conditions were compared. Finally, a new water diversion scheme was proposed.
2 Methods
2.1 Governing equations
The three-dimensional hydrodynamic model is based on the continuity equation, momentum equations, and TP and temperature transport equations. The water density is formulated with the Boussinesq approximation, in which the density differences are neglected in all terms except the gravity term (Rueda and Schladow 2003). Donghu Lake is a large and shallow lake, and the spatial analysis of its bathymetry by the GIS software shows that the bottom slope is less than 0.001 in the lake open area. Although Shahu Lake is a little smaller, it is also a shallow lake with an average depth of 1.5 m and a water surface area of 2.89 km2. The hydrostatic assumption is considered valid for both lakes because their horizontal scale is far greater than their vertical scale (Jin and Hamrick 2000). The sigma vertical coordinates and curvilinear horizontal coordinates are used. The continuity equation and momentum equations are taken from Ji (2007), in which details of the equations can be found. TP and temperature transport equations are (Ji 2007)

wherexandyare the horizontal curvilinear coordinates,zis the vertical sigma coordinate,tis time,mxandmyare the metric coefficients in thexandydirections, respectively,His the total depth,Sis the TP concentration,uandvare the horizontal velocity components in thexandydirections, respectively,wis the velocity in the vertical direction,Tis the water temperature,Abis the mass diffusion coefficient, andQSandQTare the sub-grid scale horizontal diffusion and thermal sources and sinks, respectively (Ji 2007).
In this paper,F(S) denotes the transformation process of TP, which includes the settlement and release from sediment. Its expressions are (Li et al. 2004)

whereSPis the release rate of TP from sediment,KPis the settling velocity, andublandvblare current velocity components of the bottom layer.
2.2 Boundary conditions
Expressions for the bottom shear stress and water surface wind stress are

whereτbxandτbyare the shear stresses in thexandydirections, respectively, at the bottom;κis the von Karman constant, andκ= 0.4; Δzbis the dimensionless thickness of the bottom layer;is the bottom roughness height (Mellor et al. 1998);ublandvblare the current velocity components of the bottom layer in thexandydirections, respectively;τsxandτsyare the shear stresses in thexandydirections, respectively, at the water surface;uwandvware the wind velocities 10 m above the water surface in thexandydirections, respectively; andAvis the vertical turbulent momentum diffusion coefficient.AvandAbwere calculated using a turbulence closure scheme (Mellor and Yamada 1982; Galperin et al. 1988; Blumberg et al. 1992).
The distribution of the solar radiation in the depth directionI(z) is expressed as (Rosati and Miyakoda 1988)

whereIsis the downward solar irradiance, andKeis the light extinction coefficient.
The water surface boundary condition for the heat transport equation is (Rosati andMiyakoda 1988; Hamrick 1992)

whereρis the actual water density,Cpis the specific heat of water,HLis the heat flux of long-wave radiation,HEis the latent heat,HCis the sensible heat,εis the emissivity of water,σis the Stefan-Boltzmann constant,Tsis the water surface temperature,eais the actual vapor pressure,Bcis an empirical constant,Cis the cloud fraction,Tais the air temperature,ceandchare the turbulent exchange coefficients,ρais the atmospheric density,LEis the latent heat of evaporation,wwis the wind speed,esis the saturation vapor pressure at the water surface temperature,pais the atmospheric pressure, andcpais the specific heat of air.
Because the solar short-wave radiation can penetrate the entire water column, a simple, lumped parameter heat balance relationship for the lake bed is considered. The sediment bed is thermally coupled to the water column (Jin et al. 2000) through the following equation:

wherechbis the dimensionless convective heat exchange coefficient,ρbis the bed density,cpbis the specific heat of the water-solid bed mixture,Tbis the bed temperature, andTblis the bottom layer water temperature.
2.3 Numerical schematization
Donghu Lake has 3 315 horizontal cells and four vertical layers. Shahu Lake has 298 horizontal cells and four vertical layers. Each vertical layer thickness accounts for a quarter of the total depth. This grid requires a five-second time step for numerical stability. The continuity and momentum equations were solved with a second-order accurate spatial explicit finite difference scheme on a staggered grid. Time integration is second-order accurate, using a finite difference scheme with an external-internal mode splitting method (Madala and Piacsek 1977; Sheng 1982). The temperature and TP transport equations were solved with an upwind difference scheme.
2.4 Dike generalizing
As mentioned in the introduction of this paper, there are many dikes with a width of only 20 m in Donghu Lake. They are much smaller than the cells, creating difficulties for modeling. In this study, several masks, which are the flow barriers with zero thickness, were used(Hamrick 1992). In Fig. 2 the blue lines parallel to thexaxis oryaxis are the masks. The velocity component perpendicular to the mask was set to zero and that parallel to the mask was calculated normally.
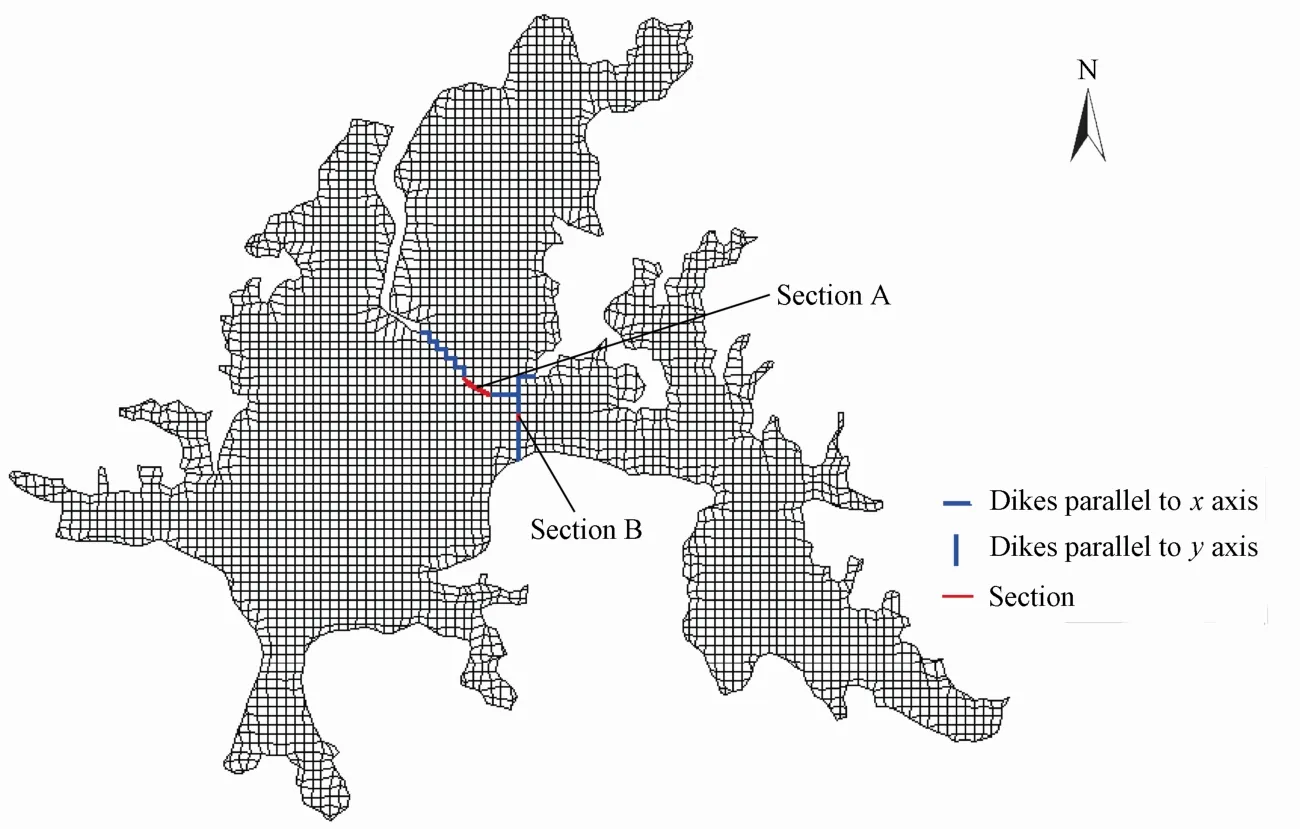
Fig. 2 Dikes and sections between sub-lakes
3 Calibration and validation
It is difficult to measure the speed of the water flow in the lake, because it is pretty low. Therefore, the flow velocity data of the lake group have not been obtained yet. Because of the lakebed siltation and reclamation of farmland from the lake, the lakebed and lake boundary have changed a lot in recent decades. The past water stage records cannot reflect the lakes’current situation, and there are no continuous stage data available for recent years. According to the condition of data available, the measured water temperature at station #2 (Fig. 1) in 1976 and 1978 and the TP concentrations in 2007 and 2008 were respectively used to calibrate the parameters and validate the model.
3.1 Water temperature
The boundary conditions include (1) air temperature, atmospheric pressure, and cloud cover; (2) wind velocity and direction; (3) relative humidity; (4) rainfall and evaporation; and (5) solar short-wave radiation. Except for solar short-wave radiation, these were all from station #1, which used to be a meteorological observation station. The daily total solar radiation was interpolated using the data from nearby Wuhan Station. The initial water level and water temperature were set at 19.88 m and 32.3℃ according to the observed values on July 1, 1978. The initial flow velocity was set at 0 m/s. Due to the sparse observation station, the spatial variability was not considered in the initial conditions.
Fig. 3 shows the simulated and measured daily average water temperatures from July 1 toAugust 31 in 1978 at station #2. In general, the agreement between the observed and simulated data was good, although disagreements existed. The maximum error occurred on July 28, and all other relative errors were less than 5%. The relative errors of less than 3% accounted for 86%.
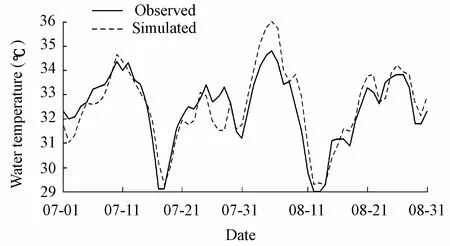
Fig. 3 Observed and simulated daily average water temperature at station #2 in 1978
On July 14, 1978, the vertical water temperature profiles were measured at station #3 at 8:00 and 17:00 (Jin et al. 1980). The simulated and observed vertical water temperature profiles are shown in Fig. 4. Although disagreements existed, the temperature’s variation trend in depth was simulated reasonably.

Fig. 4 Observed and simulated vertical water temperatures at station #3 on July 14, 1978
3.2 Total phosphorus
In Fig. 1, stations #4, #5, #6, #7, and #8 are water quality monitoring stations. In 2007 and 2008, the authors collected some water samples at these stations. The model parameters were calibrated using the TP data collected in 2007, and then the model was validated using the data from 2008 (Fig. 5). For some reasons, the data collected at station #6 in December 2008 were missing. Investigations of pollution sources, including point sources and non-point sources in the lake basins, were implemented by the Wuhan Water Authority (WWA). The non-point sources were generalized as a point source in the simulation. The minimum relative error, maximum relative error, and average relative error of the TP concentration at each station in Fig. 5 are shown in Table 1.
As mentioned above, the simulated results match the observed results very well, so the mathematical model used in this paper is verified. Except for(in Eq. (3)),(in Eq. (5)),andKe(in Eq. (7)), the parameters were all from Jin et al. (2000). In this study,d−1,cm, andm−1.

Fig. 5 Observed and simulated TP concentrations at stations #4, #5, #6, #7, and #8 in 2008

Table 1 Relative errors at five stations during model verification %
4 Simulation and discussion
Wuhan is one of the four famous furnace cities in China. Of the years between 1976 and 2005, 1978 had the most days, totaling 38, with a daily maximum temperature of above 35℃(Dai and Yan 2006). July of 1978 was a very dry month with a total rainfall of 1.4 mm, a water evaporation of 181.4 mm, and a mean temperature of 30.8℃. From August 2 to August 9, the daily maximum temperature stayed above 35℃, and on August 3 it reached the extremely highest air temperature of 39.8℃. This extreme weather condition caused a wide variation range of water temperature, allowing the simulation of the water temperature.
For the reasons described above, the duration from July 1 to August 31 in 1978 was selected as the simulation period. To study the effect of reconnecting the lake group with the Yangtze River, the simulation was conducted under two conditions: (1) the present condition, in which these two lakes are isolated from the Yangtze River; and (2) the future condition, inwhich they will be connected with the Yangtze River. The weather conditions and other parameters were the same under these two conditions. Based on the water level in the period from July 1 and August 31 in 1978 at Qing Port and Zeng Port, the inflows available from the Yangtze River at these two ports were computed (Lu et al. 2006) (Fig. 6). The two outlets of Donghu Lake (Fig. 1) had the same outflow rate, which is half of the total inflow.

Fig. 6 Available flow rate from Yangtze River from July 1 to August 31 in 1978
4.1 Hydrodynamic change
4.1.1 Circulation pattern
On August 3, 1978, the maximum temperature reached the highest temperature of 1978 (Dai and Yan 2006). At 14:00 on this day, the wind was 2 m/s (from southwest). Fig. 7 shows the simulated streamlines at that moment under the present condition (Fig. 7(a)) and future condition (Fig. 7(b)). For the present condition, southwest wind generally drives the surface currents toward the northeast. Multiple scales of vortices exist in the lakes. Fig. 7(a) shows that Tanghu Lake and Guohu Lake have similar circulation patterns except for the scales of the vortices in each sub-lake. There are two vortices in the southern and northern parts of Shahu Lake. The statistical result of speed shows that in Donghu Lake, the maximum flow velocity is about 1 cm/s, and the mean flow velocity is about 0.3 cm/s.
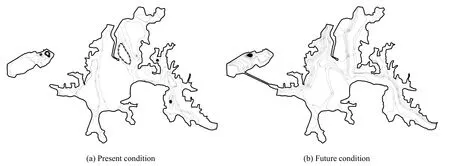
Fig. 7 Stream lines at 14:00 on August 3, 1978 under two conditions
For the future condition, Fig. 7(b) shows a circulation pattern from the inlets to the outlets. The velocity changes significantly, and the mean value is about 0.7 cm/s. The inflowand outflow clearly affect the circulation patterns and the lake water can flow in a well-defined direction. Small-scale vortices only exist in part of the lake regions. By comparing Fig. 7(a) with Fig. 7(b), we can see that the circulation patterns under the two conditions are very different. As described above, it can be concluded that in the future condition, water exchange between the lake group and the river will be possible. The lake circulation will be changed significantly, which can improve the water environment of the lake group.
4.1.2 Water exchange condition
In Fig. 2 there is a gap labeled as section A between Tanghu Lake and Guohu Lake, and section B between Guohu Lake and Tuanhu Lake. To study the water exchange near the gap, the daily average flow across the two sections was computed (Fig. 8). In the figure, a negative value denotes water flows southward and westward, and a positive value denotes water flows northward and eastward.

Fig. 8 Daily average flow across two sections from July 1 to August 31 in 1978
For section A, under the present condition, there exists a weak water exchange between Guohu Lake and Tanghu Lake. The flow across this section varies both in direction and magnitude, with a rate ranging from -7.2 m3/s to 7.6 m3/s. Under the future condition, water flows from Tanghu Lake to Guohu Lake across this section and rarely reverses, with a rate ranging from -27.5 m3/s to 1.2 m3/s. Due to the wind effect, fluctuations occur with a larger range is larger than under the present condition.
For section B, under the present condition, the flow rate is almost 0 m3/s, so there exists hardly any water exchange between Guohu Lake and Tuanhu Lake. Under the future condition, water flows from Guohu Lake to Tuanhu Lake at a flow rate of 20 m3/s. In the narrow section, the flow rate hardly varies under the wind effect when the diversion is implemented.
4.2 Water temperature
On August 3, 1978, the air temperature at station #1 (Fig. 1) reached its highest value of the year. At 14:00 on this day, the air temperature was 38.6℃. Fig. 9 shows the simulated water temperature field at that moment under the present condition. Under the future condition, the inflow temperature was set at 28.4℃. Fig. 10 shows the simulated water temperature field at the same time under the future condition.
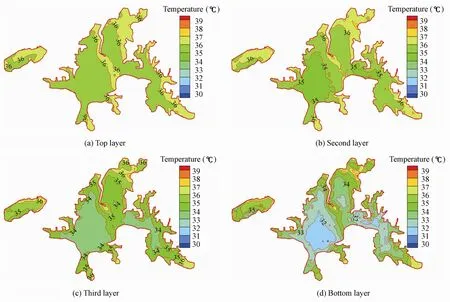
Fig. 9 Simulated water temperature field at 14:00 on August 3, 1978 under present condition

Fig. 10 Simulated water temperature field at 14:00 on August 3, 1978 under future condition
By comparing Fig. 9 with Fig. 10, it was found that the cold inflow could have a visible effect on the water temperature only near the water inlets. The effect was more obvious in thethird and bottom layers than in the top and second layers. The changes of water temperature in the other sub-lakes were less significant than Shahu Lake and Tanghu Lake. For Donghu Lake, in the direction parallel to the flow streamline, the affected range in the bottom layer was 3 000 m. Due to the heating effect of solar radiation, the affected range in the top layer was shorter, reaching 2 000 m. Shahu Lake had similar changes in water temperature. On the whole, the cold inflow affects the lake water temperature locally.
4.3 Diversion scheme discussion
4.3.1 Water exchange rate
The water exchange rate of a grid cell equals the percentage of the total water volume of this cell in the new water volume. It reflects the water replacement extent of the lake after diversion of water (Hua et al. 2009). To obtain the temporal and spatial distributions of the rate, we omitted theF(S) terms in Eq. (1). That is, only the advection and diffusion terms were considered in this computation. The boundary conditions here were the same as those in previous sections. After diversion, the exchange rate will change not only with time but also with different cells. The spatial distributions of the exchange rates on four days, July 15, July 31, August 15, and August 31, are shown in Fig. 11. This figure shows that the water in Shahu Lake, Shuihu Lake, and Tanghu Lake was replaced first and fastest; and Guanhu Lake was the last and slowest.
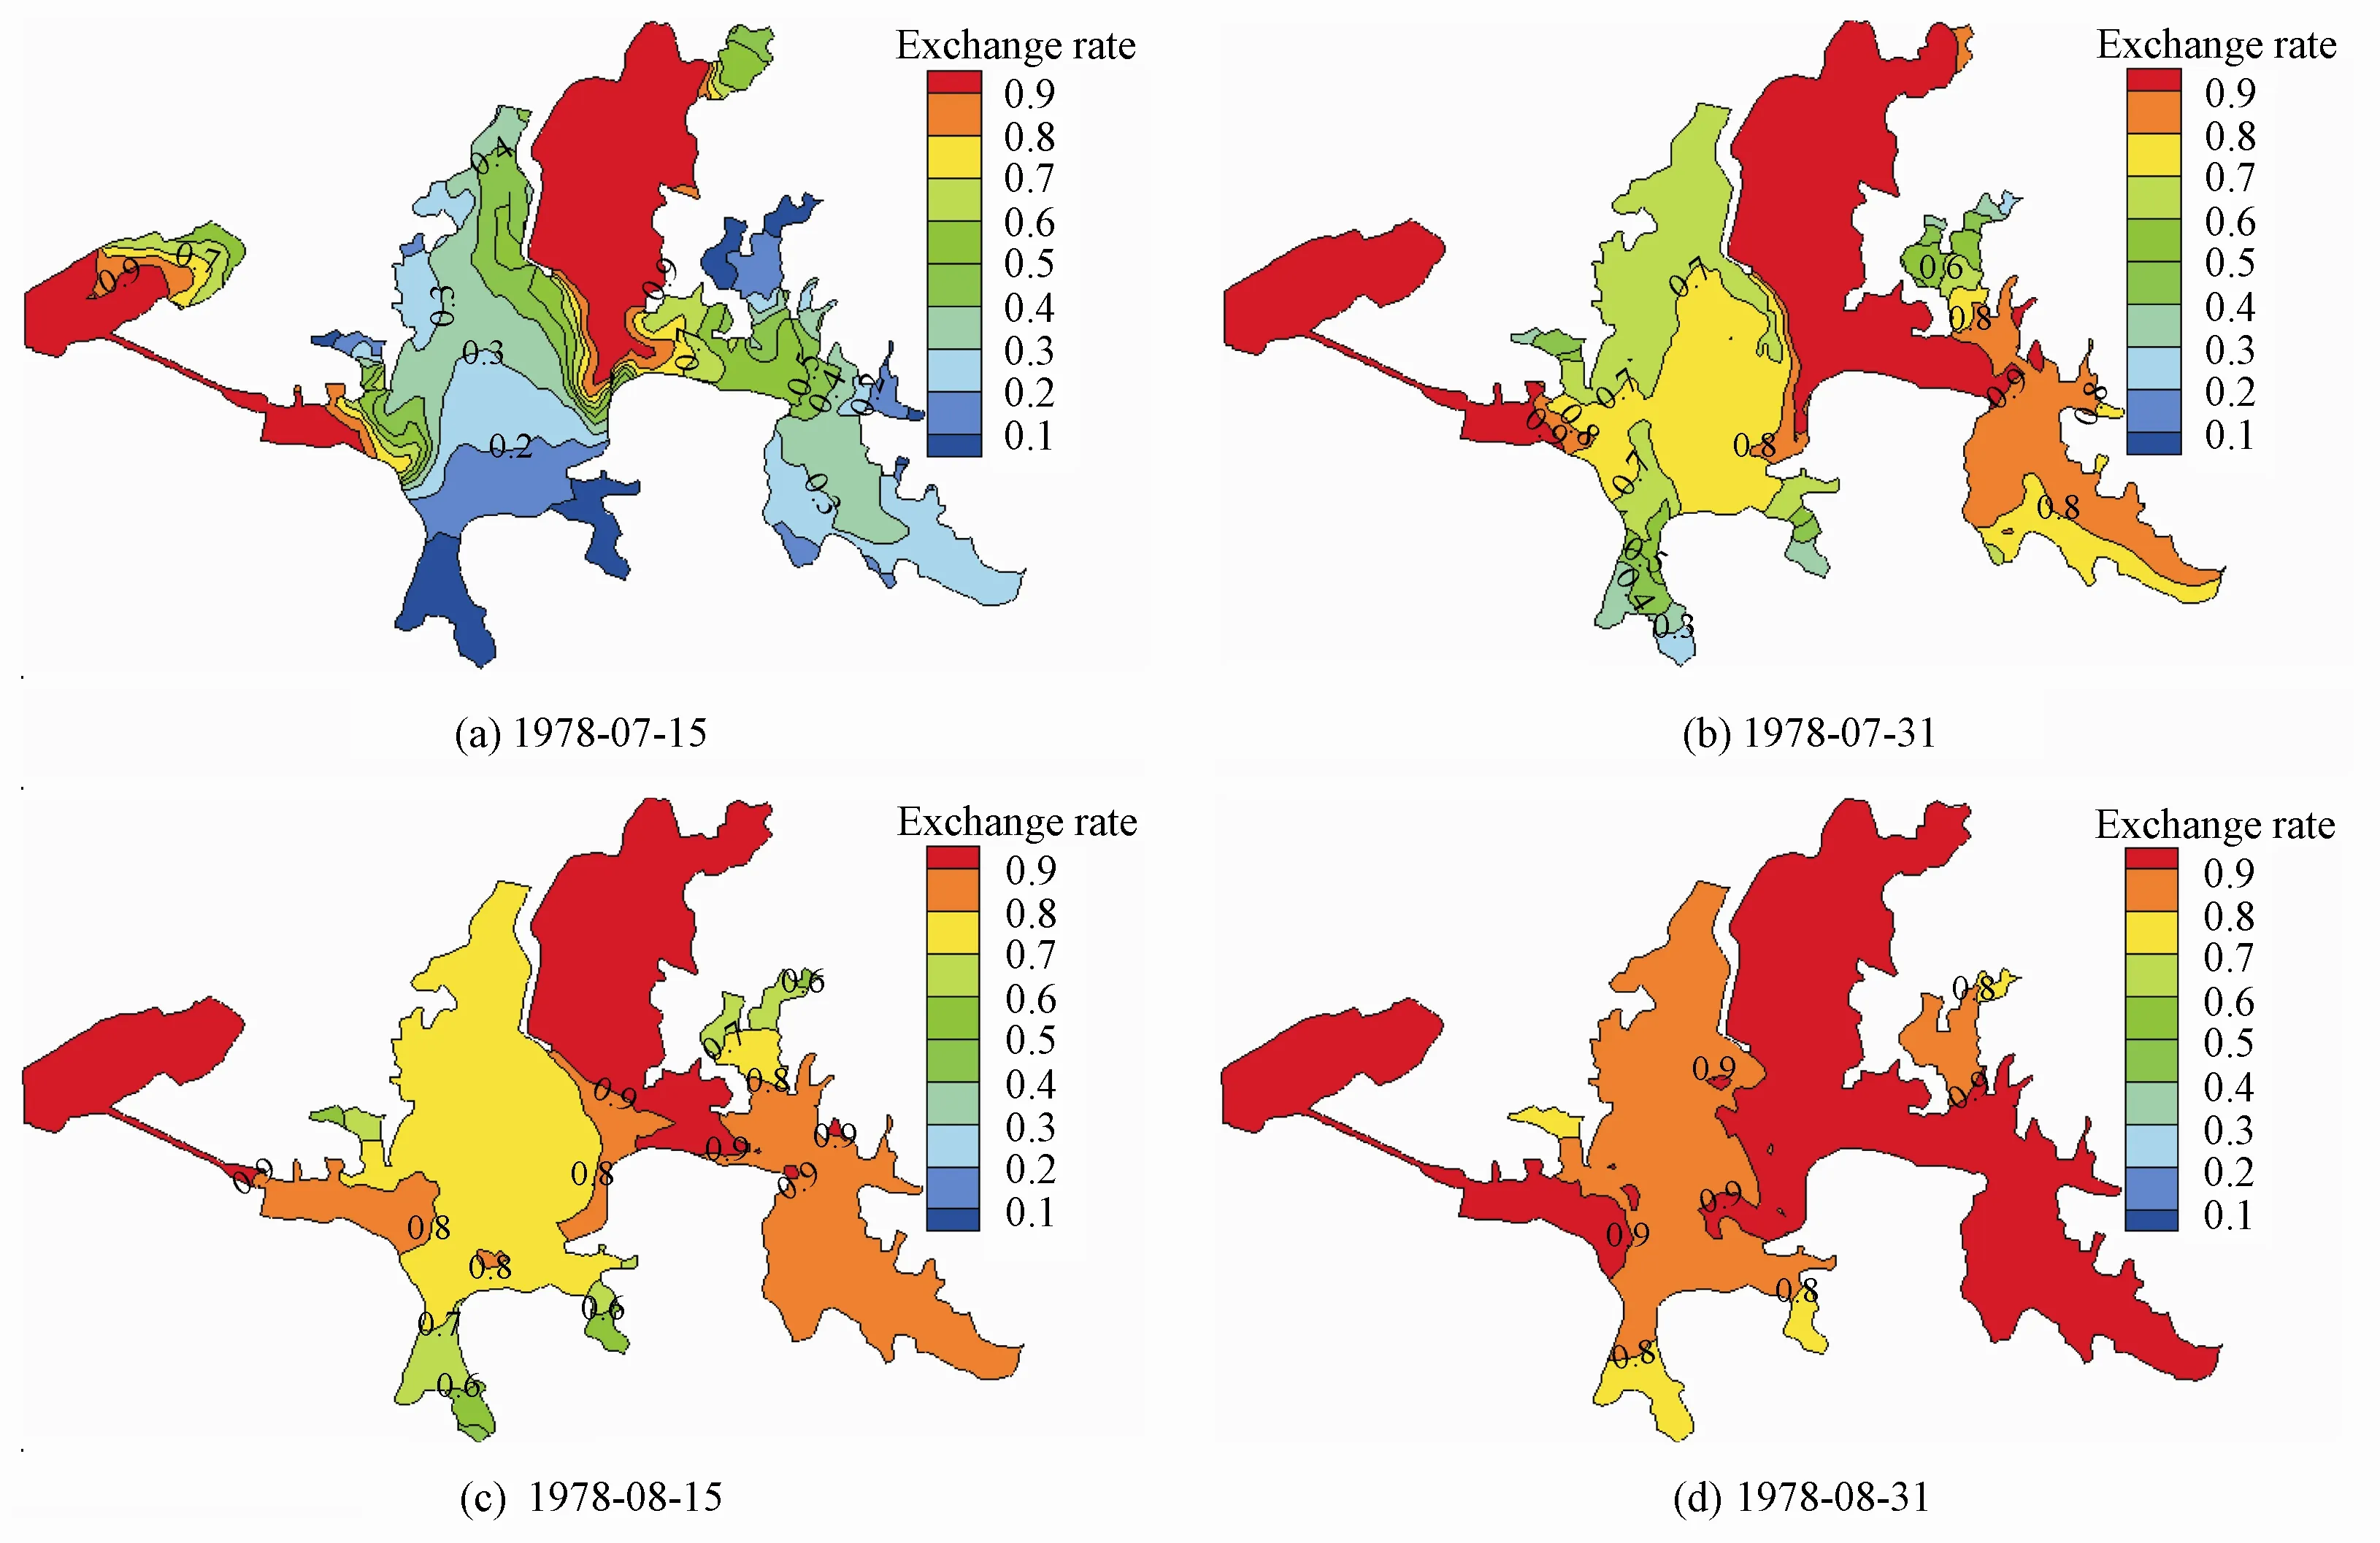
Fig. 11 Spatial distributions of exchange rates on different days
Table 2 shows the exchange rates of the seven lakes on these four days. This table indicates that from July 15 to August 31, on the whole, the exchange rate of each lake increased gradually. However, from July 31 to August 15, the rate in some lakes decreased. This is because the inflow gradually decreased from August 3 on and came to a full stop on August 11 (Fig. 8); and lake water in different sub-lakes intermixed under the action of wind. As a result, some lakes, including Shahu Lake, Tanghu Lake, Tuanhu Lake, and Shuihu Lake, declined from July 31 to August 15. In contrast, the others increased. On August 31, Guanhu Lake only had an exchange rate of 0.79, which was the lowest. It can be concluded that this water diversion scheme has a limited capability of improving the water quality in Guanhu Lake.

Table 2 Exchange rates of different lakes on different days
4.3.2 Water diversion scheme
Based on the plan, the water inflow will first flow through a flocculation pool and then into the lake group. According to the field experiment, the TP concentration of the water running out of the pool was 0.06 mg/L, which was set as the TP concentration of the inflow in the simulation. The simulated TP concentration field of July 1, 2008 from the preceding part of TP’s validation was used as the initial field. Based on the inflow process (Fig. 6), the TP concentration was simulated for the future condition.
According to the simulated results, the average TP concentration of lakes decreased, except Guohu Lake, Tuanhu Lake, and Houhu Lake. The original scheme lines in Fig. 12 show the average TP concentrations of the three lakes under the future condition. The TP concentration first increased and then decreased, indicating that they were seriously polluted at the initial stage. This result can also be inferred from the monitoring data of TP in recent years, which shows that the water quality has been the best in Tuanhu Lake and Houhu Lake, the worst in Shahu Lake, Guohu Lake, Shuihu Lake, and Guanhu Lake, and at the middle level in Tanghu Lake. Based on the stream lines in Fig. 7(b), we can see that the water in Shahu Lake and Shuihu Lake flows into Guohu Lake, and the water in Guohu Lake and Tanghu Lake flows into Tuanhu Lake and Houhu Lake. Therefore, when the water is diverted according to this original scheme, we can say that Tuanhu Lake and Houhu Lake will be seriously contaminated temporarily at the initial stage. This is not what the project managers hope for.
In order that the three lakes are not first contaminated, the authors propose a new diversion scheme in which the outlet located in Houhu Lake is not used at first and only the other outlet is used. When the TP concentration of Guohu Lake is lower than Tuanhu Lake andHouhu Lake, the outlet located in Houhu Lake comes into use. Using the same boundary conditions as the original scheme, the TP concentration of this new scheme was also simulated, as shown in Fig. 12. We can see that in this new scheme, the TP concentrations of Tuanhu Lake and Houhu Lake changed gently, indicating that they were not polluted. However, Guohu Lake was still polluted because of Shahu Lake. To address this problem, Shahu Lake has been dredged since 2009, after its water was drained. We believe that Guohu Lake will also not be contaminated in the future.

Fig. 12 Daily average TP concentrations of three lakes
5 Conclusions
The hydrodynamic effects of reconnecting a lake group with the Yangtze River were examined using a three-dimensional hydrodynamic model in this study. Two conditions, the present condition and the future condition, were designed. The circulation patterns, water exchange between sub-lakes, and water temperature were simulated in an extremely heat period under these two conditions. The results show that (1) the lake circulation patterns would be changed significantly after completion of the project and small-scale vortices only existed in part of the lake regions; (2) diverting water would improve the water exchange between Guohu Lake and Tanghu Lake; (3) the cold inflow could have a remarkable effect on the water temperature only near the water inlets, while the effect on the large open area was not obvious; (4) the temperature effect was more obvious in the bottom water than that in the surface water; and (5) the water diversion would have a limited capability of improving the water quality of Guanhu Lake.
The monitoring data show that the sub-lakes differ greatly in the TP concentration. If the original diversion scheme is implemented, Guohu Lake, Tuanhu Lake, and Houhu Lake willfirst be polluted and then improved. The authors proposed a new scheme in which the outlet located in Houhu Lake was not used and only the other outlet was used. When the water quality of Guohu Lake is better than Tuanhu Lake and Houhu Lake, the disabled outlet starts to work. The simulated results indicate that this new scheme is effective.
Ahsan, A. K. M. Q., and Blumberg, A. F. 1999. Three-dimensional hydrothermal model of Onondaga Lake, New York.Journal of Hydraulic Engineering, 125(9), 912-923. [doi:10.1061/(ASCE)0733-9429(1999) 125:9(912)]
Bailey, M. C., and Hamilton, D. P. 1997. Wind induced sediment resuspension: A lake-wide model.Ecological Modeling, 99(2-3), 217-228. [doi:10.1016/S0304-3800(97)01955-8]
Ben-Dan, T. B., Shteinman, B., Kamenir, Y., Itzhak, O., and Hochman, A. 2001. Hydrodynamical effects on spatial distribution of enteric bacteria in the Jordan River-lake Kinneret contact zone.Water Research, 35(1), 311-314. [doi:10.1016/S0043-1354(00)00229-3]
Blumberg, A. F., Galperin, B., and O’Connor, D. J. 1992. Modeling vertical structure of open-channel flows.Journal of Hydraulic Engineering, 118(8), 1119-1134. [doi:10.1061/(ASCE)0733-9429(1992)118: 8(1119)]
Dai, Q., and Yan, H. 2006. Analysis of high temperature characteristics and its prediction error of Wuhan in 2005.Hubei Meteorology, 25(1), 16-18. (in Chinese)
Galperin, B., Kantha, L. H., Hassid, S., and Rosati, A. 1988. A quasi-equilibrium turbulent energy model for geophysical flows.Journal of the Atmospheric Sciences, 45(1), 55-62. [doi:10.1175/1520-0469(1988)]
Gao, Q., Liu, Y. T., and Mao, H. Y. 2006. Environmental influence of Wuhan urban agglomeration development and strategies of environmental protection.Journal of Environmental Sciences, 18(3), 616-623.
Hamblin, P. F., Stevens, C. L., and Lawrence, G. A. 1999. Simulation of vertical transport in Mining Pit Lake.Journal of Hydraulic Engineering, 125(10), 1029-1038. [doi:10.1061/(ASCE)0733-9429(1999)125: 10(1029)]
Hamilton, D. P., and Schladow, S. G. 1997. Prediction of water quality in lakes and reservoirs, Part I: Model description.Ecological Modeling, 96(1-3), 91-110. [doi:10.1016/S0304-3800(96)00062-2]
Hamrick, J. M. 1992.A Three-dimensional Environmental Fluid Dynamic Computer Code: Theoretical and Computational Aspects.Gloucester Point: Virginia Institute of Marine Science, The College of William and Mary.
Herb, W. R., and Stefan, H. G. 2005. Dynamics of vertical mixing in a shallow lake with submersed macrophytes.Water Resources Research, 41(2), W02023. [doi:10.1029/2003WR002613]
Hua, Z. L., Gu, L., and Liu, X. D. 2009. Improving water exchange rate of shallow lakes through water diversion works.Water Resource Protection, 25(1), 9-17. (in Chinese)
Ji, Z. G. 2007.Hydrodynamics and Water Quality Modeling: Modeling Rivers, Lakes, and Estuaries. New York: John Wiley & Sons.
Jin, B. X., Fan, Y. Y., Deng, Z. R., Li, X. M., and Ye, S. C. 1980. Investigation of hydrological characteristic of Lake Dong.Journal of Central China Normal University (Natural Sciences), (3), 79-92. (in Chinese)
Jin, K. R., Hamrick, J. H., and Tisdale, T. 2000. Application of three dimensional hydrodynamic model for Lake Okeechobee.Journal of Hydraulic Engineering, 126(10), 758-771. [doi:10.1061/(ASCE)0733-9429 (2000)126:10(758)]
Jin, K. R., and Ji, Z. G. 2004. Case study: Modeling of sediment transport and wind-wave impact in Lake Okeechobee.Journal of Hydraulic Engineering, 130(11), 1055-1067. [doi:10.1061/(ASCE)0733-9429 (2004)130:11(1055)]
Li, Y. P., Pang, Y., Lü, J., Zhang, G., Ding, L., Peng, J. P., Wang, C., and Fan, L. L. 2004. On the relation between the release rate of TN, TP from sediment and water velocity.Journal of Lake Sciences, 16(4),318-324. (in Chinese)
Lu, J. Y., Huang, Y., and Gong, P. 2006. Scouring and silting variation in middle and lower channel of the Yangtze River after TGP.Yangtze River, 37(9), 55-57. (in Chinese)
Madala, R. V., and Piacsek, S. A. 1977. A semi-implicit numerical model for Baroclinic Oceans.Journal of Computational Physics, 23(2), 167-178. [doi:10.1016/0021-9991(77)90119-X]
Mellor, G. L., and Yamada, T. 1982. Development of a turbulence closure model for geophysical fluid problems.Reviews of Geophysics and Space Physics, 20(4), 851-875. [doi:10.1029/RG020i004p00851]
Mellor, G. L., Oey, L. Y., and Ezer, T. 1998. Sigma coordinate pressure gradient errors and the seamount problem.Journal of Atmospheric and Oceanic Technology, 15(5), 1122-1131. [doi:10.1175/1520-0426 (1998)015]
Morin, J., Leclerc, M., Secretan, Y., and Boudreau, P. 2000. Integrated 2D macrophytes-hydrodynamic modeling.Journal of Hydraulic Research, 38(3), 163-172. [doi:10.1080/00221680009498334]
Rosati, A., and Miyakoda, K. 1988. A general circulation model for upper ocean simulation.Journal of Physical Oceanography, 18(11), 1601-1626. [doi:10.1175/1520-0485(1988)]
Rueda, F. J., and Schladow, S. G. 2003. Dynamics of large polymictic lake, II: Numerical simulations.Journal of Hydraulic Engineering, 129(2), 92-101. [doi:10.1061/(ASCE)0733-9429(2003)129:2(92)]
Sheng, Y. P., and Butler, H. L. 1982. Modeling coastal currents and sediment transport.Proceedings of 18th InternationalConference on Coastal Engineering, 1127-1148. New York: ASCE.
Thackeray, S. J., George, D. G., Jones, R. I., and Winfield, I. J. 2004. Quantitative analysis of the importance of wind-induced circulation for the spatial structuring of planktonic populations.Freshwater Biology, 49(9), 1091-1102. [doi:10.1111/j.1365-2427.2004.01252.x]
Tufford, D. L., and McKellar, H. N. 1999. Spatial and temporal hydrodynamic and water quality modeling analysis of a large reservoir on the South Carolina (USA) coastal plain.Ecological Modeling, 114(2-3), 137-173. [doi:10.1016/S0304-3800(98)00122-7]
This work was supported by the Specialized Research Fund for the Doctoral Program of Higher Education (Grant No. 20110142110064) and Huazhong University of Science and Technology Indigenous Innovation Foundation (Grant No. 2010ZZ004-06).
*Corresponding author (e-mail:kling@mail.hust.edu.cn)
Received Apr. 15, 2011; accepted Aug. 20, 2011
 Water Science and Engineering2011年4期
- Water Science and Engineering的其它文章
- Two-dimensional physical habitat modeling of effects of habitat structures on urban stream restoration
- Experimental study on total dissolved gas supersaturation in water
- Sediment transport following water transfer from Yangtze River to Taihu Basin
- Research on shape optimization of CSG dams
- Analysis of black water aggregation in Taihu Lake
- Large eddy simulation of water flow over series of dunes
