
GPC3 fused to an alpha epitope of HBsAg acts as an immune target against hepatocellular carcinoma associated with hepatitis B virus
2011-07-03 12:40:15
Changsha, China
GPC3 fused to an alpha epitope of HBsAg acts as an immune target against hepatocellular carcinoma associated with hepatitis B virus
Jun-Wen Yang, Dong-Ye Yang, Fang-Gen Lu, Cai-Hong Li, Hui Chen, Ning Xie and Xin Zhao
Changsha, China
BACKGROUND: The incidence of hepatocellular carcinoma (HCC) in China is closely related to the population infected with hepatitis B virus (HBV). HCC cells with HBV secrete soluble HBsAg into blood but do not express it on the cell membrane. This study aimed to construct and investigate a new glycosylphosphatidylinositol (GPI)-anchored protein (GPC3+α+EGFP) as a DNA vaccine against HCC associated with HBV.
METHODS: A recombinant plasmid (pcDNA3.1(+)/GPC3+ α+EGFP) was constructed and verified by restriction endonuclease digestion and sequencing. pcDNA3.1(+)/GPC3+α+ EGFP was transfected into HepG2 cells (experimental group) using lipofectamine 2000. pEGFP-N1-transfected HepG2 cells were used as a negative control, and non-transfected HepG2 cells sreved as a blank control. HepG2 cells that steadily expressed the fusion protein GPC3+α+EGFP were screened by G418, propagated, and co-cultured with lymphocytes from healthy donors. Cell proliferation was measured by the classic sulforhodamine B assay. Apoptosis was assessed by terminal deoxynucleotidyl transferase dUTP nick end labeling (TUNEL), and Fas gene transcription was determined by quantitative fluorescent PCR.
RESULTS: The pcDNA3.1(+)/GPC3+α+EGFP plasmid was successfully constructed. In the experimental group, green fluorescence was observed at the cell periphery and in the cytoplasm, whereas in the negative control group, fluorescence was evenly distributed throughout the cell. Proliferation of the experimental group significantly decreased after 72 hours compared to the negative and blank control groups. Furthermore, the number of apoptotic cells was statistically different among the three groups as determined by a contingency table Chi-square test; the experimental group had the highest incidence of apoptosis. Fas gene transcription in the experimental group was higher than in the two control groups, and an increasing trend with time in the experimental group was observed.
CONCLUSION: A chimeric, membrane-anchored protein, GPC3+α+EGFP, localized to the membrane of HepG2 cells and inhibited proliferation and accelerated apoptosis through a Fas-FasL pathway after co-cultivation with lymphocytes.
(Hepatobiliary Pancreat Dis Int 2011; 10: 164-170)
HBsAg-α epitope; glypican 3; hepatocellular carcinoma; hepatitis B virus; protein engineering
Introduction
Immune therapy for hepatocellular carcinoma (HCC) is an important area of research. Based on many experimental studies, a variety of vaccines for treating HCC have proven to be effective.[1-7]However, HCC cells are able to evade the surveillance and defense mechanisms of the immune system because of their low immunogenicity.
The incidence of HCC in China is closely related to the population infected with hepatitis B virus (HBV). Epidemiological data show that the geographic distribution of HCC correlates with HBV infection. About 80% of patients with HCC are positive for HBV surface antigen (HBsAg).[8]The "α" determinant of HBsAg is a strong epitope that can activate the human immune system to produce neutralizing antibodies.[9]Yang et al[10]used HBsAg as a vaccine to activate dendritic cells to produce an anti-tumor immune response. Although HCC cells with HBV secrete soluble HBsAg into the bloodstream, HBsAg does not anchor and localize to the cell membrane; therefore, it cannot directly induce the destruction of HCC cells. In this study, we used protein engineering to increase theimmunogenicity of HepG2 cells by fusing the glycosylphosphatidylinositol (GPI)-anchored protein glypican3 (GPC3) with the HBsAg-α epitope to construct a new plasma membrane-anchored protein, GPC3+α+EGFP.
Methods
Materials
The recombinant plasmid pcDNA3.1(+)/GPC3+EGFP was previously constructed in our laboratory; pEGFP-N1,E. coliJM106, and HepG2 cells were provided by the State Key Laboratory of Medical Genetics of China; T4 DNA ligase and reverse transcription kits were from Fermentas Inc.; NheI, EcoRI, and KpnI restriction enzymes were from BioLabs Inc.; the PCR product recycling kit was from Bio Basic. The gel recycling kit and sulforhodamine B (SRB) were from Shanghai Biological Engineering Co. Ltd. The plasmid extraction kit was from Machery-Nagel Inc. Pfu DNA polymerase was from Tiangen. DNA oligonucleotide and PCR primers were synthesized by Takara Bio. Plasmid DNA was sequenced, and quantitative PCR primers were synthesized, by Shanghai Biological Engineering Co. Ltd. G418 was from Calbiochem. Lipofectamine 2000 was from Invitrogen Corp. Histopaque-1077 and Trizol were from Sigma. The fluorescence quantitative PCR kit was from Takara Bio Co. The TUNEL apoptosis detection kit (coloration) was from the Beyotime Institute of Biotechnology.
Construction of pcDNA3.1(+)/GPC3+α+EGFP
DNA oligonucleotides containing the N-terminus of GPC3 fused to the HBsAg-α epitope were chemically synthesized, and the appropriate restriction sites were added by PCR amplification (primers in Table 1). After purification, both the PCR products and pcDNA3.1(+)/ GPC3+EGFP were digested by the restriction enzymes NheI and KpnI. The restriction enzyme digestion products were then ligated by T4 DNA ligase to yieldthe final pcDNA3.1(+)/GPC3+α+EGFP plasmid. The plasmid was verified by restriction enzyme digestion by NheI and EcoRI and DNA sequencing.
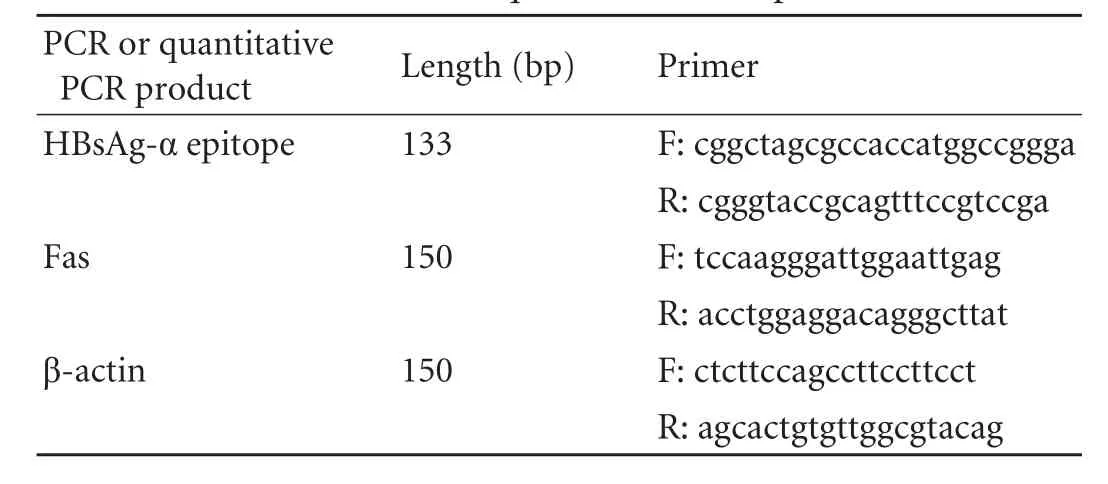
Table 1. PCR and quantitative PCR primers
Screening of stable cells for expression of fusion protein GPC3+α+EGFP (HepG2/GPC3+α+EGFP)
pcDNA3.1(+)/GPC3+α+EGFP was transfected into HepG2 cells (experimental group) using pEGFP-N1 transfection as a negative control group according to the manufacturer's manual. The transfection efficiency was calculated by counting the fluorescence-positive cells per 100 HepG2 cells. Both groups of transfected HepG2 cells were grown in selective DMEM containing 800 µg/ml G418. Most of the non-transfected HepG2 cells in these groups died, whereas G418-resistant colonies appeared after 14 days of cultivation. The required monoclonal cells were cultured for one week to establish a steadily transfected pcDNA3.1(+)/GPC3+α+EGFP or pEGFP-N1 cell line under the selective pressure of 800 µg/ml G418 in DMEM. Portions of the monoclonal cells were stored in liquid nitrogen, whereas the rest were used in subsequent experiments.
Lymphocyte cytotoxicity test (proliferation curves and TUNEL assay)
Lymphocytes were extracted from the anticoagulated peripheral blood of healthy donors by Histopaque-1077 and adjusted to the appropriate concentration. Both groups of transfected HepG2 cells (experimental and negative control groups) were co-cultured with lymphocytes in 96-well plates using non-transfected HepG2 cells as a blank control group. One thousand transfected HepG2 cells were seeded in each well with 50 000 lymphocytes (ratio, 1∶50). At 0, 24, 48, and 72 hours after co-cultivation, cells from each group were collected and assayed by SRB.[11]The optical density (OD) values at 490 nm were measured, and proliferation curves were generated using the mean values.
After sterilization, coverslips were placed on the bottom of 24-well plates. About 5000 cells from each group were injected into each well and cultured for 4-6 hours to allow the cells to adhere to the coverslips. Lymphocytes were then added to each well at a ratio of 50∶1. After 72 hours of co-cultivation, the cells that had adhered to the coverslips were fixed and stained according to the instructions with the TUNEL kit. Apoptotic cells of each group were counted and statistically analyzed.
Real-time PCR for quantitative analysis of mRNA expression of the Fas gene
RNA was extracted from cells of the above three groups at 0, 24, 48, and 72 hours after co-cultivation with lymphocytes (three wells for each sample). Reverse transcription was carried out at 42 ℃ for 60 minutes followed by 5 minutes at 70 ℃. cDNA templates were diluted 10-fold for the next step. For quantitative fluorescent PCR (primers in Table 1), the reaction system contained the following components: SYBR (2×, 5 µl), forward primer and reverse primer (0.2 µl), Rox reference dye (50×, 0.2 µl), sterile water (3.4 µl), and cDNA template (1.0 µl). The quantitative PCR mixture of Fas was amplified with an ABI PRISM7900H sequence detection system using the housekeeping gene β-actin as a control. The standard amplification curves of Fas and β-actin primers were generated according to the cycles of threshold (CT) from cDNA samples of a 5-fold serial dilution; the slopes of these curves determine whether the two pairs of primers have similar amplification efficiency. Finally, the samples were amplified with the two pairs of primers, and the CTvalues were determined.
Results
Restriction enzyme digestion and sequencing of pcDNA3.1(+)/GPC3+α+EGFP
Based on the plasmid construction, the NheI restriction site was located upstream of the N-terminus of GPC3, and the EcoRI restriction site was located downstream of EGFP. Separation of the digestion reaction on an agarose gel by electrophoresis revealed a band of 850bp (Fig. 1). The plasmid was sequenced and determined to be correct.
EGFP expression and transfection efficiency
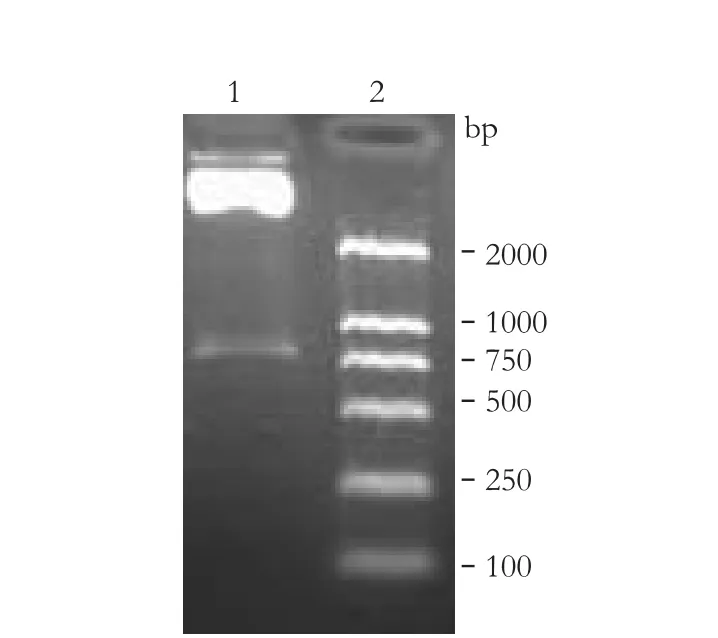
Fig. 1. Restriction enzyme digestion. 1: pcDNA3.1(+)/GPC3+α+ EGFP digested by NheI and EcoRI, the band is about 850bp; 2: DNA marker.
HepG2 cells were observed under a fluorescence microscope at 24 hours after transfection with either pcDNA3.1(+)/GPC3+α+EGFP or pEGFP-N1. The experimental group (HepG2/pcDNA3.1(+)/GPC3+α+EGFP) had bright fluorescence around the periphery of the cells, and the transfection efficiency was about 30%. On the other hand, the negative control group (HepG2/pEGFP-N1) had bright fluorescence distributed throughout the cell, and the transfection efficiency was about 45% (Fig. 2). Monoclonal transfected cells of the two groups were screened out and propagated (Fig. 3).
Proliferation curves and TUNEL assay

Fig. 2. A, B: In the experimental group, fluorescence is distributed around the cell periphery (original magnification ×400); C, D: In the negative control group, fluorescence is scattered in the cytoplasm and nucleus (original magnification ×400).
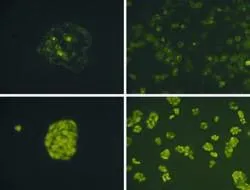
Fig. 3. Cell monoclone and its propagated cultivation (original magnification ×400). A, B: the experimental group; C, D: the negative control group.
The OD was measured at 490 nm in the SRB assay. The growth curves were generated based on the averagevalues of the 4 samples. TheFvalue was 3.046 (P=0.006) indicating an uneven of the total variance.Fwas 41.614 (P<0.01) among the different groups through univariate analysis of variance using SPSS 11.5.Pwas 0.009 between the blank control group and the experimental group, andPwas 0.03 between the negative control group and the experimental group using Tamhane's T2 method (Table 2, Fig. 4).
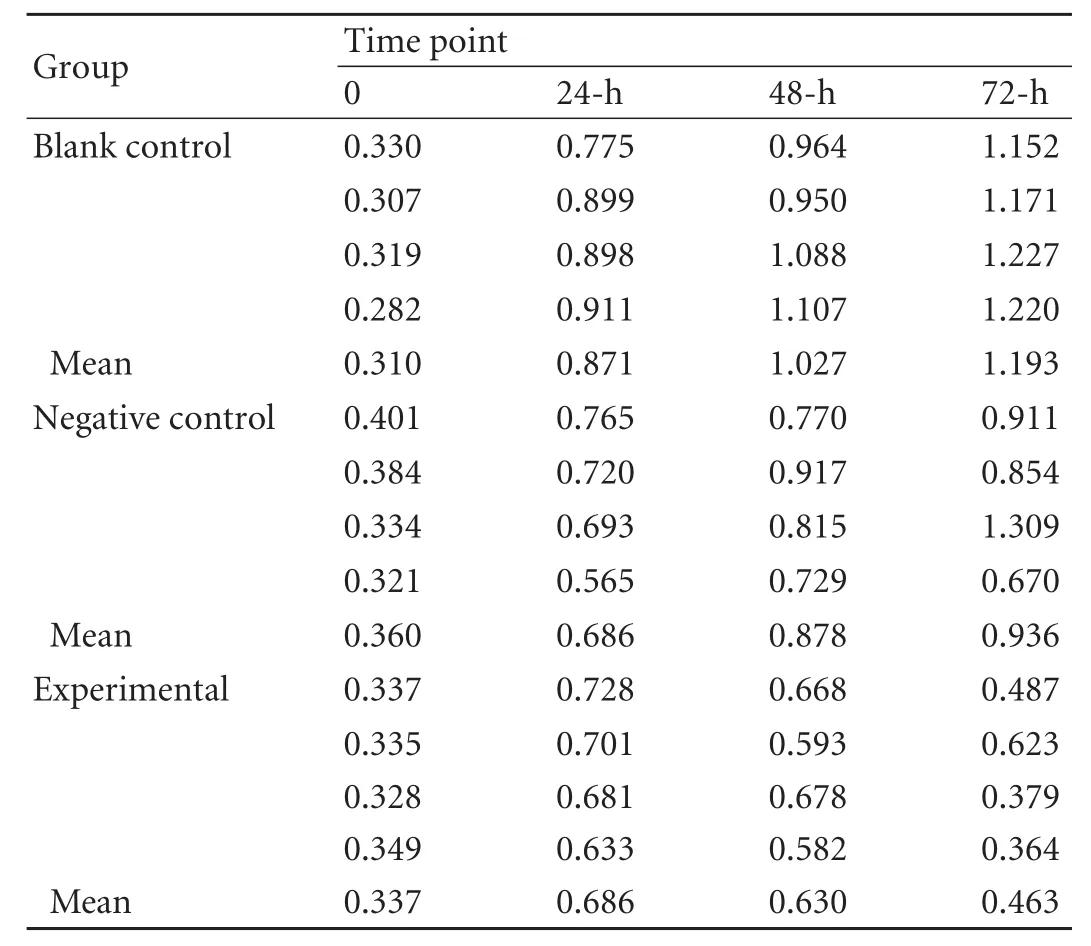
Table 2. OD values at 490 nm in the three groups by SRB assay
Apoptosis-positive cells stained yellow in the TUNEL assay. The number of apoptosis-positive cells in the blank control, negative control, and experimental groups was 34, 61, and 127 per 1000 cells, respectively. The Pearson Chi-square value was 66.809 (P<0.01), determined by the contingency table Chi-square test using SPSS 11.5. The numbers of positive cells among the three groups were significantly different. Moreover, the experimental group had the highest incidence of apoptosis (Fig. 5).
Fluorescence quantitative PCR

Fig. 4. Proliferation curves of the blank control, negative control, and experimental groups.

Table 3. CTand ΔCTvalues in the three groups
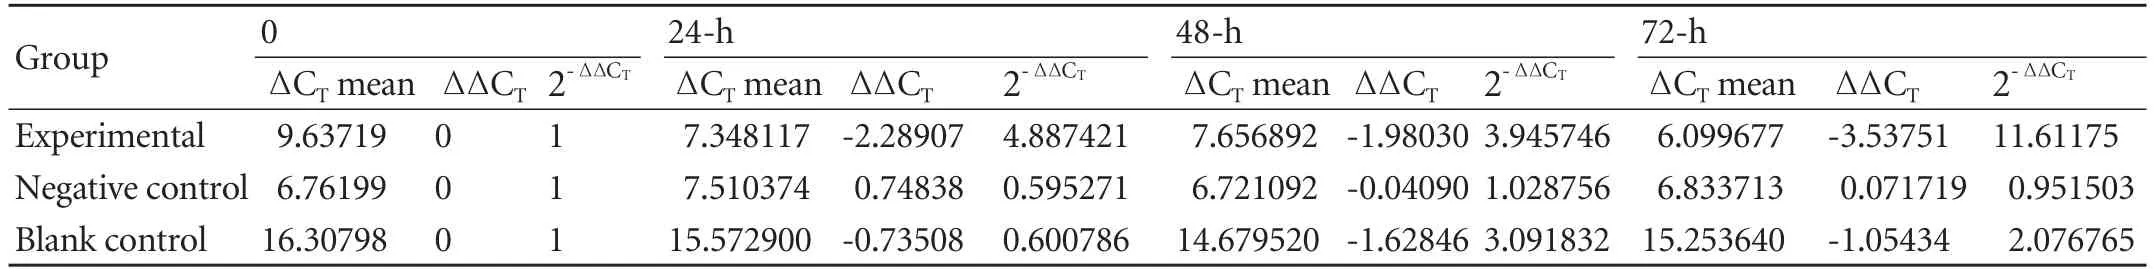
Table 4. Relative quantity of Fas gene transcription in the three groups

Fig. 5. Cells co-cultured with lymphocytes after 72 hours (original magnification ×400). A: the blank control group, few apoptotic cells; B: the negative control group, some apoptotic cells; C: the experimental group, many apoptotic cells.

Fig. 6. Standard amplification curves of β-actin (A) and Fas (B). Dissociation curves of β-actin (C) and Fas (D).
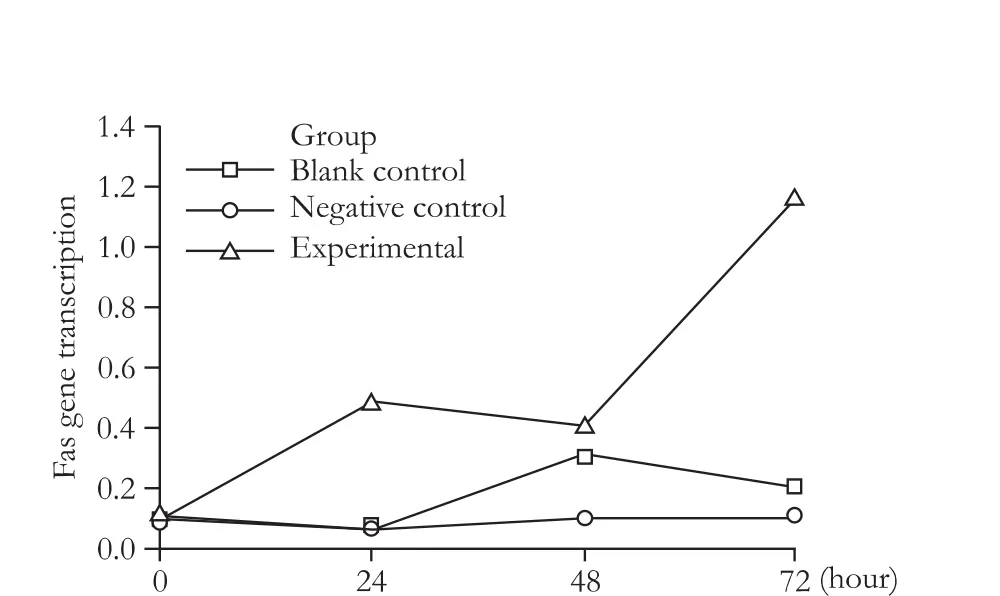
Fig. 7. Relative quantity of Fas gene transcription at different time points.
The slope of the amplification curve of Fas was -3.078, and the correlation coefficient was 0.993, whereas the slope of the amplification curve of β-actin was -3.072, and the correlation coefficient was 0.994, which indicates that the two pairs of primers had similar amplification efficiency. Furthermore, the dissociation curves of both β-actin and Fas had a single peak, indicating that the two pairs of primers were specifically amplified. TheFvalue was 1.546 (P=0.180) in the homogeneity analysis of variance for the ΔCTvalues of each group, indicating that the total variance was even.Fwas 1889.410 among the three groups (P<0.01). Fas gene transcription in the experimental group was significantly higher than in the two control groups using the Bonferroni method (Tables 3, 4 and Figs. 6, 7).
Discussion
Low immunogenicity is one of the reasons why HCC cells with HBV evade immune surveillance and defense mechanisms. One strategy of immune gene therapy against HCC is to increase HCC cell immunogenicity. Exogenous antigen components can be expressed on the HCC cell surface through genetic and protein engineering methods to strengthen the anti-tumor immune effects.
GPC3 is both a new serum marker of HCC and a type of GPI membrane anchor protein.[12,13]An "anchor protein" is a membrane protein that embeds a hydrophobic signal sequence in the lipid bilayer membrane, thus anchoring one end of the protein in the cell membrane.[14]Using protein engineering techniques, the 3' end of the cDNA of a gene can be replaced by that of GPI, thereby creating a new GPI-anchored protein.[15]In recent years, the progressive development of protein engineering technology has been applied to tumor vaccines and gene therapy. For example, GPI fused to B7.1 induces protective immunity in mice and activates anti-tumor T-cell proliferationin vitro.[16]The N-terminus of GPC3 has a secretion signal, whereas the C-terminus has an anchoring signal.[17,18]In a previous study,[19]we confirmed that the exogenousepitope hAFP542-550 fuses to the anchoring region of GPC3 localized to the cell membrane in HepG2 cells. In the current study, the HBsAg-α epitope was used as an exogenous epitope fused to GPC3. The HBsAg-α epitope consists of residues 124 to 147 of the full-length protein and forms two hydrophilic rings, of which the structure of the second loop (loop 2, amino acids 139-147) is extremely conserved.[9]The HBsAg-α epitope was inserted between the N-terminal secretion signal (1-28 aa) of GPC3 and the C-terminal anchoring region (29-580 aa). An eukaryotic expression plasmid containing EGFP as a tracer agent, pcDNA3.1(+)/GPC3+α+EGFP, was successfully constructed. Green fluorescence was observed in the cytoplasm of HepG2 cells 8 hours after transfection with pcDNA3.1(+)/GPC3+α+EGFP and moved to the membrane after 24 hours, which might be related to the protein synthesis pathway.[19]
Several studies have demonstrated that the HBsAg-α epitope activates specific cytotoxic T lymphocytes to attack hepatocytes infected with HBV.[20-25]Yang et al[26]replaced the CLIP fragment of CD74 with the HBsAg-α epitope and transfected it into dendritic cells using adenovirus vectorsin vitro. These modified dendritic cells induce the destruction of HepG2 cells by T lymphocytes. In this study, the antigen peptide HBsAg-α was anchored to the membrane of HepG2 cells by GPC3 and was detected on the surface of the transfected cells. When the cells were co-cultured with lymphocytes, they became immunogenic, and strongly activated lymphocytes. The anti-tumor immune response was detected by SRB and TUNEL assays. The proliferation rate of the experimental group decreased after 72 hours compared to the negative and blank control groups. The number of apoptotic cells was statistically different among these three groups. The incidence of apoptosis in the experimental group was significantly higher than that in the two control groups. It has been demonstrated that GPC3 is a target for immune attack by T lymphocytes.[27]Nakano et al[28,29]produced an anti-GPC3 monoclonal antibody that recognizes the C-terminus of GPC3 and causes antibody-dependent cytotoxicity and complement-dependent cytotoxicity. GPC3 expression on HepG2 cell membranes might, to some extent, induce an anti-tumor immune response by itself. In this study, the HBsAg-α epitope could be the main target for immune attack. Further evidence is needed to show whether the effects observed in this study are caused by both GPC3 and HBsAg-α. To investigate this possibility, we could transfect pGPC3 into HepG2 cells as a control.
In general, the anti-tumor immune mechanism is complex and is associated with cellular immunity. T lymphocytes play an important role in mediating antitumor effects, which may activate caspases through the classic and important apoptotic signal transduction pathways, such as Fas-FasL. The Fas receptor is the key apoptotic regulator in the anti-tumor immune response. In fact, mRNA expression of apoptotic factors such as caspase 3 have few effects on apoptosis, whereas mRNA expression of the death receptor Fas has a significant effect on apoptosis and is consistent with the incidence of apoptosis.[30]In this study, we detected the mRNA transcription of the Fas gene by quantitative fluorescent PCR at different time points after transfection and found an increase in mRNA expression in the experimental group. mRNA overexpression of the Fas gene in the experimental group was correlated with a higher incidence of apoptosis compared to the two control groups after 72 hours.
In conclusion, chimeric GPC3+α+EGFP-anchored protein localizes to the membrane of HepG2 cells, inhibits HepG2 cell proliferation, and accelerates apoptosis through the Fas-FasL pathway after co-cultivation with lymphocytes.
Funding: This study was supported by grants from the Natural Science Foundation of China (30500239) and the China Postdoctoral Science Foundation (20060400227).
Ethical approval: This study was approved by the Medical Ethics Committee of the Second Xiangya Hospital of Central South University.
Contributors: YJW proposed the study and wrote the first draft. YDY analyzed the data. All authors contributed to design and interpretation of the study and to further drafts. LFG is the guarantor.
Competing interest: No benefits in any form have been received or will be received from a commercial party related directly or indirectly to the subject of this article.
1 Ge NL, Ye SL, Zheng N, Sun RX, Liu YK, Tang ZY. Prevention of hepatocellular carcinoma in mice by IL-2 and B7-1 genes co-transfected liver cancer cell vaccines. World J Gastroenterol 2003;9:2182-2185.
2 Greten TF, Forner A, Korangy F, N'Kontchou G, Barget N, Ayuso C, et al. A phase II open label trial evaluating safety and efficacy of a telomerase peptide vaccination in patients with advanced hepatocellular carcinoma. BMC Cancer 2010; 10:209.
3 Shibolet O, Alper R, Zlotogarov L, Thalenfeld B, Engelhardt D, Rabbani E, et al. NKT and CD8 lymphocytes mediate suppression of hepatocellular carcinoma growth via tumor antigen-pulsed dendritic cells. Int J Cancer 2003;106:236-243.
4 Yang JY, Cao DY, Ma LY, Liu WC. Dendritic cells fused with allogeneic hepatocellular carcinoma cell line compared with fused autologous tumor cells as hepatocellular carcinoma vaccines. Hepatol Res 2010;40:505-513.
5 Boozari B, Mundt B, Woller N, Strüver N, Gürlevik E, Schache P, et al. Antitumoural immunity by virus-mediated immunogenic apoptosis inhibits metastatic growth of hepatocellular carcinoma. Gut 2010;59:1416-1426.
6 Plymoth A, Viviani S, Hainaut P. Control of hepatocellular carcinoma through hepatitis B vaccination in areas of high endemicity: perspectives for global liver cancer prevention. Cancer Lett 2009;286:15-21.
7 Maggard M, Meng L, Ke B, Allen R, Devgan L, Imagawa DK. Antisense TGF-beta2 immunotherapy for hepatocellular carcinoma: treatment in a rat tumor model. Ann Surg Oncol 2001;8:32-37.
8 Li Y, Ma J, ed, Molecular targeted cancer therapy. Beijing: People's Medical Publishing House; 2007:300-301.
9 Waters JA, Brown SE, Steward MW, Howard CR, Thomas HC. Analysis of the antigenic epitopes of hepatitis B surface antigen involved in the induction of a protective antibody response. Virus Res 1992;22:1-12.
10 Yang JY, Ren J, Bai J, Liu DH, Fan L, Si XM, et al. Cytotoxicity induced by HBsAg gene modified-dendritic cells against hepatocellular carcinoma cell HepG2.2.15. Ai Zheng 2004;23: 914-917.
11 Thabrew MI, Mitry RR, Morsy MA, Hughes RD. Cytotoxic effects of a decoction of Nigella sativa, Hemidesmus indicus and Smilax glabra on human hepatoma HepG2 cells. Life Sci 2005;77:1319-1330.
12 Yuen MF, Lai CL. Serological markers of liver cancer. Best Pract Res Clin Gastroenterol 2005;19:91-99.
13 Jain S, Singhal S, Lee P, Xu R. Molecular genetics of hepatocellular neoplasia. Am J Transl Res 2010;2:105-118.
14 Brown O, Cowen RL, Preston CM, Castro MG, Lowenstein PR. Subcellular post-transcriptional targeting: delivery of an intracellular protein to the extracellular leaflet of the plasma membrane using a glycosyl-phosphatidylinositol (GPI) membrane anchor in neurons and polarised epithelial cells. Gene Ther 2000;7:1947-1953.
15 Maruyama M, Yoshitake H, Tsukamoto H, Takamori K, Araki Y. Molecular expression of Ly6k, a putative glycosylphosphatidyl-inositol-anchored membrane protein on the mouse testicular germ cells. Biochem Biophys Res Commun 2010;402:75-81.
16 Yi P, Yu H, Ma W, Wang Q, Minev BR. Preparation of murine B7.1-glycosylphosphatidylinositol and transmembraneanchored staphylococcal enterotoxin. A dual-anchored tumor cell vaccine and its antitumor effect. Cancer 2005;103:1519-1528.
17 Nakatsura T, Yoshitake Y, Senju S, Monji M, Komori H, Motomura Y, et al. Glypican-3, overexpressed specifically in human hepatocellular carcinoma, is a novel tumor marker. Biochem Biophys Res Commun 2003;306:16-25.
18 Yasuda E, Kumada T, Toyoda H, Kaneoka Y, Maeda A, Okuda S, et al. Evaluation for clinical utility of GPC3, measured by a commercially available ELISA kit with Glypican-3 (GPC3) antibody, as a serological and histological marker for hepatocellular carcinoma. Hepatol Res 2010;40:477-485.
19 Yang DY, Li CH, Lan F, Zhang YQ, Lu FG, Yang ZR, et al. Expression and localization of strong epitope hAFP(542-550); on eukaryotic cytoplasmic membrane. Xi Bao Yu Fen Zi Mian Yi Xue Za Zhi 2009;25:592-595, 599.
20 Nakamura Y, Suda T, Nagata T, Aoshi T, Uchijima M, Yoshida A, et al. Induction of protective immunity to Listeria monocytogenes with dendritic cells retrovirally transduced with a cytotoxic T lymphocyte epitope minigene. Infect Immun 2003;71:1748-1754.
21 Akbar SM, Yoshida O, Chen S, Cesar AJ, Abe M, Matsuura B, et al. Immune modulator and antiviral potential of dendritic cells pulsed with both hepatitis B surface antigen and core antigen for treating chronic HBV infection. Antivir Ther 2010;15:887-895.
22 Qiu SJ, Lu L, Qiao C, Wang L, Wang Z, Xiao X, et al. Induction of tumor immunity and cytotoxic t lymphocyte responses using dendritic cells transduced by adenoviral vectors encoding HBsAg: comparison to protein immunization. J Cancer Res Clin Oncol 2005;131:429-438.
23 Büchler T, Hajek R. Dendritic cell vaccines in the treatment of multiple myeloma: advances and limitations. Med Oncol 2002;19:213-218.
24 Carotenuto P, Artsen A, Niesters HG, Osterhaus AD, Pontesilli O. In vitro use of autologous dendritic cells improves detection of T cell responses to hepatitis B virus (HBV) antigens. J Med Virol 2009;81:332-339.
25 Mosca PJ, Clay TM, Kim Lyerly H, Morse MA. Current status of dendritic cell immunotherapy of malignancies. Int Rev Immunol 2003;22:255-281.
26 Yang JY, Cao DY, Liu WC, Fan L, Si XM, Teng ZH, et al. Biological characteristics of adenovirus-mediated HBsAg gene-modified dendritic cells in vitro. Chin J Cancer Biother 2006;13:286-289.
27 Takai H, Ashihara M, Ishiguro T, Terashima H, Watanabe T, Kato A, et al. Involvement of glypican-3 in the recruitment of M2-polarized tumor-associated macrophages in hepatocellular carcinoma. Cancer Biol Ther 2009;8:2329-2338.
28 Nakano K, Orita T, Nezu J, Yoshino T, Ohizumi I, Sugimoto M, et al. Anti-glypican 3 antibodies cause ADCC against human hepatocellular carcinoma cells. Biochem Biophys Res Commun 2009;378:279-284.
29 Nakano K, Ishiguro T, Konishi H, Tanaka M, Sugimoto M, Sugo I, et al. Generation of a humanized anti-glypican 3 antibody by CDR grafting and stability optimization. Anticancer Drugs 2010;21:907-916.
30 Nabipour I, Kalantarhormozi M, Assadi M, Jafari SM, Gharibi M, Ahmadi E, et al. Influence of levothyroxine treatment on serum levels of soluble Fas (CD95) and Fas Ligand (CD95L) in chronic autoimmune hypothyroidism. Endocrine 2010;38:406-411.
Received June 15, 2010
Accepted after revision December 11, 2010
Author Affiliations: Department of Digestive Diseases, Second Xiangya Hospital, Central South University, Changsha 410011, China (Yang JW, Yang DY, Lu FG, Li CH, Chen H, Xie N and Zhao X)
Dong-Ye Yang, MD, PhD, Department of Digestive Diseases, Second Xiangya Hospital, Central South University, Changsha 410011, China (Tel: 86-731-85295035; Email: dongyeyang@yahoo.com.cn)
© 2011, Hepatobiliary Pancreat Dis Int. All rights reserved.
 Hepatobiliary & Pancreatic Diseases International2011年2期
- Hepatobiliary & Pancreatic Diseases International的其它文章
- Cholangiocarcinoma accompanied by desmoid-type fibromatosis
- Outcomes of loco-regional therapy for down-staging of hepatocellular carcinoma prior to liver transplantation
- Usefulness of an algorithm for endoscopic retrieval of proximally migrated 5Fr and 7Fr pancreatic stents
- Kupffer cells contribute to concanavalin A-induced hepatic injury through a Th1 but not Th17 type response-dependent pathway in mice
- Is the pancreas affected in patients with septic shock?
-- a prospective study - Expression of HLA-G in patients with hepatocellular carcinoma