
Enhanced Cell-Edge Performance with Transmit Power-Shaping and Multipoint,Multiflow Techniques
2011-06-19 11:09PhilipPietraskiGreggCharltonRuiYangandCarlWang
ZTE Communications 2011年4期
Philip Pietraski,Gregg Charlton,RuiYang,and Carl Wang
(InterDigital Communications,LLC.,King Of Prussia,PA19406,U.S.A.)
Abstract:In this paper,we present a technique called“fuzzy cells”that builds on the multicarrier features of Long Term Evolution-Advanced(LTE-A)and high-speed packet access(HSPA).Multiple carriers are aggregated to create a larger system bandwidth,and these carriers are transmitted at different powers by each sector antenna.This creates a set of cell-edge locations that differ from one frequency to the next.System-level simulations are performed to estimate individual user and average throughput for a hexagonaldeployment of 3-sector base stations.For moderately high loads,a fuzzy cell deployment can improve tenth percentile(cell-edge)user throughput by 100%and can improve average throughput by about 30%compared with a reuse 1 scheme.Fuzzy cells reduce inter-cellinterference in the same way as higher-order reuse schemes and allow users to access the full system bandwidth.
Keyw ords:LTE;fractional frequency reuse;multicarrier;flow aggregation;system simulation
1 Introduction
I n current and evolving cellular systems(LTEis the example in this paper)[1],it is generally very difficult to create a uniform user experience because throughput at the cell edge is limited by interference from other cells.In standard frequency reuse 1,the cell-edge downlink(DL)signal to interference plus noise ratio(SINR)can be less than 0 d B,which limits user throughput even if there is a large number of resource blocks(RBs)for UEs.The cell-edge problem is shown in Fig.1.
For UEs close to an E-UTRAN Node B(eNB),the DL SINR is quite high.However,as the UEmoves away from the eNB,the DLSINRdecreases until the UEis midway between the eNBs(at the cell edge).A handover(HO)then occurs;the UEpasses to the next eNB,and SINRstarts to increase again.SINRis lowest near the cell edge.In a typical two-dimensional hexagonal deployment,this cell-edge condition affects much of the deployment area.In an OFDM system,such as LTERelease 8,the cell-edge problem can be mitigated to some extent by organizing UEs into groups according to different parts of the spectrum and using different transmit powers for these groups.
Cell-edge UEs are grouped logically.They are assigned a specific part of the spectrum and are allocated a potentially higher power,as in soft frequency reuse(SFR),or higher frequency reuse transmission,as in fractional frequency reuse(FFR).Although the data signal received by cell-edge UEs may be improved,this approach has limitations.Take,for example,the cell coverage and control channel.The control channel spans the system bandwidth and is shared among UEs.Thus,the same extended range that a frequency selective,UE-specific data channel might attain is not possible for UEs at the cell edge.
More importantly,some UEs will not have access to the full system bandwidth.In the FFRcase shown in Fig.2,the spectrum is split into two parts:reuse 3 and reuse 1.Some of the UEs are classified as cell edge,and others are classified as cell center.The classification determines which parts of the spectrum are available to the UEs.The details depend on the particular FFRscheme,but the cell-edge UEs are expected to have improved SINRin the red,blue,or green frequency areas.Improved SINRcomes at the price of reduced accessible bandwidth for UEs.

▲Figure 1.Celledge in a one-dimensional deployment.
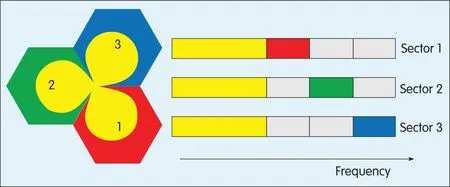
◀Figure 2.FFRspectrum distribution.
In LTERelease 10,carrier aggregation(CA)of component carriers(CC)allows spectrum to be aggregated.Each CC has a bandwidth that is compatible with Release 8,but UEs can attach to and be scheduled on multiple CCs.Each of these CCs can be considered a cell of its own with a different carrier frequency and,potentially,different coverage areas.Differences in coverage may occur as a result of differences in propagation conditions;however,system transmit power,HO thresholds(for example,cell biasing),and even sector antenna direction can be changed to modify the DL coverage.This solves the control channel problem;the power of the control channel can be adjusted for each CC,thus enabling SFR.However,the problem remains that UEs cannot access the full system bandwidth.
The cell-edge problem in Fig.1 has also been approached from the perspective of intercell interference(ICI)and ICImitigation using coordinated base stations[2].Adjacent cooperative base station clusters can generate different interference levels in different frequency subchannels by optimizing power allocation to those subchannels.In this way,SINRnear the cluster edge can be improved without the need for fast coordination between the clusters.In[3],this approach was analyzed in a one-dimensional space,and power allocation was optimized based on an SINRbalancing condition at fixed locations in the cluster.
Therefore,power allocation depended only on the system’s geometry,and the effects of adjusting the transmit power on cell loading were not taken into account.The fuzzy cells technique relies on system capabilities that enable transmitting multiple powers on different carriers and transmitting data to UEs from different base stations on different CCs.
2 Fuzzy Cells
2.1 Definitions
Sector antenna:an antenna that provides coverage to an area in one or more of the CC frequencies that make up the system bandwidth.In the examples discussed herein,sector antennas support either three or six CC frequencies.
Site:a collection of co-located sector antennas.Each site is composed of three sector antennas,and all sector antennas at a site are part of the same eNB.
Hexagon:a geographical area defined by site locations only.A hexagon is defined by geometry and is not affected by transmit antenna power and shadowing.
CCfrequency:a frequency band carrying the data and control signals of a particular CC.The sum of all the CC frequencies is the total system bandwidth.
CC:is a component carrier in an aggregation of carriers.This comprises the CC frequency and sector antenna.Its coverage area is determined by UE-CC selection rules and parameters,for example,transmit power and cell bias.It is close to the usual definition of a cellor sector.
Cell edge UEs:the set of UEs in which throughput levels are at most those represented by the tenth percentile of UEthroughputs.
UEperceived throughput:the number of bits downloaded by a UE divided by the time that the UEhas data in its buffer to be transmitted.
2.2 Fuzzy Cell Concept
The key to fuzzy cells is enabling a UEto connect to the best CC in each CC frequency regardless of the site in which the CC originates.Enabling the UEto connect in this way allows a UEto access the full system bandwidth when SFR-type power allocation is used.
Then,a good SINRcan be achieved in each CC frequency within the system bandwidth.Multisite connection is shown in Fig.3.As the UEcrosses the cell boundary in a given CC frequency,it drops that CC and picks up a new CC from a different site in the same CC frequency.In this way,the UEalways has access to full system bandwidth even midway between sites.The cell edge is blurred,creating the concept of a“fuzzy”cell.The resulting cell-edge performance is enhanced,and this improvement can be measured in terms of equivalent SINR(eSINR).
Equivalent SINRis the SINRneeded to maintain the same throughput over the entire system bandwidth(assuming the same SINRis observed over the entire system bandwidth).To calculateeSINR,first,the SINRfor the UEin each CC with which it is associated is determined.The SINRfor each of these CCs is then mapped into an achievable throughput using the Shannon Capacity formula.The achievable throughput in each CC is summed,and the result is mapped back into the eSINR,given by

Figure 3.▶Cell-edge improvementin one-dimensionalfuzzy cell.

◀Figure 4.eSINRfor two isolated base stations.
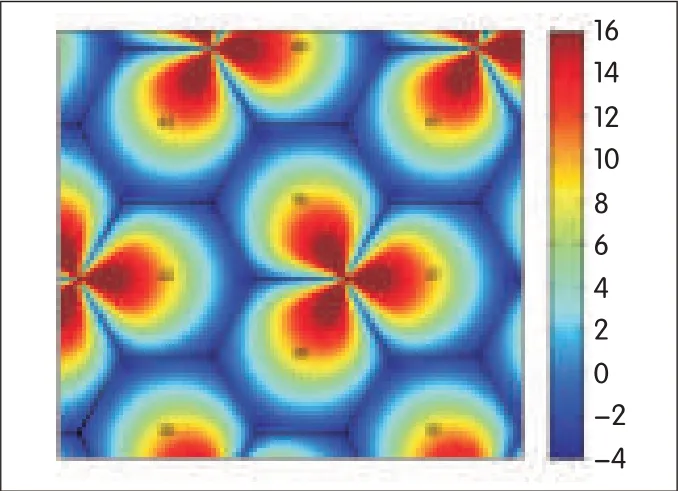
▲Figure 5.Two-dimensionalcolor map of SINRfor reuse 1 baseline.

where n is the index of the CC,N is the number of CCfrequencies,and SINR n is the SINRof the UEin CC frequency n.Fig.4 shows SINRand eSINRin the case of two isolated base stations,each with two CCs transmitted with a power difference of 12 d B.
The red and green curves represent SINRfor CC frequency 1 and CC frequency 2,respectively.The black curve is the eSINRwhen the transmit powers of both frequencies and base stations are identical.The blue curve is the improved eSINRresulting from different transmit powers at the base stations.Cell-edge eSINRis improved by multisite connections and different coverage areas for the two CC frequencies.
2.3 Fuzzy Cell SINR in a Two-Dimensional Deployment
Fig.5 shows a two-dimensional plot of SINRfor a typical hexagonal site with three sectors per site.With reuse 1,each cell has a coverage area that approximates the shape of a hexagon.Assuming the eNBtransmit powers are sufficiently large to limit system interference,the worst possible SINRis less than-4 d Bwithout shadowing(Fig.5).With shadowing,the SINRmay be even lower.This scenario is used as a baseline case.
2.4 eSINR in a Fuzzy Cell Deployment
Unlike the cellboundaries in the reuse 1 baseline(Fig.5),cell boundaries in a fuzzy cell deployment are no longer hexagonal(Fig.6).In the first CC frequency,applying higher transmit powers from some sectors creates larger cells.In another CC frequency,the same phenomenon occurs,but the pattern is rotated.If at least three CC frequencies are used,three sets of cell boundary locations are created so that no UEis simultaneously in the cell-edge region for every CC.The cell boundaries are moved by changing the transmit power and by moving from one CC frequency to the next.In Fig.6,ΔP between high and low power transmitters is 12 d B.The magenta contours delineate where SINR=0 d B and are an estimate of the cell boundaries.
In Fig.7,the eSINRof the fuzzy cell deployment is shown alongside that of the baseline.Although the maximum eSINRis lower in the fuzzy cells than in the baseline,there is no place in the fuzzy cells where eSINRdrops below 0.
This shows that fuzzy cellconfiguration better services cell-edge users.The cumulative distribution functions(CDFs)for eSINRin fuzzy cells and baseline(Fig.8)show that eSINRat the 10th percentile is improved by approximately 4 d B when using a fuzzy cell configuration.
2.5 UE-CC Association Strategy
Every UEcan be associated with the sector antenna in each frequency that provides the best biased SINR.Biasing artificially extends the coverage area of small cells or is used for load balancing.With a small bias,ICIis limited because the cell boundary is only slightly extended.However,more users are associated with CCs transmitted at high power,and this decreases the resources available to each user in those CCs.Conversely,a large bias better balances the resources available to each user at the expense of smaller SINRimprovement.A tradeoff is necessary to obtain the best combination of cell-edge and overall average throughput.Ideally,cell-edge throughput is significantly improved at the cost of a modest reduction in overallthroughput.However,for cells that are realistically loaded,it is possible to improve both cell-edge and average throughput.The CCs providing the largest-biased SINRs in each frequency are assigned to each UE.The bias applied to the SINRinvolves optimizing one of the system parameters so that the tenth percentile user throughput is maximized for each average throughput value.

◀Figure 7.Two-dimensional SINRfor baseline(left)and eSINR for fuzzy cells(right).

▲Figure 8.CDFof eSINRof fuzzy cells and baseline.
2.6 Impact of Backhaul Data Flow Split on Performance
Fig.9 shows the splitting of the downlink data flow in a fuzzy cell deployment.The split occurs in the eNB.The application data packet is downloaded from the core network to the serving eNB(eNB1)via S1 interface.The eNB1 decides how to split received data for each UE,and the data payload is split in two.Part 1 is sent to the UEdirectly from the eNB1,and part 2 is forwarded to the cooperating eNB(eNB2)via X2 interface before being sent to the UEby the eNB2.Status signals are frequently sent over the backhaul to control data-flow splitting.
X2 latency modifies the start and end times of the period where fuzzy cell operation produces gains.When the application packet arrives at eNB1,data is immediately transmitted to the UE but only from eNB1.Fuzzy cell operation begins only after the initial X2 data forwarding delay to eNB2;that is fuzzy cell gains are only possible when both eNBs have data to send.Similarly,if one of the eNBs empties its buffer for the UEbefore the other eNB,then the fuzzy cellgains are also lost.If eNB1 finishes transmitting part 1 before eNBfinishes transmitting part 2,then at that point,only eNB 2 can transmit to the eUE.
The packet size for the traffic model in[2]is 2 MB.For a 2 MB packet and an assumed X2 delay of 10-20 ms,the delay is negligible and not modeled in the simulations.
2.7 Estimating Performance
Because of the complexity of cellular systems,it is difficult to predict gains without extensive simulation;however,some estimation is possible.For lightly loaded cells,UEs do not contend much for resources in any given transmission time interval(TTI).In this case,the throughput distribution can be largely predicted by the eSINR distribution,and the eSINRcan be mapped to an achievable throughput.If we consider only the long-term SINRin each CC frequency in the system,we can compute the achievable throughput for each UEin the system using all its connected CCs.The long-term SINRcan be used as a rough estimate of throughput in a fading environment.Fig.10 shows achievable throughput distribution for a power difference of 10 d B.From this graph,we can expect cell-edge throughput to be nearly 85%better than in the baseline and stillhave similar average UEthroughput.Furthermore,if two of the three CCs are switched off at each sector antenna(indicated by a power difference of 100 d Bin Fig.10),eSINRdistribution is further improved.

▲Figure 9.Data-flow splitting ateNB.

▲Figure 10.eSINRbased achievable throughput CDF for a 10 dBpower difference.
The tenth percentile throughput is nearly 160%better than in the baseline,and there is nearly 30%increase in average UEthroughput.This estimate is only accurate if there is little or no competition among UEs for radio resources.As the loads increase towards full buffer-like operation,the load imbalance between large-and small-coverage area CCs has a greater impact on performance,and eSINRalone cannot be used for estimation.In other words,improving the SINRin some CCs by increasing transmit power must be weighed against the increased load these CCs will have because of their larger coverage areas.It is not clear what the optimum tradeoff is,and we must rely on simulations to provide performance estimates.Smaller power differences are also preferable as the traffic load increases.
Even in a heavily loaded system,that is,50%resource use,there are many TTIs where a UEhas little competition for resources in a given CC.Consequently,there are some TTIs in which the eSINRis a predictor of performance.
▲Figure 11.Comparison of algorithmic schemes for high traffic with shadowing.
3 Simulation Results
Throughput based simulations were carried out to compare the performance of different types of fuzzy cell deployments to the performance of the baseline case and FFRschemes.We consider two main metrics of importance:average UEperceived throughput and the cell edge UE-perceived throughput.Because there are two metrics of interest,it is instructive to present data as the possible tradeoff between them.There is tradeoff between average UE-perceived throughput and the cell-edge UE-perceived throughput.For example,even in the simple baseline case with PFscheduler,a tradeoff between cell-edge and average throughput can be achieved by varying the fairness exponent(β)in the scheduler.By sweepingβ,we generate the parametric curve of cell-edge user throughput versus average throughput.There are several parameters that affcet the performance of FFRand fuzzy cell cases.To obtain the tradeoff curves,optimizations were performed to find system parameters that maximized the tenth percentile throughput subject to different average throughput constraints.The other parameters optimized were the cell biasing and the difference in power between the high tx power CC and the two lower-power CCs on each sector antenna.Similar optimizations are done for the parameters that describe the FFRand SFRtechniques.
3.1 High-Volume Traffic
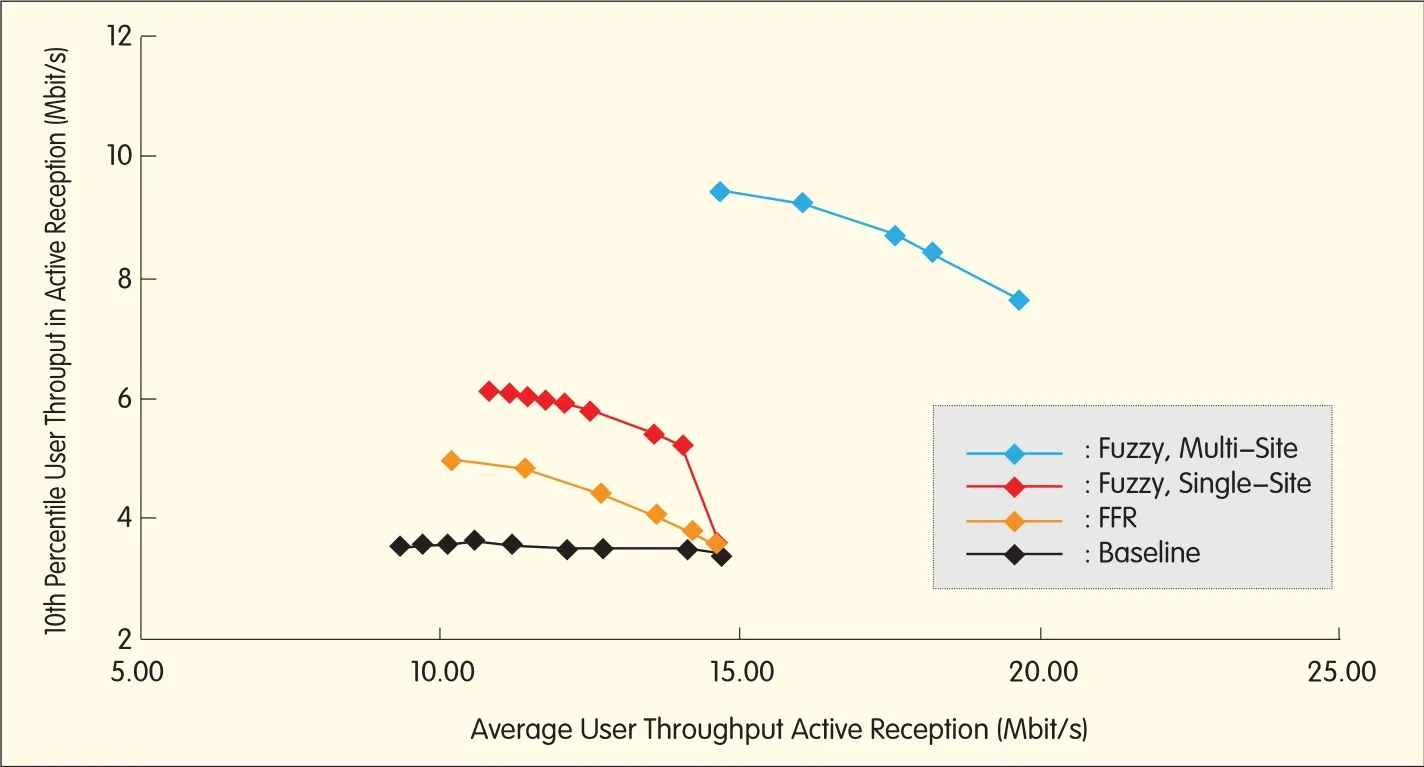
Here,a comparison of fuzzy,FFR,and baseline schemes for high-volume,bursty traffic is discussed.High-volume traffic means the traffic load corresponds to RU of about 50%in the baseline scenario.Two types of fuzzy results are shown in Fig.11:multisite fuzzy and single-site fuzzy.The former are results from simulation of multiflow data delivery scheduling on the best CC regardless of the site at which the CC originated.
This is the same fuzzy cellscenario previously described.The latter are results from simulation of multiflow data delivery scheduling restricted to CCs originating from the same site.This is more compatible with LTE-A Release 10.
Multisite fuzzy cells double edge-user throughput and improve average user throughput by roughly 30%compared with FFRand baseline schemes.
3.2 Low-Volume Traffic
Here,a comparison of fuzzy,FFR,and baseline schemes for low-volume,bursty traffic is discussed.Low-volume traffic implies an RU of about 10%in the baseline case.Similar to the high volume traffic case,low volume traffic fuzzy results are shown in Fig.12.Multisite fuzzy doubles improvement in edge-user throughput and improves average user throughput by roughly 60%compared with FFRand baseline schemes.
4 Conclusions
Fuzzy cell technology combines multipoint,multifrequency transmission techniques,and intelligent parameter selection(e.g.transmission power differences between carriers),and it is built on top of carrier aggregation.It can be applied to any multicarrier system,including HSPA+and LTE.
Fuzzy cells is a simple,high-performance,robust scheme that mitigates the cell-edge problem and improves system performance.We have shown the cell edge versus average performances that can be achieved with standard frequency reuse 1,FFR,and fuzzy cells.Fuzzy cells roughly doubles cell-edge performance compared with frequency reuse 1 and FFR.Fuzzy cells also significantly improve average performance.
In fuzzy cells,the data flow to each UEin a CC is independent in terms of radio resource scheduling and hybrid automatic repeat request(HARQ).
Therefore,allocations among different sites do not need to be tightly coordinated.The need for stringent latency is relaxed compared with CoMP inter-site coordination via the X2 interface.To support techniques such as CoMP,investment needs to be made in low-latency,high-capacity backhaul,for example,fiber optics.However,fuzzy cells can be realized with existing backhaul.Fuzzy cells can be realized before other advanced techniques and without investment in new low-latency backhaul.
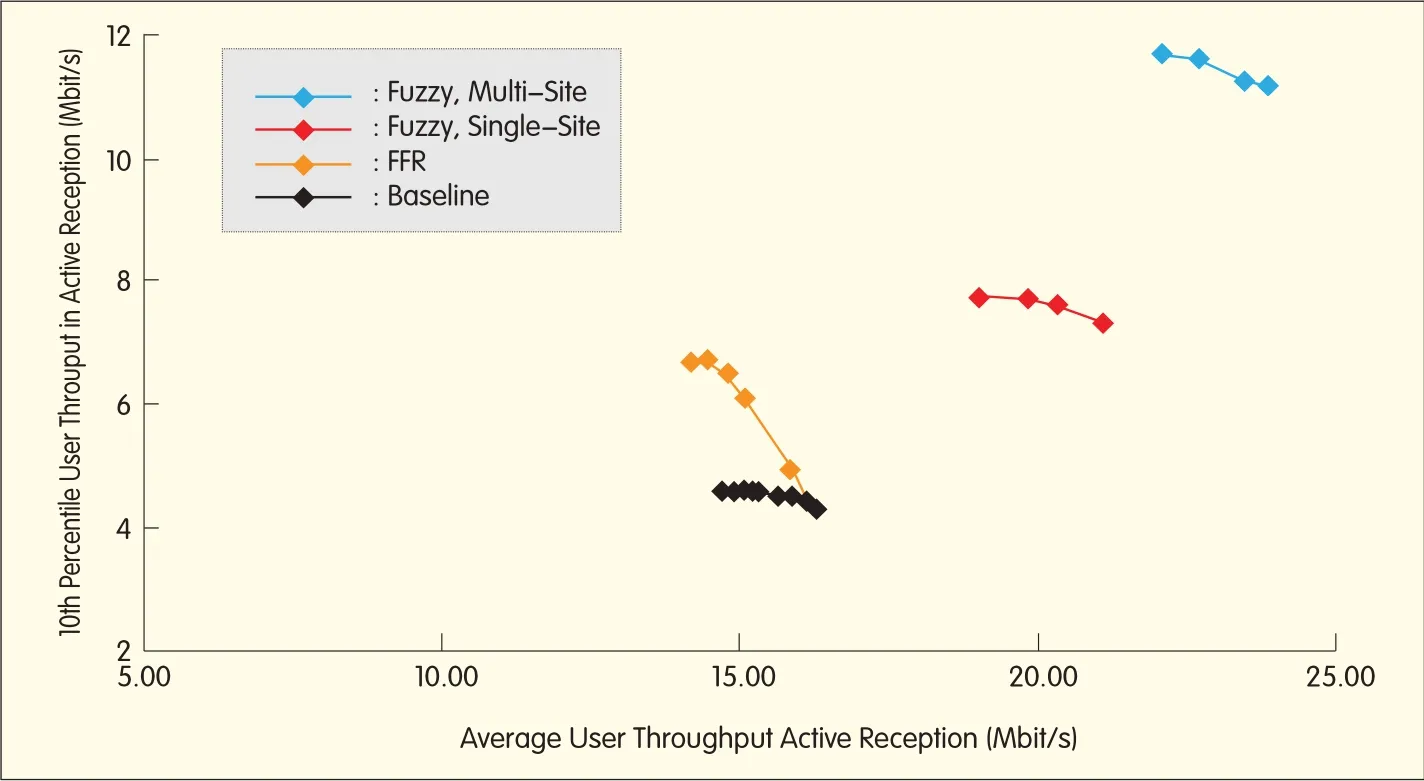
▲Figure 12.Comparison of algorithmic schemes for low traffic with shadowing.
Appendix
A system-level simulator using hexagonal cellular layout is used to validate our concept.The simulation parameters are based on LTEurban macro cell no line-of-sight.UEs are dropped randomly with uniform distribution.The simulation parameters are summarized in Table 1.Two site rings are populated with users,and statistics are collected only from UEs near the center site.

- ZTE Communications的其它文章
- Advances in Digital Front-End and Softw are RFProcessing:PartⅡ
- Frost&Sullivan Recognizes ZTE as 2011 LTEVendor of the Year
- ZTE Establishes Global Consumer Brand Ambitions in 2011
- Polyphase Filter Banks for Embedded Sample Rate Changes in Digital Radio Front-Ends
- Design of Software-Defined Down-Conversion and Up-Conversion:An Overview
- Practical Non-Uniform Channelization for Multistandard Base Stations