A STUDY OF DRAG COEFFICIENT RELATED WITH VEGETATION BASED ON THE FLUME EXPERIMENT*
HUI Er-qing, HU Xing-e
China Three Gorges Corporation, Yichang 443002, China
State Key Laboratory of Hydroscience and Engineering, Tsinghua University, Beijing 100084, China, E-mail: hui_erqing@ctgpc.com.cn
JIANG Chun-bo, MA Fang-kai, ZHU Zhen-duo
State Key Laboratory of Hydroscience and Engineering, Tsinghua University, Beijing 100084, China
This study is focused on the effects of ecological factors (diameter and flexibility) and vegetation community composition on the drag coefficient related with vegetation. The single leafy shrub and three mixed communities (including shrub-grass, shrub-reed and reed-grass community) were studied. The flow velocity and water level were measured and used to calculate the drag coefficient based on the Bernoulli’s equation, Darcy drag formula and the expression for the drag coefficient related with Darcy drag factor. The trend of the drag coefficient in the vertical direction was analyzed against flow depth, diameter, diameter Reynolds number, flow depth Reynolds number and relative roughness height in different discharges. The results show that beside the dense leafy shrubs community, the vertical trend of the drag coefficient among other cases against flow depth, diameter, diameter Reynolds number, flow depth Reynolds number and relative roughness height can be approximately expressed by power law functions under different flow discharges. Moreover, in a mixed community with two plants with distinctly different ecological factors, the one with the most distinct variations of ecological factors determines the vertical trend of the drag coefficient; the other one only affects the magnitude of the drag coefficient. Furthermore, if the ecological factors of the vegetation in the vertical direction are kept almost not changed, the drag coefficient can be approximately regarded as a constant.
vegetated channel, drag coefficient, flume experiment
1. Introduction
The flow dynamics conditions are important factors of the riverine wetland, which can affect theecological functions of the wetland. The hydraulic conditions in the wetlands are primarily determined by the flow drag related with vegetation. The factors which can affect the flow drag include the flow depth, profile shape, vegetation composition, sinuousness, bed form, bed load and covered ice, etc.[1]. The riverine wetland is composed of anisomerous grasses, shrubs and arbors. The vegetation includes submerged and unsubmerged vegetation, which considerably affects the hydrodynamics, sediment deposition, riverbed evolvement, nutrients and pollutant transportation[2,3]. All these are related with the blocked and altered course of flow, which is in turn related with the leaves and branches of the vegetation.The factors which affect the drag coefficient include the flexibility, diameter, height, distribution, density, age, health, distribution of branches and leaves, composition of plant and flow depth or velocity, etc.[4]. For large arbors, they not only bring about the drag, but also make the block[5]. The drag coefficient is the key in determining the drag related with vegetation, and also the key to understand the vertical distribution of the velocity. Many researches about the drag related with unsubmerged and submerged vegetation were carried out[6-9].
In most of previous studies, the artificial plants are considered, which can hardly represent the distribution of branches and leaves of natural plants, and their results can not directly be used for the natural plants. The three dimensional flow fields among the plants concern the understanding of the vertical variations of the drag related with vegetation, in particular and the vertical variations of the drag coefficient, in general. The articles studies the vertical variation trend of the drag coefficient, based on the vertical variations of plant ecological factors (diameter and flexibility), leaves and plant types in the community. The different types of vegetation communities are considered and mounted in the flume in a stagger pattern, including the single leafy shrubs, reeds community and mixed shrubs-grass, shrubs-reeds community. The drag coefficient is calculated based on the Bernoulli’s equation, Darcy drag formula and the drag coefficient expression. The vertical trend of the drag coefficient is analyzed with respect to the water depth, diameter, diameter Reynolds number, water depth Reynolds number and relative roughness height in different discharges. The drag coefficients of a single community and the mixed community are compared. This study supplies some guidance in the determination of the drag coefficient in the vertical direction.
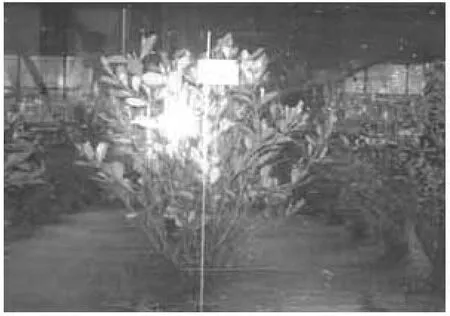
Fig.1 Front elevation of shrub
2. The experimental arrangement
The experiments consider various effective factors that affect the drag coefficient such as plant leaves, composition and the vertical ecological factors (diameter and flexibility), shrubs and reeds. Larger diameter means less flexibility. Four communities are designed, of which two are single communities including leafy shrubs and reeds, other two are mixed communities including shrubs-grasses and shrubs-reeds. Buxus sincia Rehd (Fig.1) and the top segment of the natural reeds are taken to be simulated, which are mounted to a glass wall flume of 22.6 m long, 1.0 m wide and 0.8 m deep (Fig.2), with a slope of 0.0067. On average, the shrubs are 0.275 m in height and 0.2 m in width at the top in the biggest diameter in the longitudinal direction, while the roots are 0.07 m in height. The vertical distribution of the shrub’s diameter follows approximately a power law. The average height of reeds is 0.5 m and the diameter is 3.4 mm. Grasses are very flexible with height of 0.07 m. There are 12 pieces of bamboo leaves and pine needles, divided into three layers: 6 pieces in the bottom layer, 4 pieces in the middle layer and 2 pieces in the top layer. All the bamboo leaves and the pine needles amongst the simulated grasses are fixed in the flume. All plants are mounted in a staggered pattern. Two rows of grasses are placed between shrubs to simulate the mixed community (Fig.3). The mount pattern of the mixed shrub-reed community is the same as the shrub-grass community.

Fig.2 Schematic diagram of laboratory setup

Fig.3 Staggered patterns of grasses and shrubs or reeds
The discharges are conducted by a frequency conversion pump, with frequency value fixed to maintain a constant discharge throughout the process. Upon entering the channel, the flow passes through a series of honeycomb grids to straighten the flow to make the flow uniform across the width of the channel. Four sections are set for measuring velocity and water level. Four vertical lines in each section are set, where are several measurement points in accordance with the flow depth (Fig.4). Water levels are measured by the pressure transducer, which are connected to the software running on a PC. The three components of flow velocity are measured with a three-dimensional Acoustic Doppler Velocimeter (ADV).

Fig.4 Positions of the measurement points in the plane
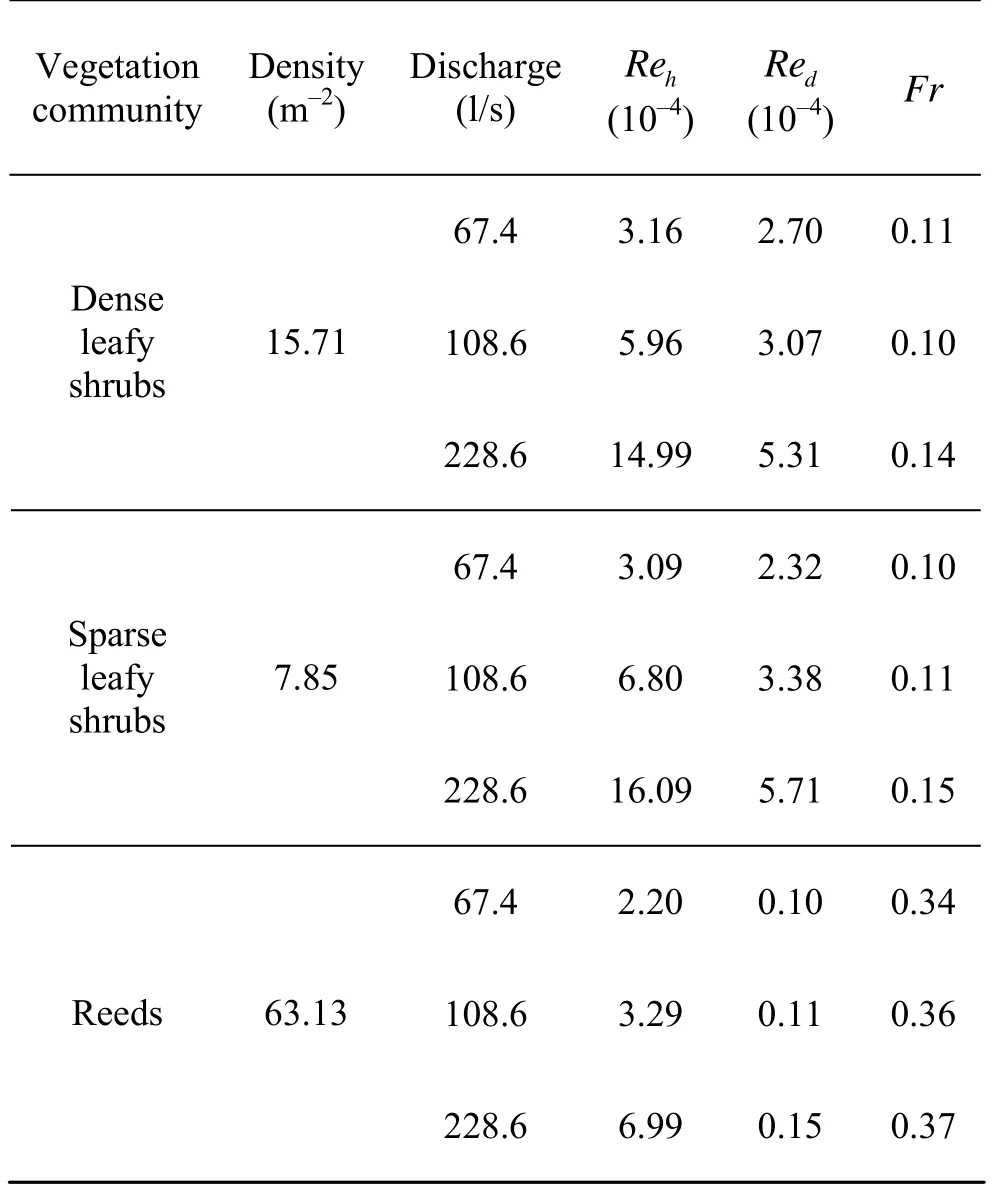
Table 1 Hydraulics and vegetation characteristic parameters in the single plant community
According to the height of shrubs and reeds and preliminary measurements for the uniform flow in the non-vegetated channel, three types of discharges are determined: unsubmerged, just submerged and submerged, with discharge of 67.4 l/s, 108.6 l/s and 228.6 l/s, respectively. The Reynolds number of this experiment based on the flow depth is within the ranges of 2.20×10⁴to 1.61×10⁵. That based on the plant diameter is within the ranges of 1.0×10³to 5.7×10⁴. The Fraud number is less than 0.37, which indicates that the present experiment concerns a subcritical flow. The density of shrubs is 15.71 m–2in the dense conditions and 7.85 m–2in the sparse conditions. The density of the single reeds community is 59.88 m–2. The hydraulic and vegetation characteristic parameters in the single plant community are shown in Table 1 and those in the mixed community are shown in Table 2.

Table 2 Hydraulic and vegetation characteristic parameters in the mixed plant community


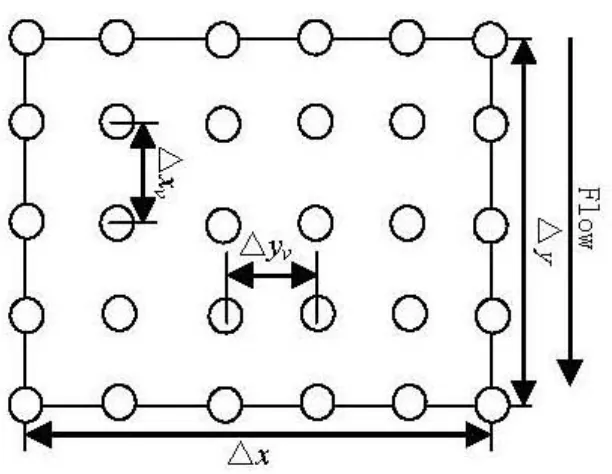
Fig.5 Schematic diagram of vegetated zone
3. Theoretical analysis
3.1The f relation between drag coefficient and Darcy friction factor
It is assumed that there is a vegetated zone with Δxas the length in the longitudinal direction and Δyas the width in the lateral direction, which are denoted asΔxvand Δyvbetween the planes (Fig.5). The plant height ishv, the flow depth ishand the flow velocity in the cell isu. The forces on the vegetated zone are shown in Fig.6.
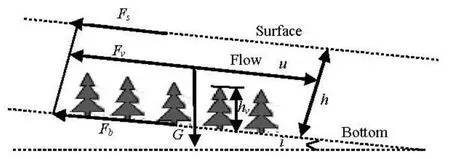
Fig.6 Schematic diagram of the forces on the vegetated zone
In Fig.6,Fv,Fb,Fsare the drag forces related with the plants, bed and water surface, respectively,Gis the gravity due to the plant, On this vegetated zone,Fvcan be written as:

whereApis the momentum absorption area,ρis the water density,ρvis the vegetation density andρv=(ΔxvΔyv)−1,Cdis the drag coefficient related with vegetation.
The volume of vegetation should be considered in a dense plant community, and the gravity forceFgdue to vegetation alongside the slope surface can be written as:

whereVvegis the volume of vegetation.
In the dense vegetated zone, the drag force related with vegetation is higher than the friction drag related with the bed roughness and water surface, and the latter can then be neglected. The gravity and the drag force related with vegetation approximately reach a balance under uniform flow conditions. Based on the force balance, it can be deduced thatFv=Fg. According to formulas (1) and (2), the following equation can be attained:
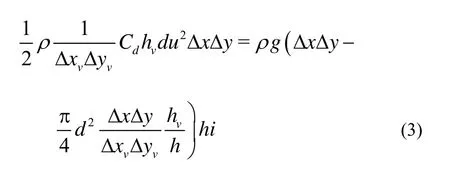


Formula (4) can be transformed to:

3.2The vertical distribution of the drag coefficient

Under the gradually varied flow conditions, in every streamline, the energy lossHfcan be calculated by measuring the head loss based on the Bernoulli’s Eq.(6), and then Darcy friction factorfcan be calculated based on the Darcy-Weisbach Eq.(7). Based on these, the drag coefficientCdcan be calculated by formula (5). Both the potential and velocity heads are incorporated in the calculations. Bernoulli’s equation and Darcy friction factor formula are as follows wherevis the velocity of each measurement point,his the corresponding water level related with the velocity,σis the velocity distribution coefficient representing the flow properties.αapproaches 1.0 under a uniform velocity, which is taken as equal to 1.1 in this study. The subscripts 1 and 2 represent upstream and downstream, respectively.Lis the distance between upstream and downstream. The energy loss due to the flume bottom and the glass wall is much less than that due to the plant, as can be seen by comparing the vegetated and non-vegetated conditions, and it can be neglected. Because it is difficult to determine the streamline positions, whileCdof each measurement point is calculated, the flow velocity values of the upstream and downstream sections are taken as those at the same water level. It is assumed that the energy lossHfin each measurement point is the same as that on the water surface in every section. Because the ecological factors of the plant in the flume are similar, the above-mentioned assumptions are reasonable.
The plant communities used in the experiment include shrubs, reeds, grasses and mixed communities composed of these plants. The relation between the leafy shrub’s diameter and its height is as follows:

The relation between the leafless shrub plant’s diameter and its height is as follows:

The diameter of the mixed plant community is calculated as:

wheredmis the diameter of the mixed plant community.
The momentum adsorption areaApof shrubs and grasses is approximately in a form of triangle, theApof reeds is a form of rectangle. TheApof the mixed community is the sum of the area of all plants in the community. The calculation methods of these plants are shown in Table 3. The volumes of shrubs, grasses and reeds are calculated by the formulas as listed in Table 4.
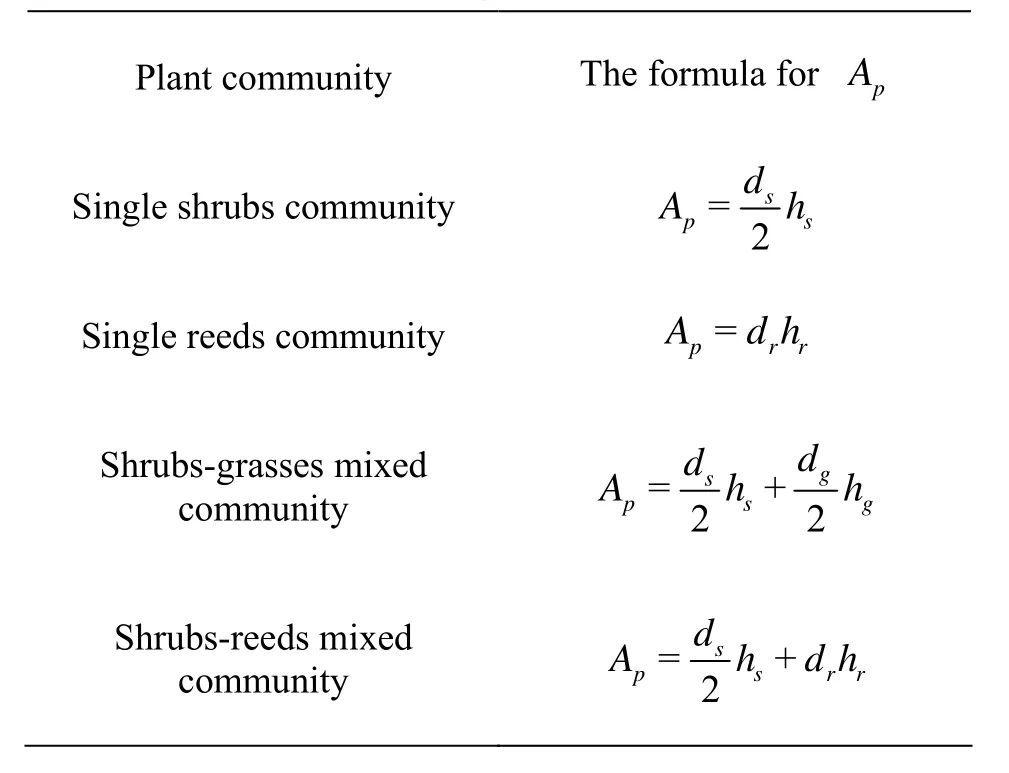
Table 3 The formulas forAp

Table 4 The formulas for plant volume
In Tables 3 and 4,ds,dganddrare the diameter of the shrubs, grasses and reeds, respectively,hs,hgandhrare the height of the shrubs, grasses and reeds, respectively.
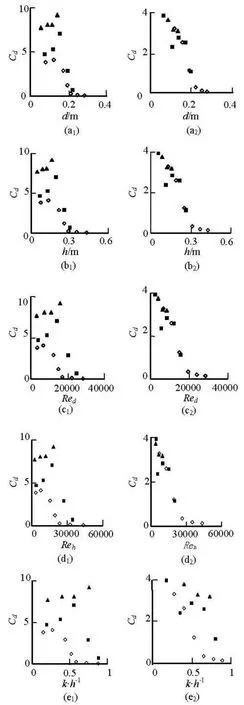
Fig.7 TheCdagainstd,h,Reh,Redandk/hin leafy shrubs community. The symbols▲, ■ and◇represent the discharges of 67.4 l/s, 108.6 l/s and 228.6 l/s, respectively, Figs.7(a1)-7(e1) and Figs.7(a2)-7(e2) are for dense and sparse plants, respectively
4. The experimental results
The drag coefficientCdrelated with vegetation, the plant diameterd, the flow depthh, the flow depth Reynolds numberReh, the plant diameter Reynolds numberRedand the relative roughnessk/hin every water height are averaged by four profiles in each conditions. The dependence ofCdond, h,Reh,Redandk/hin different plant communities is analyzed as in the following sections. 4.1Leafy shrubs community
The experimental results of leafy willows as reported in Järvelä[10]show thatfincreases with the flow depth, indicating thatCdvalues increase with the flow depth. From Figs.7(a1)-7(e1), it can be seen thatCdvalues increase withd, h,Reh,Redandk/hin power law functions below the plant height. Above the plant height,Cdvalues decrease. Comparing with Juha’s results, it is shown that only if among dense plants and bellow the plant height,Cdvalues increase with the flow depth. Kadlec suggested that the Darcy friction factor of the flexible and emergent plant would decrease with the increase of flow depth[11]. Wu et al.[12]shows that the Manning roughness coefficient of the emergent plant decreases with flow depth increasing. Musleh and Cruise[13]shows that the Chezy coefficient increases with flow depth but nonlinearly. Formula (5) shows thatCdhas a positive correlation with the Darcy friction factor and the Manning coefficient and a negative correlation with the Chezy coefficient. From the above results, it can be deduced thatCddecreases with flow depth increasing. Figs.7(a2)-7(e2) show that the relations ofCdagainstd, h,Reh,Redandk/hcan well be described by declining power law curves, with correlation coefficient up to 0.77.
4.2Shrub-grass mixed community
Figure 8 shows thatCddecreases withd, h,Reh,Redandk/hin power law curves. The correlation of the curves is up to 0.92. ThoughCdsees a little difference in different discharges, they stick close to the same curve. Comparing theCdvalues in different plant densities, the scattering ofCdvalues in the sparse plant community is larger than that in the dense plant community. This shows that the effect of discharges (flow velocity) onCdin a sparse plant community is bigger than that in a dense plant community. The drag force related with vegetation is positively correlated with the deflectiondegrees of leaves and branches of the plant. The force of the flow on the vegetation increases with discharges increasing. The leaves and branches of the plant incline to follow the direction of the streamline, therefore, the drag force related with vegetation is reduced. In each discharge, the force of the flow imposed on the plant in the sparse plant community is larger than that in the dense one, which suggests that the deflection of the plant is more distinct and the variations ofCdwith discharges are more prominent in the sparse plant community.
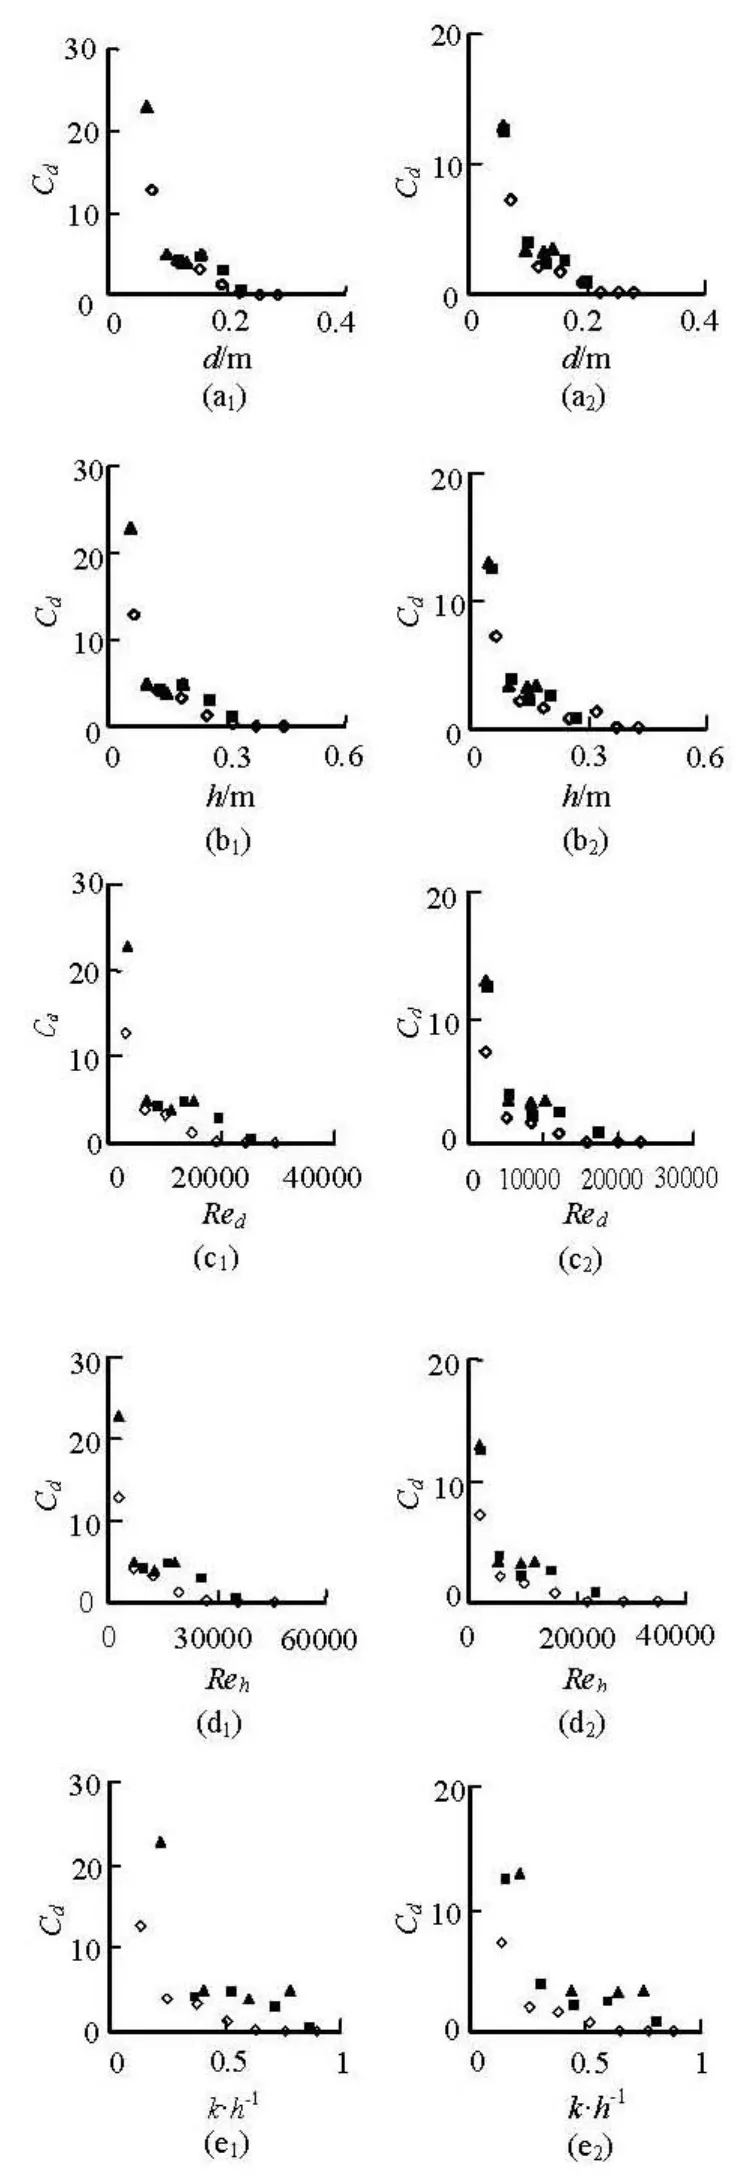
Fig.8 The plots ofCdagainstd,h,Reh,Redandk/hin leafy shrubs community. The symbols ▲, ■ and◇represent the discharges of 67.4 l/s, 108.6 l/s and 228.6 l/s, respectively, Figs.8(a1)-8(e1) and Figs.8(a2)-8(e2) are for dense and sparse plants, respectively
4.3Discussions
Comparing the single leafy shrubs community (Fig.7) with the shrubs-grasses mixed community (Fig.8), the drag coefficient related with vegetation of the latter is higher than that of the former. The trend of the curves of the drag coefficient againstd, h,Reh,Redandk/his different in dense conditions and is nearly the same in sparse conditions. The scattering of the drag coefficient in the shrubs-grasses mixed community is more distinct than that in the single shrubs community. In addition, well above the grasses height, the trend of the curves of the drag coefficient is the same. The effect of grasses on the drag coefficient is only limited within the ranges of a little over the height of grasses.
The trend of curves of the drag coefficient against the plant diameter varies under different conditions. The drag coefficient of the single shrub community increases with the plant diameter, while the drag coefficient of the shrubs-grasses or shrubs-reeds mixed community decreases. It shows that the trend of the curves of the drag coefficient against the plant diameter is affected by the composition of the plants. The drag coefficient can be regarded as a constant when the vertical ecological factors of the plant (diameter and flexibility) keep little changed. The plant density has much greater effect on the vertical trend of the curves of the drag coefficient againstd, h,Reh,Redandk/h.
5. The calculation model for the drag coefficient
As the drag coefficient related with vegetation is a non-dimensional parameter, the average stem and leaf spacingsis divided by plant diameterdor flow depthhfor ensuring the non-dimensional nature of the drag coefficient. Based on the analysis of the experimental data and dimensional analysis of the Jonathan’s research[14], the drag coefficient can be expressed as a function ofd/s, h/s,RehandRed, as follows:

The relation between every factor and the drag coefficient can be expressed as power or exponential functions. Formula (11) may take 16 different forms. The multiple correlation coefficients of these formsare calculated by the multiple regression analysis method, to show the precision of these forms. A comparison shows that the multiple correlation coefficient of the following form is the biggest:

whereKis a coefficient,α1,α2,α3andα4are empirical parameters.
Based on formula (12), the prediction model under each condition including the shrub in this experiment is expressed as follows:
(1) For leafy shrub community For dense case:

(2) For leafy shrub-grass mixed community For dense case:
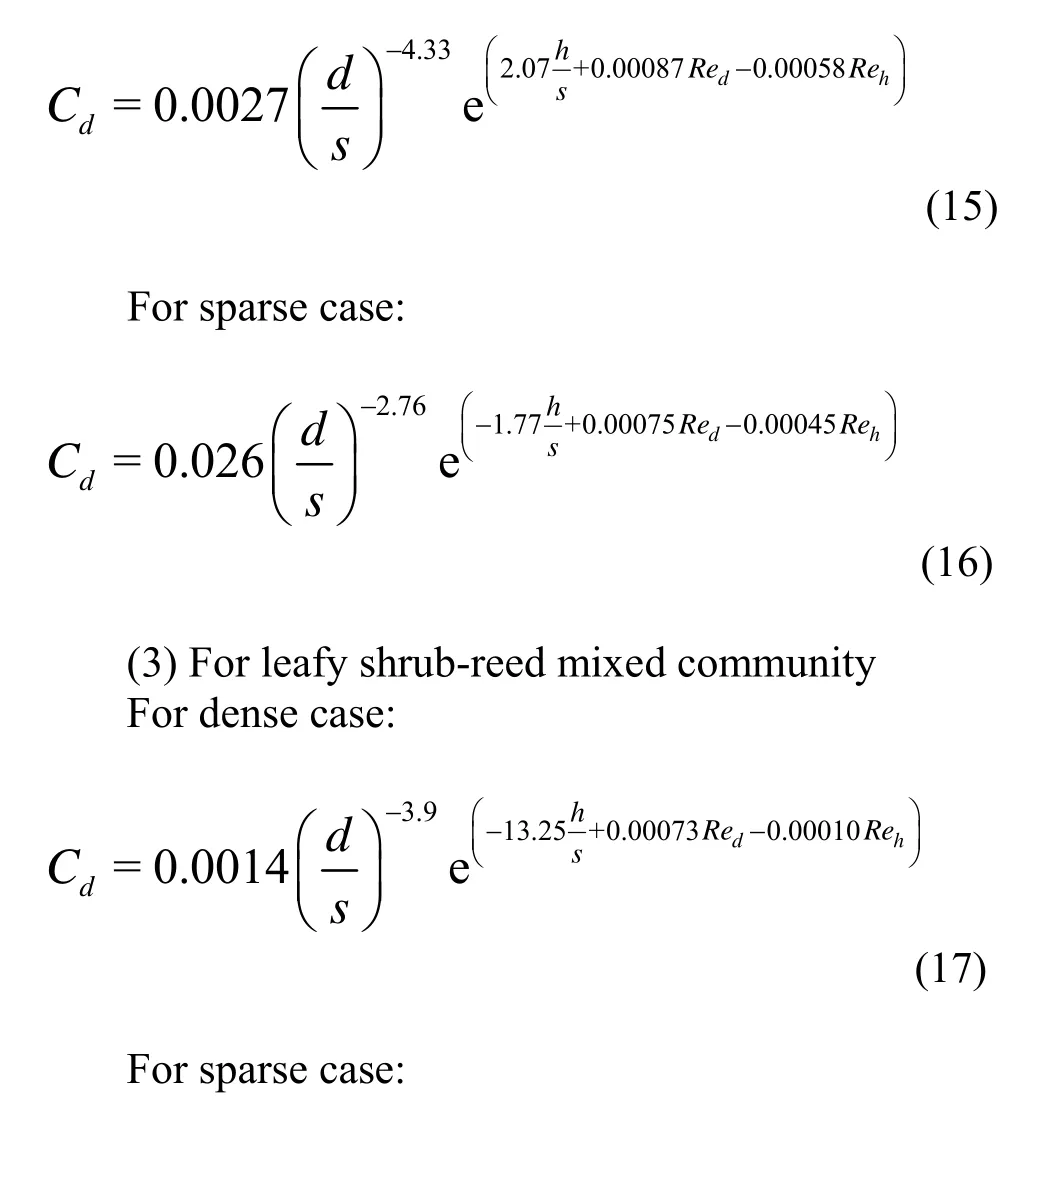

The statistics parameters for formulas (13)-(18) are listed in Table 5.
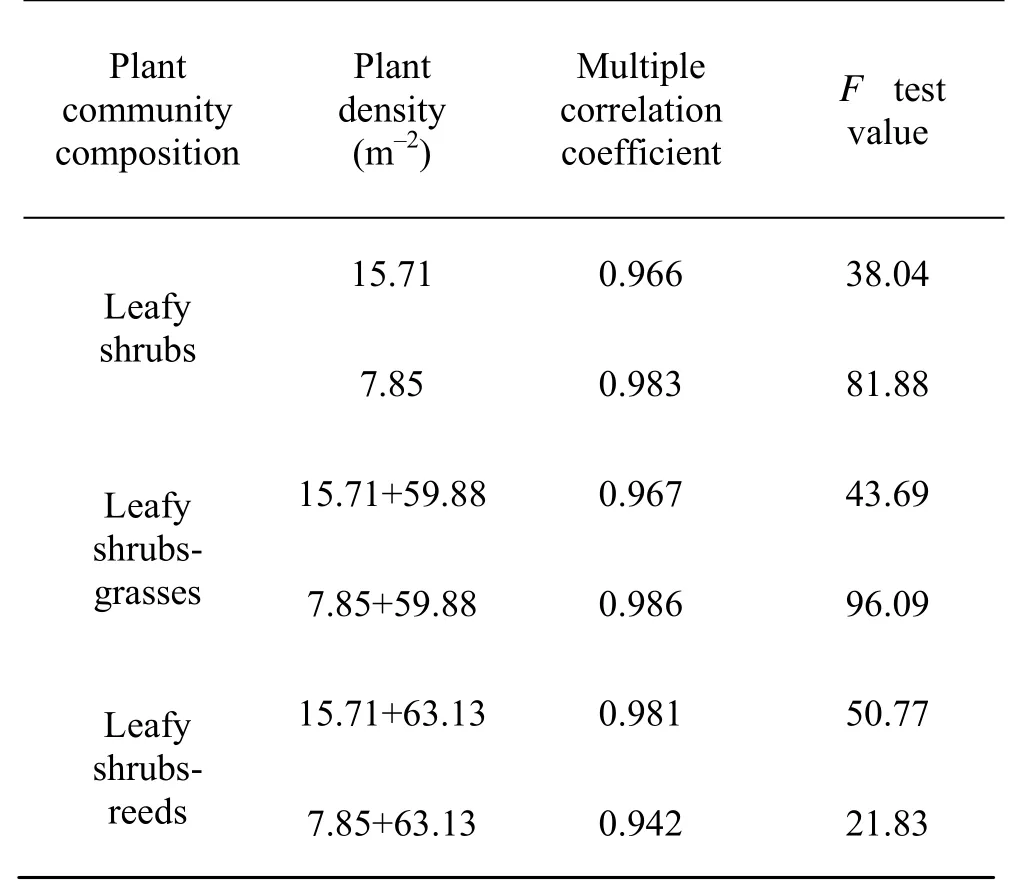
Table 5 The statistics parameters
In Table 5, the multiple correlation coefficient for formulas (13)-(18) is about 0.96 andFtest value is overF0.05=0.21, which shows that each formula has a high precision.
6. Conclusions
Based on the flume experimental data, the Bernoulli’s equation, the Darcy-Weisbach formula and the drag coefficient--the Darcy drag factor expression are used to calculate the drag coefficient in different discharges in various combinations of the flexible and stiff vegetation, such as natural shrubs, reeds and grasses. The dependence of the drag coefficient ond, h,Reh,Redandk/his
(1) The trend of the curves of the drag coefficient against plant diameter, flow depth, diameter Reynolds number, flow depth Reynolds number and the relative roughness can be expressed as power functions, with different correlations.
(2) While two types of plants coexist, the one with more distinct variations of the ecological factors analyzed. The following conclusions are reached:determines the trend of the curves of the drag coefficient in a certain range of height, while the other only affects the magnitude of the drag coefficient.
(3) The drag coefficient is nearly a constant when the vertical ecological factors are kept little changed.
The present study gives some food of thought in understanding the effects of discharges, the vertical variations of ecological factors and plant composition on the drag coefficient related with vegetation in different submerged conditions. The drag force can be calculated as soon as the numerical simulation results of flow field among the vegetation are available.
[1] NIKORA V., LARNED S. and NIKORA N. et al. Hydraulic resistance due to aquatic vegetation in small streams: Field study[J].Journal of Hydraulic Engineering,2008, 134(9): 1326-1332.
[2] NEPF H. M., VIVONI E. R. Flow structure in depthlimited, vegetated flow[J].Journal of Geophysical Research,2000, 105(C12): 28547-28557.
[3] YEN B. C. Open channel flow resistance[J].Journal of Hydraulic Engineering,2002, 128(1): 20-39.
[4] DARBY S. E. Effect of riparian vegetation on flow resistance and flood potentia[J].Journal of Hydraulic Engineering,1999, 125(5): 443-454.
[5] WU Y., FALCONER R. A. and STRUVE J. Mathematical modeling of tidal currents in mangrove forests[J].Environmental Modelling and Software,2001, 16(1): 19-29.
[6] WU Fu-Sheng. Characteristics of flow resistance in open channels with non-submerged rigid vegetation[J].Journal of Hydrodynamics,2008, 20(2): 239-245.
[7] LIU Cheng, SHEN Yong-Ming. Flow structure and sediment transport with impacts of aquatic vegetation[J].Journal of Hydrodynamics,2008, 20(4): 461-468.
[8] GU Feng-feng, NI Han-gen and QI Ding-man. Roughness coefficient for Unsubmerged and submerged reed[J].Journal of Hydrodynamics, Ser. B,2007, 19(4): 421-428.
[9] ZHANG Jian-tao, SU Xiao-hui. Numerical model for flow motion with vegetation[J].Journal of Hydrodynamics,2008, 20(2): 172-178.
[10] JÄRVELÄ J. Flow resistance of flexible and stiff vegetation: A flume study with natural plants[J].Journal of Hydrology,2002, 269(1-2): 44-54.
[11] KADLEC R. H. Overland flow in wetlands: Vegetation resistance[J].Journal of Hydraulic Engineering,1990, 116(5): 691-706.
[12] WU F. C., SHEN H. W. and CHOU Y. J. Variation of roughness coefficients for unsubmerged and submerged vegetation[J].Journal of Hydraulic Engineering,1999, 125(9): 934-942.
[13] MUSLEH F. A., CRUISE J. F. Functional relationships of resistance in wide flood plains with rigid unsubmerged vegetation[J].Journal of Hydraulic Engineering,2006, 132(2): 163-171.
[14] JONATHAN K. L., LISA C. R. and HARRY L. J. et al. Drag coefficients for modeling flow through emergent vegetation in the Florida Everglades[J].Ecological Engineering,2004, 22(4-5): 237-248.
July 16, 2009, Revised March 23, 2010)
* Project supported by the China National Funds for Distinguished Young Scientists (Grant No. 50925932), the National Key Technology R and D Program in the 11th Five Year Plan of China (Grant No. 2009BAB29B09), the State Key Laboratory of Hydroscience and Engineering, Tsinghua University (Grant No. 2008-ZY-5) and the National Key Basic Research Project of China (973 Program, Grant No. 2006CB403304).
Biography:HUI Er-qing (1977-), Male, Ph. D.
2010,22(3):329-337
10.1016/S1001-6058(09)60062-7
- 水动力学研究与进展 B辑的其它文章
- BROADBAND ROTOR NOISE PREDICTION BASED ON A NEW FREQUENCY-DOMAIN FOUMULATION*
- THE EFFECT OF RECLAMATION IN AREAS BETWEEN ISLANDS IN A COMPLEX TIDAL ESTUARY ON THE HYDRODYNAMIC SEDIMENT ENVIRONMENT*
- IMPROVED DEM-CFD MODEL AND VALIDATION: A CONICAL-BASE SPOUTED BED SIMULATION STUDY*
- FLOWS THROUGH ENERGY DISSIPATERS WITH SUDDEN REDUCTION AND SUDDEN ENLARGEMENT FORMS*
- NUMERICAL SIMULATIONS OF WAVE-INDUCED SHIP MOTIONS IN TIME DOMAIN BY A RANKINE PANEL METHOD*
- SENSITIVITY STUDY OF THE EFFECTS OF WAVE-INDUCED VERTICAL MIXING ON VERTICAL EXCHANGE PROCESSES*

