The Numerical Simulation of Collapse Pressure and Boundary of the Cavity Cloud in Venturi*
ZHANG Xiaodong (张晓冬), FU Yong (付勇), LI Zhiyi (李志义) and ZHAO Zongchang (赵宗昌)
The Numerical Simulation of Collapse Pressure and Boundary of the Cavity Cloud in Venturi*
ZHANG Xiaodong (张晓冬)**, FU Yong (付勇), LI Zhiyi (李志义) and ZHAO Zongchang (赵宗昌)
R&D Institute of Fluid and Powder Engineering, College of Chemical Engineering, Dalian University of Technology, Dalian 116012, China
The idea that the collapse proceeds from the outer boundary of the cavity cloud towards its center for the ultrasonic cavitation proposed by Hasson and Morch in 1980s is further developed for calculating the collapse pressure and boundaries of cavity cloud at the collapse stage of bubbles for hydraulic cavitation flow in Venturi in present research. The numerical simulation is carried out based on Gilmore’s equations of bubble dynamics, which take account of the compressibility of fluid besides the viscosity and interfacial tension. The collapse of the cavity cloud is considered to proceed layer by layer from the outer cloud towards its inner part. The simulation results indicate that the predicted boundaries of the cavity cloud at the collapse stage agree well with the experimental ones. It is also found that the maximum collapse pressure of the cavity cloud is several times as high as the collapse pressure of outside boundary, and it is located at a point in the axis, where the cavity cloud disappears completely. This means that a cavity cloud has higher collapse pressure or strength than that of a single bubble due to the interactions of the bubbles. The effects of operation and structural parameters on the collapse pressure are also analyzed in detail.
cavity cloud, collapsing layer by layer, hydrodynamic cavitation, collapse pressure, bubble dynamics
1 INTRODUCTION
High local temperature and pressure induced by the collapse of cavity bubbles causes erosion, vibration and noise in many hydraulic structures or machineries, which could result in severe damage of these installations. In the past several decades, many researchers have investigated the mechanisms of hydraulic cavitations in order to prevent the occurrence of the cavitations. However, the high local temperature and pressure due to the collapse of cavity bubbles can induce the cleavage of water molecules and yield free hydroxyl radicals, ·OH, which is an oxidizing agent in many chemical reactions. Hydrodynamic cavitation can therefore be used to enhance many industrial processes such as chemical reactions, sterilization, treatment of organic waste water, and so on. These useful effects of cavitation flow have attracted great attention of many researchers in recent years [1-6].
Until now most of the researches have focused their study on a single bubble behavior in cavity flow. In real hydraulic structures or equipments, the cavity bubbles, however, will exist in the form of bubble cloud or bubble cluster. Therefore, it is more important to study the dynamic behavior of a bubble cloud in order to understand the mechanism of cavity erosion or enhancing processes by cavity flow.
van Wijingaarden [7] was the first one who investigated the collapse of a group of bubbles near a flat wall and considerable increase of collapse pressure at the wall was found due to the bubble interaction. d’Agostino and Brennen [8] studied the linear dynamics of a spherical cloud of bubbles using a continuum mixture model coupled with the Rayleigh-Plesset equations. In practice, however, the dynamics of an individual bubble and bubble/bubble interaction through the surrounding liquid are highly nonlinear. Kumar and Brennen [9] found weakly nonlinear solutions to a number of cloud problems by retaining only the terms that are quadratic in the amplitude. Kubota. [10] simulated the unsteady bubbles flow passing a two-dimensional hydrofoil by solving the N-S equations of bubbly liquid mixture coupled with the Rayleigh equations. The shedding of cavitation cloud and the generation of vortex cavitation were discovered.
Based on the energy transfer theory, Morch [11-13], Hanson. [14, 15] studied the dynamics of cavity clusters under ultrasonic radiation and pointed out that the collapse of a cavity cluster was driven by the ambient pressure and the collapse proceeded from the outer boundary of the cluster towards its center. During the collapse the pressure at the inward-moving cluster boundary increased continuously, and at the cluster center it rised significantly above the ambient pressure. The fully nonlinear solution to dynamic problem of the spherical cavity cloud was obtained by Wang and Brennen [16-18]. Their computational results manifested the shock wave phenomena and the idea proposed by Hanson[14, 15]. Reisman. [19, 20] measured very large impulsive pressures on the suction surface of an oscillating hydrofoil experiencing cloud cavitations and demonstrated that these pressure pulses were associated with the propagation of the bubbly shock waves.
Kanthale. [21] investigated the dynamics of cavity bubbles in the cavitation flow through an orifice plate and analyzed the effects of operation and system parameters on the collapse pressure. They developed empirical correlations for predicting collapse pressure and active volume of cavitation.
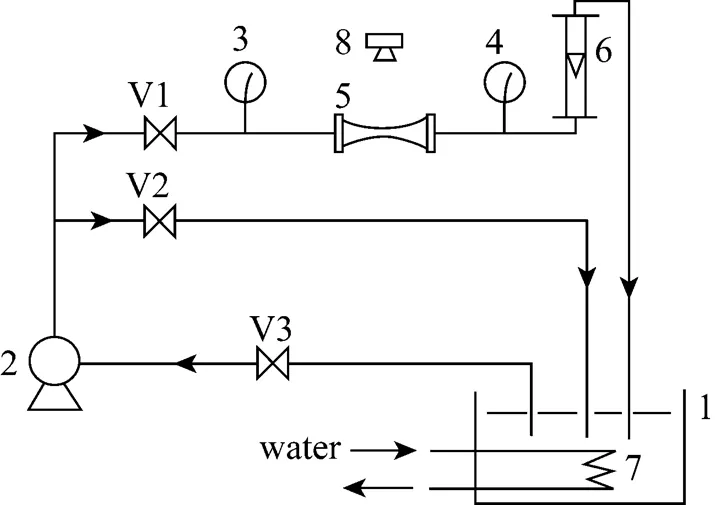
Figure 1 Schematic diagram of experimental apparatus
1—water tank ; 2—pump; 3, 4—pressure gauge; 5—Venturi tube; 6—flow meter; 7—cooler; 8—camera; V1, V2, V3—valves

Figure 2 Configuration of the experimental Venturi
Figure 3 Visible configuration of the cavity cloud in expansion section of the Venturi

The research works reviewed above are, however, based on assumptions that the bubbles inside a cavity cloud are uniformly distributed and the liquid medium is incompressible. Huang and Ni [22] studied the collapse pressure of cavity bubbles in the region of an hydrofoil based on Gilmore’s equations of bubble dynamics, which consider the compressibility of fluid as well as the viscosity and interfacial tension. In addition they adopted the assumption that the collapse of the cavity cloud is considered to proceed layer by layer from the outside layer of the cavity cloud towards its inner part. They found that the collapse pressure of the cavity bubbles in the inner part of the cavity cloud is higher than that in the outside boundary.
In this paper the idea that the bubbles collapse layer by layer from outside layer of a cavity cloud towards its inner part has been adopted for calculating the collapse pressure and boundaries of cavity cloud in hydraulic cavitation flow in Venturi based on Gilmore’s equations of bubble dynamics. The random distribution of initial bubble radius in the cavity cloud is also considered. The boundaries of the cavity cloud at the collapse stage are successfully simulated and compared with experimental data for the first time. The effects of various parameters on the collapse pressure of cavity cloud are also analyzed in detail.
2 EXPERIMENTAL
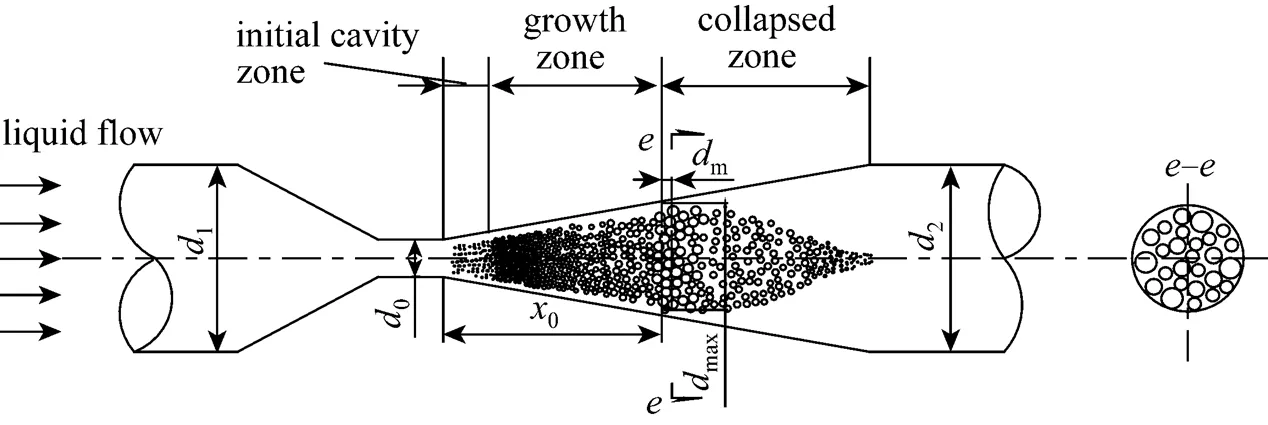
In order to obtain a visual configuration of the cavity cloud or cavitation region formed in the Venturi, the experimental apparatus shown in Fig. 1 is set up. It consists of a scroll pump, a Venturi made of organic glass, the digital camera, the water tank and pressure gauge and so on. The configuration of the experimental Venturi and the visual picture of the cavity cloud in the expansion section of the Venturi are shown in Figs. 2 and 3 respectively. It is clear that the cavity zone is composed of large number of micro-bubbles instead of an individual bubble so that it is called cavity cloud. Its shape looks like a rhombus or two coaxial cones connected base against base, they represent the growth and collapse processes of bubbles in Venturi respectively. The schematic diagrams of the cavity cloud and the pressure profile in the Venturi are shown in Fig. 4.

3 MATHEMATICAL MODEL
3.1 Collapse model
As shown in the Fig. 4, a thin slice of the cavity cloud adjacent to the maximum diameter,max, of the cavity cloud in the collapsed zone is taken as the object, its thickness and position in thedirection aremand0respectively.mis taken as the mean distance between the bubbles in cavity cloud, and0andmaxcan be obtained from pictures of the transparent experimental apparatus.
In order to obtain the mathematical model for describing the behavior of the cavity cloud, the following assumptions are made.
(a)
(b)
Figure 4 Schematic diagram of cavity cloud and pressure profile in Venturi
(1) The cavity bubbles in motion are spherical.
(2) The relative motion between the liquid and cavity cloud and the effects of the solid wall on the collapse of bubbles are neglected.
(3) Initial vapor hold-up or void fraction,a, in the slice of cavity cloud with thickness ofmis constant.
(4) The distribution of the initial radius of the bubbles in cavity cloud obeys the Rayleigh random distribution.
(5) There is a definite boundary between the cavity cloud and the surrounding liquid, and the space occupied by the bubbles will be filled with liquid after these bubbles collapse.
(6) The bubbles in cavity cloud subjected to the pulse pressure will collapse completely with no rebound effects.
As shown in Fig. 5, the slice of cavity cloud with the thickness ofmindirection is divided into a series of layers with width of Δrin thedirection. Here the Δris taken as the mean distance between the bubbles in cavity cloud, which depends on the initial mean bubble diameter and vapor void fraction. The collapse proceeds from the outside layer indirection of this slip of cavity cloud towards its inner layers, that is, the bubbles in outer layer will collapse first and the induced pulse collapse pressures will propagate inwards with the sound velocity,c, in the compressible liquid. At the same time its magnitude will decay with 1/. The induced pulse collapse pressure together with the liquid pressure of the far flow field turn into the driving pressure acting on bubbles in the next inner layer. After these bubbles have collapsed, the space occupied by them will be filled with the liquid. The next inner layer, therefore, becomes the outer layer of the slice of cavity cloud, so the boundary of the cavity cloud will move inward continually. Meanwhile, the slice of cavity cloud moves downstream a distance with bulk liquid flow, so a tapering configuration of cavity cloud will be formed at the collapse stage.
3.2 Gilmore’s equations of bubble dynamics
In the present research, the following Gilmore’s equations of bubble dynamics [23] are adopted for calculating the collapse pressure, which takes account of the liquid compressibility besides viscosity and interfacial tension:
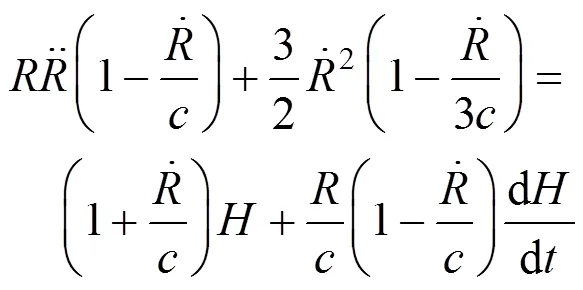
with


whereis the interfacial tension andthe viscosity of liquid,iis the inside pressure in bubbles, which equals to the saturated vapor pressure at operating temperature,..iv. The collapse pressure of the bubble,c, is defined as the liquid pressure on bubble surface at the moment of bubbles collapsing, namelycR.
The driving pressure of bubbles in any layer of the cavity cloud is the sum of the liquid pressure in far field and the propagating pulse pressure generated by all those collapsed bubbles in each outside layer. For instance, the driving pressure for bubbles inth layer is given as follows:

Figure 5 The slice of cavity cloud with the thickness ofmdivided into a series of layers in thedirection
4 NUMERICAL METHODS
4.1 Initial radius distribution of the cavity bubbles
The collapse pressure of a bubble mainly depends on its initial radius,0. The sizes of initial bubbles in cavity cloud are random and they have a mean value of0mean, At the same time there is a critical bubble radius,lim, over which the cavitation will occur. The following Rayleigh random distribution for0will be adopted in present research:

with
4.2 The driving pressure of the bubbles
4.2.1¥
In this paper, the-turbulent flow model and the cavitation flow models are adopted for calculating the liquid pressure in far flow field,¥, in Venturi. Fig. 6 shows the profiles of pressure and velocity along the axis in the expansion section of Venturi, the pressure calculated in single liquid phase flow using FLUENT is used as the liquid pressure in far flow field for the Gilmore’s equations of bubble dynamics.
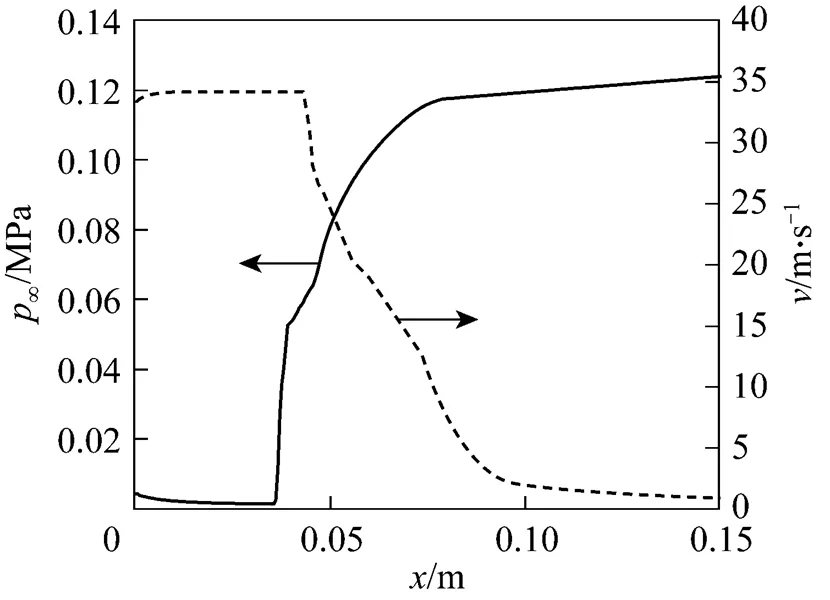
Figure 6 Configurations of liquid pressure and flow velocity in expansion section of Venturi

4.2.2
In the polar coordinate frame the cross section of the slice of cavity cloud considered are divided into a series of layers as shown in Fig. 5. The radius and width of the ith layer arerand Δrrespectively. The bubbles in the same layer collapse the same way irrespective of. The collapse pressure of the bubbles inth layer is the pulse function of the time, which is taken from Ref. [22] as shown in Fig. 7:

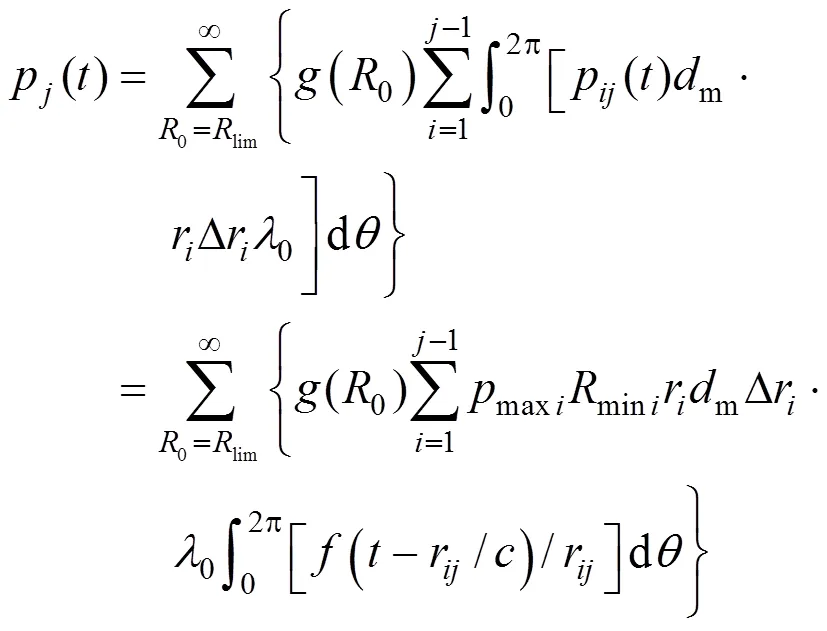
Heremaxiis the maximum value of the pulse collapse pressure of a bubble in theth layer, which is related to its initial radius0and can be obtained by solving the Gilomre’s equations of bubble dynamics. In addition,maxiis the random function of0, and() is the pulse function which takes the same form as the Ref. [22]:

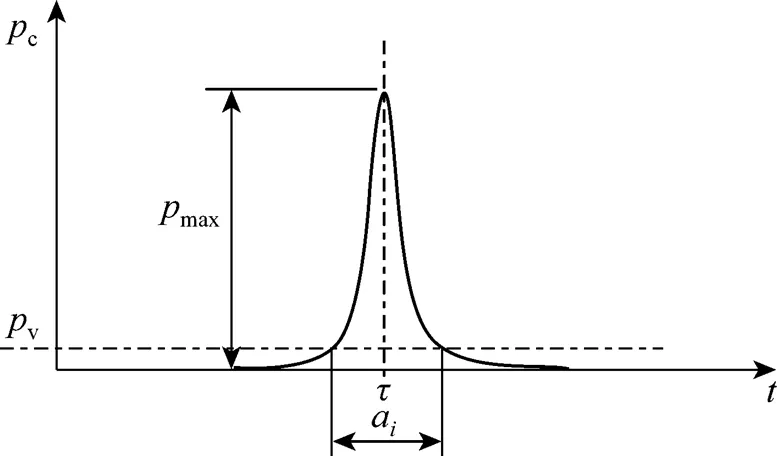
Figure 7 Sketch of pulse collapse pressure
with
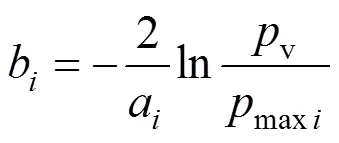

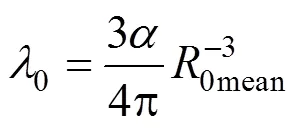
Since all the bubbles inth layer have the same collapse characteristics, the bubble at the point (r, 0) in theth layer is considered. The pulse pressure for this bubble derived from the propagated collapse pressure of the bubble at the point (r,) in theth layer (<) is written as follows:


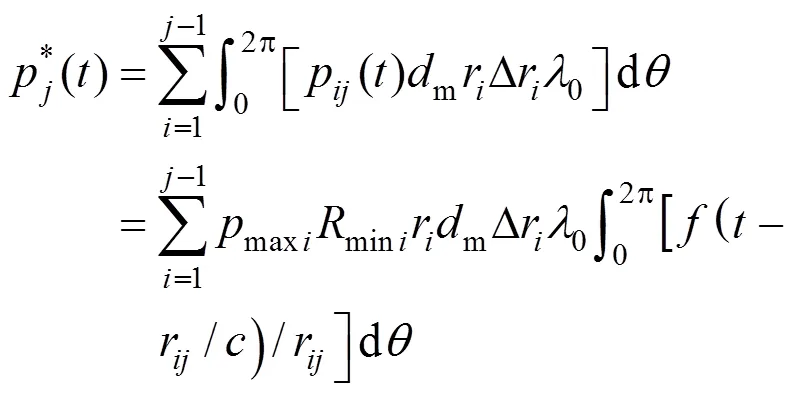
The total pulse pressure acting on the bubble at the point (r, 0) is the sum of collapse pressures propagated from all of the collapsed bubbles beyond theth layer:

4.3 Solution procedure
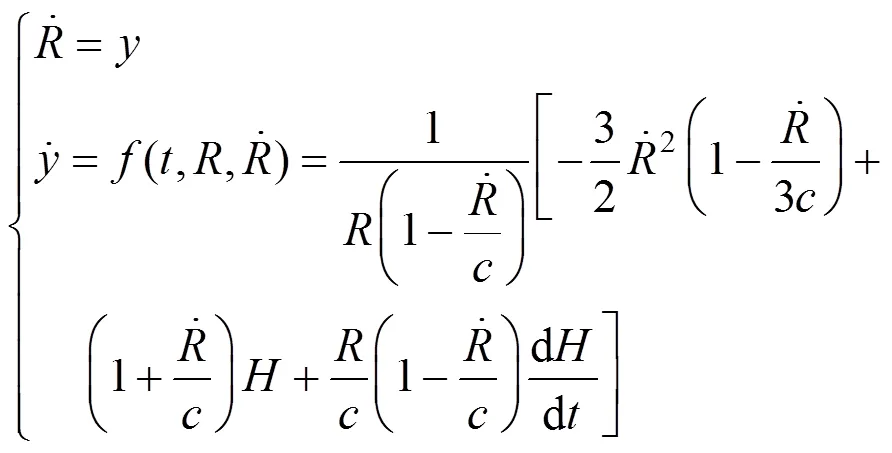
The bubble dynamic Eq. (1) is a second-order nonlinear ordinary differential equation. It can be turned into a group of first-order differential equations as Eq. (11) and solved by using the fourth-order Runge-Kutta method [24]:


5 RESULTS AND DISCUSSION
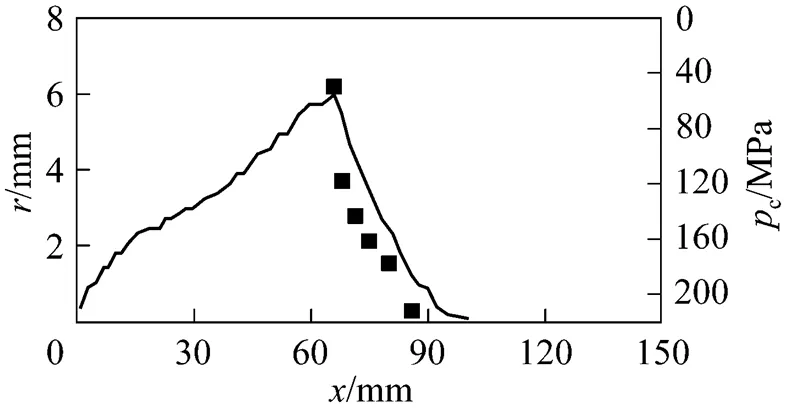
5.1 The boundary of cavity cloud at the stage of bubbles collapse
The evolvement of the cavity bubbles involves the growth and collapse stages. The visualized boundary of the cavity cloud can exhibit the growth and collapse processes and can be used to calculate the area of cavity cloud and the strength of cavity flow. Meanwhile, by comparing the predicted boundary with the experimental one, the mathematical model can be validated.
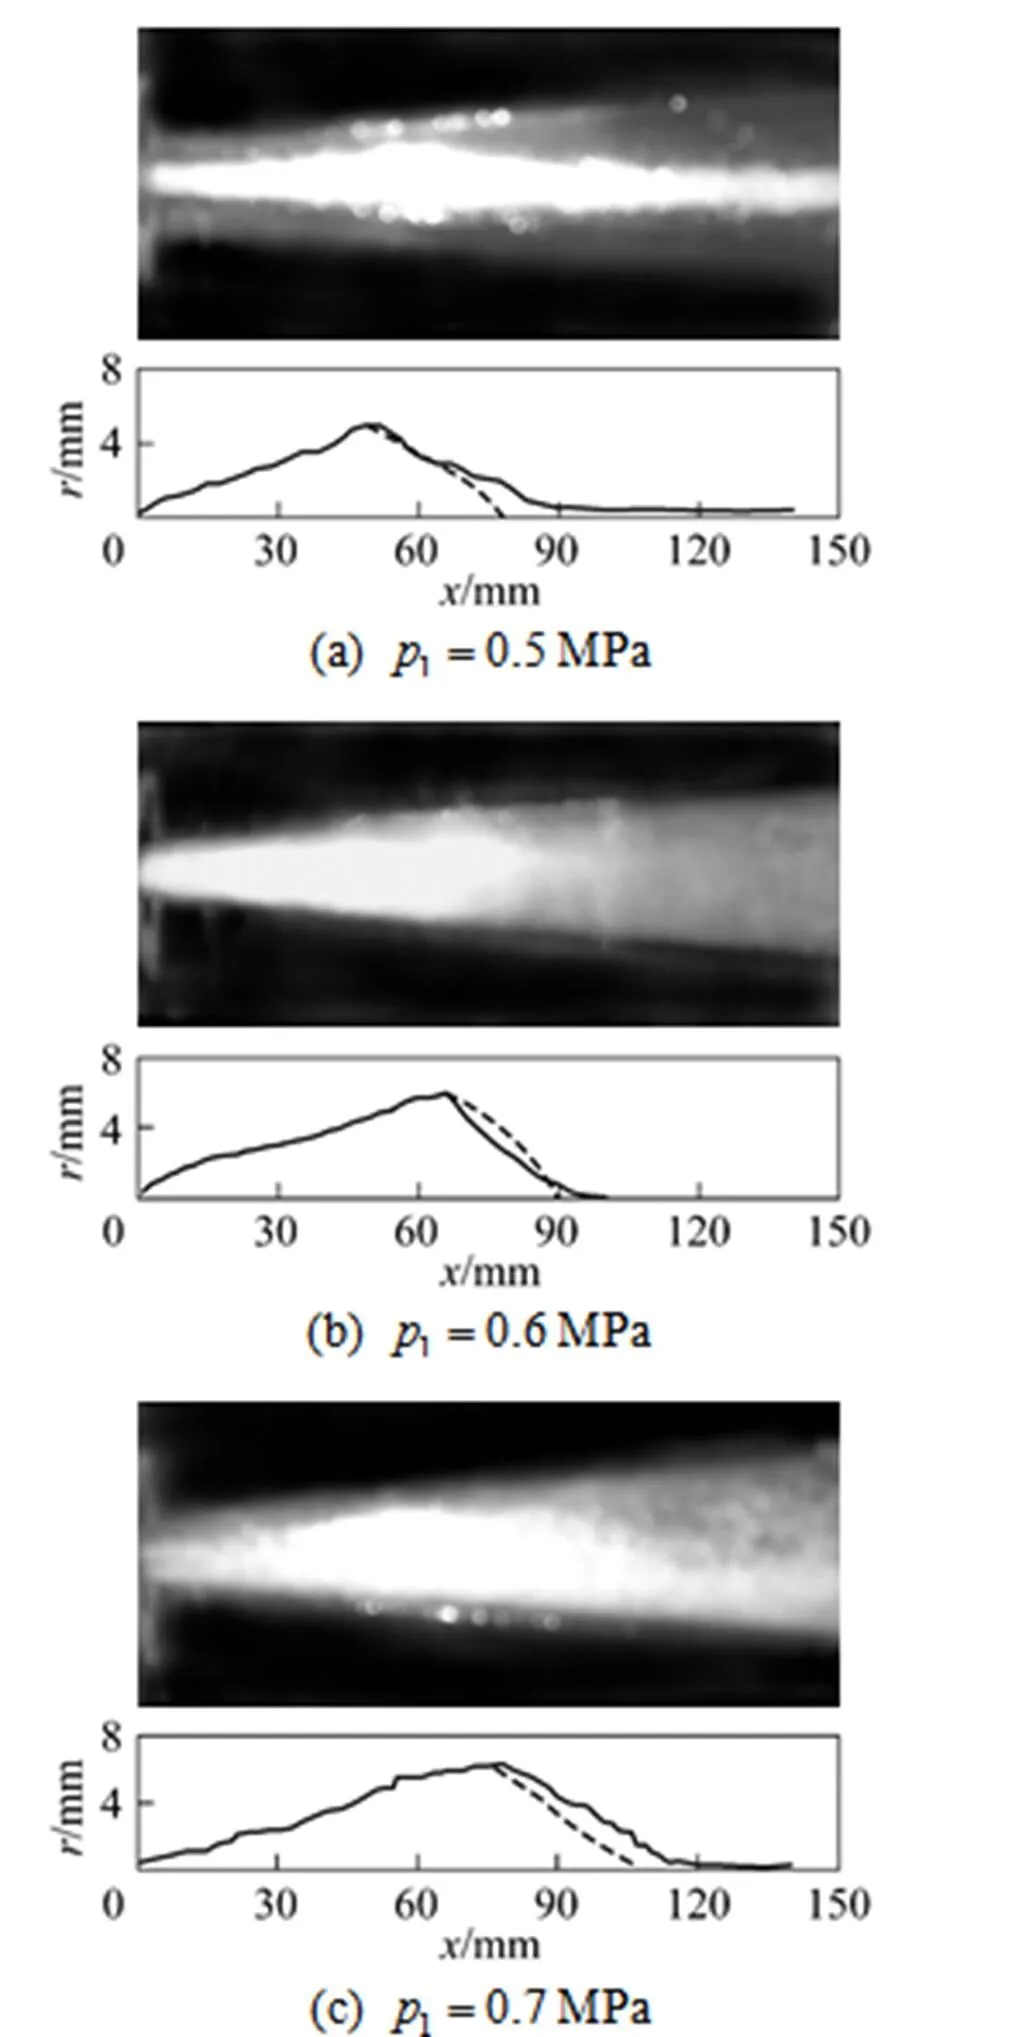


As mentioned above, the evolution of the cavity bubble is very complex, since the mechanism of the interaction between the cavity bubbles is not very clear by now. Only the boundary of the cavity cloud at the collapse stage is simulated in the present study.

5.2 Effects of operating and structure parameters on the collapse pressure
5.2.1

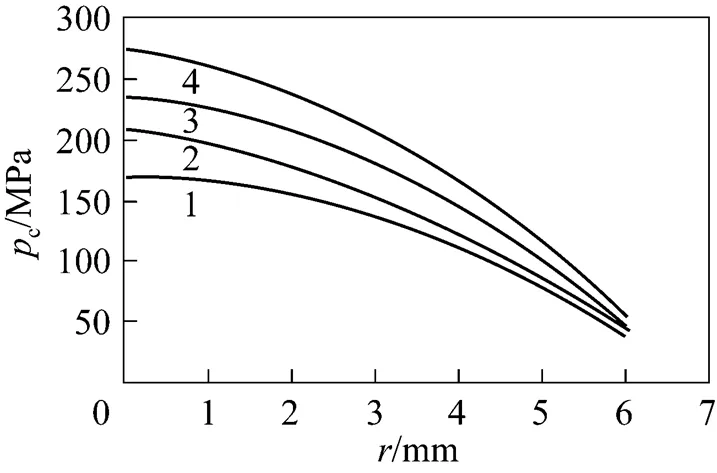

: 1—0.005; 2—0.01; 3—0.03; 4—0.05


5.2.2

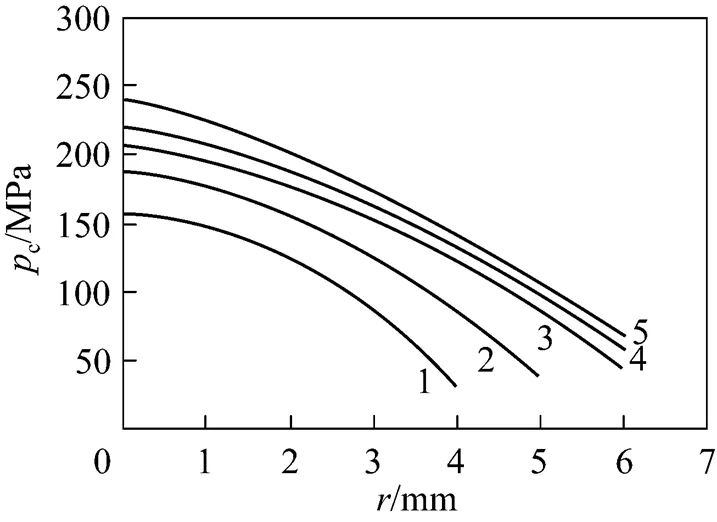

1/MPa: 1—0.4; 2—0.5; 3—0.6; 4—0.7; 5—0.8
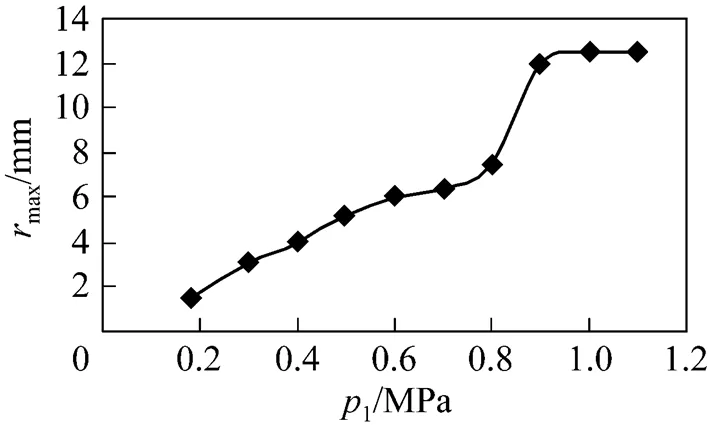
Figure 12 shows the variation of the maximum radius of the cavity cloud measured experimentally with the inlet pressure. It is clearly shown that the maximum radius of the cavity cloud increases with the increase of the inlet pressure, which means more cavity bubbles are formed. When the inlet pressure reaches about 0.8-0.9 MPa, the radius of the cavity cloud increases rapidly and the cavity flow goes into the super cavitation stage at which the Venturi is filled with a large number of bubbles.

5.2.3

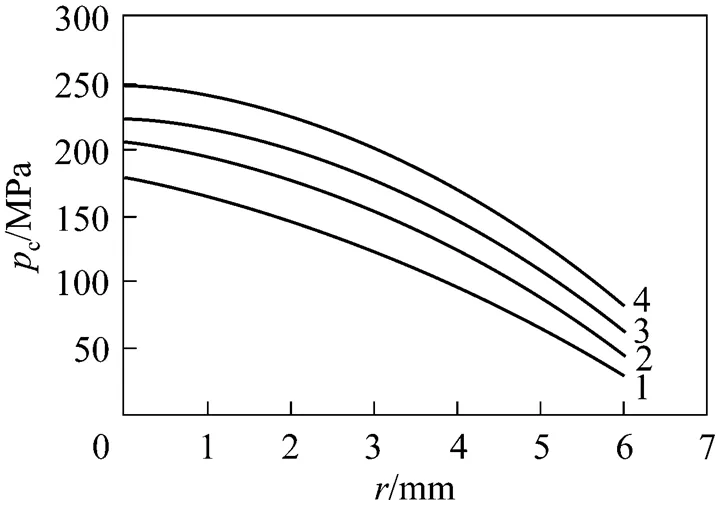

/mm: 1—180; 2—150; 3—120; 4—80
5.2.4

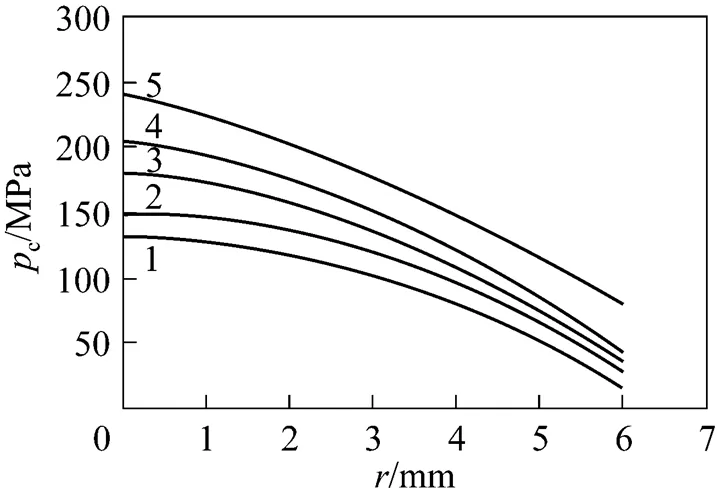

: 1—0.28; 2—0.24; 3—0.20; 4—0.16; 5—0.12
5.2.5


The average relative error is 4.8% in the operating and structure parameters range for the present work.
6 CONCLUSIONS
The present simulation study leads to the following conclusions.
(1) The collapse of the cavity cloud proceeds from its the outer layer towards its inner ones. The driving pressures acting on bubbles in the inner layer equals to the sum of all pulse collapse pressures propagated from collapsed bubbles in each outside layer and the liquid pressure in the far flow field. This results in significant increase of collapse pressure for those inner cavity bubbles.
(2) The simulation indicated that the maximum collapse pressure is as high as several times that at the outside boundary, and it is located at a point on the axial line, where the cavity cloud disappears finally. This means that a cavity cloud has higher collapse pressure or strength than that of a single bubble due to the interactions of the bubbles.
(3) The boundaries of the cavity cloud at the collapse stage in Venturi are successfully simulated for the first time and compared with experimental data. The results obtained using the proposed model can explain not only the geometrical characteristics of the cavity cloud but also why the inner cavity bubbles having higher collapse pressures.
(4) It is also found that the collapse pressure increases with the inlet pressure and initial vapor void fraction, and decreases with the length of expending section and the ratio of throat diameter to pipe diameter. The inlet pressure and the ratio of throat diameter to pipe diameter have more influence on the collapse pressure.
NOMENCLATURE
liquid constant, Pa
local sound velocity in the liquid, m·s-1
¥sound velocity in far field of liquid, m·s-1
mmean distance of the bubbles in cavity cloud, mm
0diameter of the Venturi throat, mm
1diameter of the pipe, mm
liquid enthalpy difference at pressureRandd, kJ·kg-1
length of expansion section, mm
liquid constant
ccollapse pressure, MPa
ddriving pressure on the bubble, MPa
ipressure in the bubble, MPa
maxmaximum of the pulse collapse pressure, MPa
Rliquid pressure on the wall of the bubble, MPa
∞liquid pressure in far field, MPa
1inlet pressure, MPa
radius of the cavity cloud, mm
() bubble radius at time, μm
limcritical radius of the bubble, μm
minfinal radius of collapsed bubble, μm
0initial radius of the bubble, μm
0meanmean initial radius of the bubble, μm
0axial position of maximum diameter of cavity cloud, m
initial vapor void fraction
ratio of Venturi throat diameter to pipe diameter
0number of bubbles in unit volume
viscosity of liquid, Pa·s
surface tension of liquid, N·m-1
1 Suslick, K.S., Mdleleni, M.M., Ries, J.T., “Chemistry induced by hydrodynamic cavitation”,...., 119, 9303-9304 (1997) .
2 Jyoti, K.K., Pandit, A.B., “Effect of cavitation on chemical disinfection efficiency”,., 38, 2249-2258 (2004).
3 Sivakumar, M., Pandit, A.B., “Wastewater treatment: A novel energy efficient hydrodynamic cavitational technique”,.,9, 123-131 (2002).
4 Zhang, X.D., Li, Z.Y., Wu, J., Liu, X.W., Liu, D.X., Xia, Y.J., “Enhancement of chemical reactions by hydrodynamic cavitation”,.... (), 56 (2), 262-265 (2005). (in Chinese)
5 Zhang, X.D., Yang, H.Z., Li, Z.Y., “Relationship between strength of hydrodynamic cavitations and amount of induced hydroxyl radical”,.... (), 58 (1), 27-32 (2007). (in Chinese)
6 Zhang, X.D., Fu, Y., Li, Z.Y., Zhao, Z.C., “The collapse intensity of cavities and the concentration of free hydroxyl radical released in cavitation flow”,...., 16 (4), 547-551 (2008).
7 van Wijngaarden, L., “On the collective collapse of a large number of gas bubbles in water”, In: Proceedings of 11th International Congress of Applied Mechanics, Springer-Verlag, Berlin, 854-861 (1964).
8 d’Agostino, L., Brennen, C.E., “Linearized dynamics of spherical bubble clouds”,.., 199, 155-176 (1989).
9 Kumar, S., Brennen, C.E., “Non-linear effects in the dynamic of clouds of bubbles”,...., 89, 707-714 (1991).
10 Kubota, A., Kato, H., Yamaguchi, H., “A new modelling of cavitating flows: A numerical study of unsteady cavitation on a hydrofoil section”,.., 240, 59-96 (1992).
11 Morch, K.A., “On the collapse of cavity cluster in flow cavitation”, In: Proceedings of the 1st International Conference on Cavitation and Inhomogeneities in Underwater Acoustics, Springer Series in Electrophysics, Springer, Berlin, 95-100 (1980).
12 Morch, K.A., “Cavity cluster dynamics and cavitation erosion”, In: Proceedings of ASME Cavitation and Polyphase Flow Forum, Hoyt, J.W., ed., ASME, New York, 1–10 (1981).
13 Morch, K.A., “Energy considerations on the collapse of cavity cluster”,..., 38, 313-321 (1982).
14 Hanson, I., Kedrinskii, V.K., Morch, K.A., “On the dynamics of cavity clusters”,.., 15, 1725-1734 (1981).
15 Hanson, I., Morch, K.A., “The dynamics of cavity clusters in ultrasonic (vibratory) cavitation erosion”,..., 9, 4651-4658 (1980).
16 Wang, Y.C., Brennen, C.E., “Shock wave development in the collapse of a cloud of bubbles”, ASME Cavitation and Multiphase Flow Forum, FED, 194, 15-20 (1994).
17 Wang, Y.C., Brennen, C.E., “The noise generated by the collapse of a cloud of cavitation bubbles”, ASME/JSME Symposium on Cavitation and Gas-Liquid Flow in Fluid Machinery and Devices, FED, 226, 17-29 (1995).
18 Wang, Y.C., Brennen, C.E., “Numerical computation of shock waves in a spherical cloud of cavitation bubbles”,.., 121, 872-880 (1999).
19 Reisman, G.E., Brennen, C.E., “Pressure pulse generated by cloud cavitation”, ASME Symposium on Cavitation and Gas-Liquid Flows in Fluid Machinery and Devices, FED, 236, 319-328 (1996).
20 Reisman, G.E., Wang, C., Brennen, C.E., “Observation of shock waves in cloud cavitation”,.., 355, 255-283 (1998).
21 Kanthale, P.M., Gogate, P.R., Pandit, A.B., Wilhelm, A.M., “Dynamics of cavitational bubbles and design of a hydrodynamic cavitational reactor: Cluster approach”,.., 12, 441-452 (2005).
22 Huang, J.B., Ni, H.G., “On the pressure generation by the collapse of a travelling cavitation bubble cluster in a compressible liquid”,.., 2 (3), 1-11 (1987).
23 Huang, J.T., Fundamental and Application of Cavitation and Cavitation Erosion, Tsinghua University Press, Beijing (1991). (in Chinese)
24 Li, R.H., Feng, G.C., Numerical Solution of Differential Equations, Chinese Higher Education Press, Beijing (1996). (in Chinese)
25 Kanthale, P.M., Gogate, P.R., Pandit, A.B., Wilhelm, A.M., “Cavity cluster approach for quantification of cavitational intensity in sonochemical reactors”,.., 10, 181-189 (2003).
2009-02-17,
2009-09-25.
the National Natural Science Foundation of China (10472024).
** To whom correspondence should be addressed. E-mail: zhangxd56@163.com
 Chinese Journal of Chemical Engineering2009年6期
- Chinese Journal of Chemical Engineering的其它文章
- Effect of Working Temperature on the Resistance Characteristic of aPleated Stainless Steel Woven Filter*
- Performance of Inner-core Supersonic Gas Separation Device with Droplet Enlargement Method*
- Void Fraction Distributions in Cold-gassed and Hot-sparged Three Phase Stirred Tanks with Multi-impeller*
- Kinetics of COD Removal in a Biological Aerated Filter in thePresence of 2,4,6-Trinitrophenol (Picric Acid)*
- Representation of Phase Behavior of Ionic Liquids Using the Equation of State for Square-well Chain Fluids with Variable Range*
- Proton-exchange Sulfonated Poly(ether ether ketone)/SulfonatedPhenolphthalein Poly(ether sulfone) Blend Membranes in DMFCs*
