Identification of different degrees of processed ginger using GC-IMS combined with machine learning
Shuang Liu , Hongjing Dong , Minmin Zhang , Wei Geng , Xiao Wang ,*
a Key Laboratory for Applied Technology of Sophisticated Analytical Instruments of Shandong Province,Shandong Analysis and Test Center,Qilu University of Technology (Shandong Academy of Sciences), Jinan, 250014, China
b Key Laboratory for Natural Active Pharmaceutical Constituents Research in Universities of Shandong Province, School of Pharmaceutical Sciences, Qilu University of Technology (Shandong Academy of Sciences), Jinan, 250014, China
c Shandong Provincial Maternal and Child Health Care Hospital Affiliated to Qingdao University, Jinan, 250014, China
Ginger, the rhizomes of Zingiber officinale Roscoe, was a wellknown edible plant species commonly used in China, which has pungent flavor [1].Ginger has numerous chemical compounds,such as phenolic constituents, volatile compounds (VOCs), and polysaccharides [2].Among them, VOCs are considered one of the effective compounds in ginger due to their functional properties,including anti-inflammatory,antioxidant,and analgesic[3].Ginger has four different degrees of processed products, including fresh ginger(SJ),dried ginger(GJ),baked ginger(PJ),and ginger charcoal(JT), and they have different types and contents of VOCs [4].However, the processing process of ginger is difficult to control as the identification of different degrees of processed ginger mainly depends on the subjective evaluation of the pharmacists, such as appearance color,shape,and texture[4].Compared with subjective evaluation,instrument analysis is more objective and accurate.
In this study, headspace-gas chromatography-ion mobility spectrometry (HS-GC-IMS) and machine learning are employed to analyze VOCs and discriminate different degrees of processed ginger.We commenced by collecting different batches of SJ and making different degrees of processed ginger according to China pharmacopoeia 2020 Edition.The authenticity of these samples was evaluated by traditional Chinese medicine experts.The VOCs from different degrees of processed ginger were analyzed by HSGC-IMS.The analytical conditions are recorded in Table S1.A total of eighty VOCs were identified in the different degrees of processed ginger (Table S2).The abbreviation of VOCs is shown in Table S3.The 3D chromatograms and the top view of GC-IMS 3D chromatograms of VOCs in different degrees of processed ginger are shown in Figs.S1A and B, respectively.
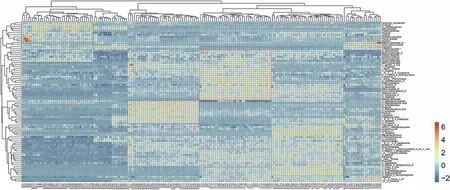
The heatmap of different degrees of processed ginger was formed based on the peak signal in the top view of 3D chromatograms.As shown in Fig.1, some aldehydes and esters were mainly divided in the blue box,and the higher content of these compounds indicated that they are primarily present in SJ.Some alcohols and acids were mainly divided in the purple box, and the higher content of these compounds indicated that they are primarily present in GJ.The above results may be caused by the oxidation of chemical compounds at high temperatures, wherein more aldehyde compounds are oxidized into acid compounds.Some alcohols,ketones and heterocyclic compounds were mainly divided in the green box,and the higher content of these compounds suggested that they are primarily present in PJ.The above results can be attributed to the Maillard reaction due to the ketones are the products of the fragmentation of hydroxyl and carbonyl groups in the second stage of the Maillard reaction[5].Some esters and ketones were mainly divided in the pink box, and the higher content of these compounds suggested that they are primarily present in JT.In a word,the oxidation and Maillard reaction may occur in the stir-frying process of ginger.
Additionally, the principal component analysis (PCA) is performed in this work to further understand the differences in the VOCs of different degrees of processed ginger(Fig.S1C).The result of the classification distance suggested that PJ and JT were close to each other, which could be attributed to the bias between subjective judgment results and actual results (subjectively mistaking PJ for JT).Moreover, the classification distance between SJ and other groups was the furthest, which might be related to the types and content of VOCs.

Fig.1.The heatmap of volatile compounds (VOCs) in the different degrees of processed ginger.
Subsequently,machine learning algorithms were used to screen indicator compounds and to quickly discriminate different ginger processed products, including partial least squares-discriminant analysis (PLS-DA), ridge regression, and elastic network.The VIP>1, |coef| >0.1239, and coef >0.0734 were set as screening conditions of these algorithms, respectively (Figs.S2A-C).As shown in Fig.S2D, a total of nine indicator compounds were screened, and their content in different degrees of processed ginger was different,which suggested that these indicator compounds could be used for training machine learning models (Figs.S2E and S3).
Secondly,as shown in Table S4,based on the screened indicator compounds,ten machine learning algorithms were used to predict different degrees of processed ginger.Machine learning algorithms can predict four possible results: true positive (TP), true negative(TN), false positive (FP), and false negative (FN).Predicted results including precision, recall,F1 score,and accuracy are calculated to evaluate model performance based on the number of predicted outcomes in each of the four categories,as defined by the following formulas:
Before analysis,the data are divided into training set and testing set by random sampling process in a ratio of 8:2 (Table S5).Then,four performance metrics, namely precision, recall, F1 score, and accuracy, were assessed (Table S6).The accuracy of all machine learning algorithms was over 0.91,indicating that they all had good classification ability.Additionally, most machine learning models had good performance in classifying SJ and GJ.The top three machine learning algorithms(support vector machine with the linear kernel(SVM-L),logistic regression(LR)and quadratic discriminant analysis (QDA)) achieved high prediction accuracy due to their mathematical properties.Meanwhile, SVM-L tended to have a simpler decision boundary,which could make it easier to interpret and implement in practical applications.LR was a linear model that provides coefficients associated with each feature,allowing for easy interpretation.QDA required relatively few computational resources for training and prediction.Therefore, the influence of factors such as model complexity, interpretability and required computational resources were considered,these models were wellsuited for developing a prediction model to classify the different degrees of processed ginger.As shown in Fig.S4, the confusion matrix was displayed.The results of these machine learning algorithms showed satisfactory classification results, whereas some misclassifications occurred between PJ and JT in the confusion matrix.The results of these machine learning models were acceptable and they could be applied in the prediction of different degrees of processed ginger.
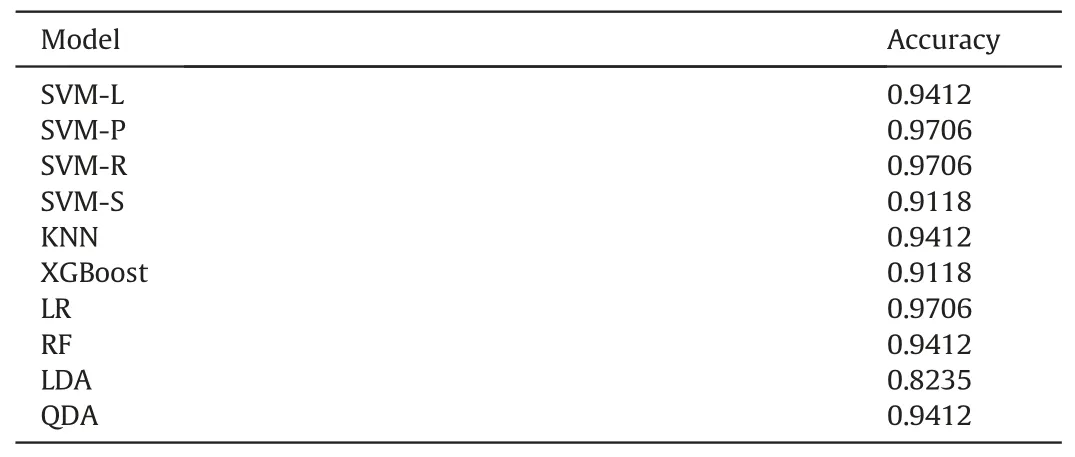
Finally,the testing set was used to verify the predicted ability of these models.The confusion matrix of the predicted results for these models in the testing set is shown in Fig.S5.Similarly,some misclassifications also occurred between PJ and JT in the confusion matrix,which could be attributed to misclassification of the model for PJ and JT in the training set, leading to misclassification of the model for PJ and JT in the testing set.More data might be needed to assist the model in predicting these two classes and optimize the model.Furthermore, another reason was that PJ and JT were very similar in some features,which were not obvious and were difficult to distinguish.This behavior could be explained by the results of PCA.The accuracy of models in testing set is listed in Table 1.The SVM-L, LR, and QDA also showed high accuracy.These behaviors indicated that these machine learning models had high stability,reliability, and reproducibility, making them suitable for different degrees of processed ginger.
In summary, this study identified different degrees of processed ginger based on HS-GC-IMS and machine learning.A total of eighty VOCs were identified using HS-GC-IMS.Among them,nine VOCs,such as hydroxyacetone and 2-hexanol,were regarded as indicator compounds.Additionally,based on the nine indicator compounds, ten machine learning models for identification of processed degrees showed good prediction ability.Among them,SVM-L, LR and QDA models can accurately identify different degrees of processed ginger, with accuracies of 0.9412, 0.9706, and 0.9412 in testing set, respectively.Meanwhile, these models showed many advantages,such as easy interpretation,low model complexity and few computational resources.Overall, threemodels, including SVM-L, LR and QDA, had obvious potential applications in the identification of different degrees of processed ginger.Meanwhile, the HS-GC-IMS combined with machine learning offers a simple, quick, and low-cost strategy for discriminating different degrees of processed ginger.

Table 1 The accuracy of ten machine learning algorithms in testing set.
CRediT author statement
Shuang Liu: Methodology, Visualization, Writing - Original draft preparation, Reviewing and Editing;Hongjing Dong: Resources, Project administration;Minmin Zhang: Data curation,Writing - Reviewing and Editing;Wei Geng: Formal analysis, Resources;Xiao Wang: Project administration, Supervision.
Declaration of competing interest
The authors declare that there are no conflicts of interest.
Acknowledgments
This research was predominantly funded by Key R&D Program of Shandong Province (Program No.: 2021CXGC010508), Science,Education and Industry Integration Innovation Pilot Project from Qilu University of Technology (Shandong Academy of Sciences)(Project No.: 2022JBZ02-04), The new innovative team of Jinan(Project No.: 202228020), Shandong Province Taishan Scholar Program(Project No.:tstp20221138).
Appendix A.Supplementary data
Supplementary data to this article can be found online at https://doi.org/10.1016/j.jpha.2023.10.005.
 Journal of Pharmaceutical Analysis2024年1期
- Journal of Pharmaceutical Analysis的其它文章
- Platycodin D inhibits angiogenic vascular mimicry in NSCLC by regulating the eIF4E-mediated RNA methylome
- Simultaneously quantifying hundreds of acylcarnitines in multiple biological matrices within ten minutes using ultrahigh-performance liquid-chromatography and tandem mass spectrometry
- A proteomic landscape of pharmacologic perturbations for functional relevance
- Licorice-saponin A3 is a broad-spectrum inhibitor for COVID-19 by targeting viral spike and anti-inflammation
- Distinct molecular targets of ProEGCG from EGCG and superior inhibition of angiogenesis signaling pathways for treatment of endometriosis
- Hydralazine represses Fpn ubiquitination to rescue injured neurons via competitive binding to UBA52
