A method for support stiffness failure identification in a steel spring floating slab track of urban railway: a case study in China
Junyuan ZHENG, Caiyou ZHAO, Duojia SHI, Ping WANG, Jian WANG, Bolong JIANG, Xi SHENG
Research Article
A method for support stiffness failure identification in a steel spring floating slab track of urban railway: a case study in China

1Key Laboratory of High-speed Railway Engineering, Ministry of Education, Southwest Jiaotong University, Chengdu 610031, China2School of Civil Engineering, Southwest Jiaotong University, Chengdu 610031, China301 DYNA (Qingdao) Test & Data Co., Ltd., Qingdao 266000, China4Rail Transit Digital Construction and Measurement Technology National Engineering Research Center, China Railway Design Corporation, Tianjin 300308, China5Institute of Urban Smart Transportation & Safety Maintenance, Shenzhen University, Shenzhen 518060, China
The extensive use of steel spring floating slab tracks has effectively addressed the challenge of alleviating the environmental vibrations induced by urban rail transit systems. However, under the combined action of train dynamic loads and complex environmental factors, problems, such as the fracture of steel spring vibration isolators and suspension vibrations induced by the uneven settlement of the base, often occur. The failure of isolator support stiffness is often hidden in its early stages and is challenging to identify by conventional detection methods. At the same time, it will aggravate the wheel–rail interaction, accelerate the deterioration of track structure, and even affect the driving safety. This study first establishes a detailed coupled train-floating slab track-foundation analytical model. Then the influence of the vibration isolator support stiffness failure on the dynamic indices of the floating slab track system response is analyzed. A set of defect identification methods that can detect the number of failed steel springs, severity of damage, and their location is proposed. Finally, an intelligent monitoring system for support stiffness of floating slab track is built by combining the density-based spatial clustering of applications with noise algorithm and statistical data analysis and is applied to a rail line in southern China. During a three-year monitoring campaign, a suspension failure and a fracture of a steel spring were each successfully detected and detailed failure information was obtained. Field investigation results were consistent with the damage identification results. After repair, the track structure dynamic response returned to the average pre-damage level and further deterioration had been arrested. The proposed damage identification methods and monitoring system provide an approach for intelligent identification of track structure support stiffness failures.
Floating slab track; Support stiffness; Detailed analytical model; Failure identification; Monitoring system
1 Introduction
With the increase in train line length and train speeds, the environmental vibrations caused by urban rail transit systems are becoming increasingly serious. Vibration reduction measures for metro lines can be divided into three types according to their different implementation locations. At the vibration source, many measures, such as floating slab track bed (Tamagawa, 2021), damping fasteners (Cui et al., 2016), and elastic sleepers (Auersch, 2017), can be used to weaken the propagation of vibration energy at the wheel–rail contact location and thus reduce the vibration energy input to the soil. Along the propagation path, vibration isolation trenches (Sitharam et al., 2018) and rigid barriers can be used for vibration isolation. Measures such as foundation isolation systems (Talbot, 2016) can be introduced for vibration control. The control measures at the vibration source reduce the outward spreading of vibration energy from the source and are more widely used. The floating slab track bed has a better vibration reduction performance than other measures applied at the vibration source. In the floating slab track bed, instead of the traditional cast-in-place track bed and foundation, a track slab elastically supported by steel springs (Bashir and Akhtar, 2022) or rubber pads (Yuan et al., 2020) is adopted. The basic structure is shown in Fig. 1. The existence of elastic support makes the inertia of the floating slab absorb the dynamic train loads and reduce the vibration transmission from the track to the substructure (Wilson et al., 1983).
Although steel spring floating slabs have the best vibration isolation effect, up to 30 dB (Zou et al., 2022), many studies have recently attempted to further improve their performance (Nelson et al., 2018; Wang et al., 2022). However, the steel springs not only damp vibrations but also carry all the static and dynamic loads of trains and the track. In addition to determining the vibration damping performance, their condition directly affects the running condition and even the running safety of trains. There is currently a lot of research on track support failure. Dersch et al. (2021) proposed reducing fastener failure through parameter optimization using a finite element method but did not conduct an experimental verification. Yu et al. (2021) studied the pull-out resistance of different materials of sleepers and proposed a prediction formula for pull-out resistance. Lam et al. (2012) studied the relationship between ballast damage and sleeper vibration, providing ideas for damage detection. Ramos et al. (2021) compared the settlement performance of ballast and slab railway track structures in the laboratory and obtained consistent numerical results.
However, relatively little research has been conducted on the failure of steel springs in floating slab track. Xu et al. (2020) established a 2D coupled train-floating slab track model and analyzed the influence of the number of failed springs on soil vibrations in combination with a finite element model. However, their model did not consider the spatial distribution of failed springs. Zhao et al. (2019) established a 3D coupled train-floating slab-track dynamic model, studied the effect of spring failure location on the train track dynamic responses, and concluded that spring failures at the slab ends are more harmful to driving safety and environmental vibrations.
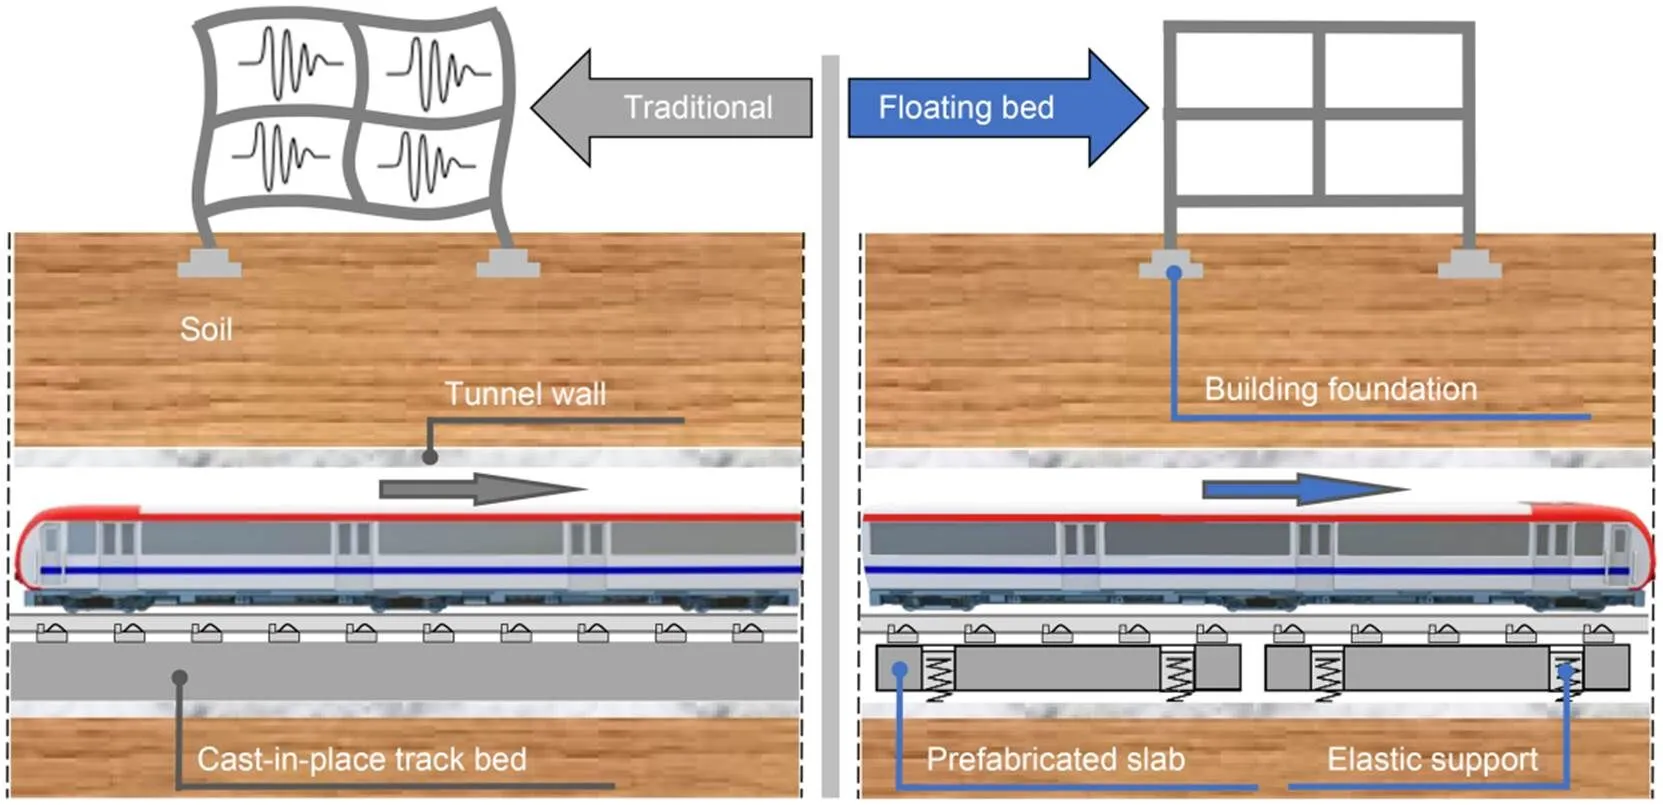
Fig. 1 Comparison between traditional track bed and floating slab track bed
The above studies mainly focused on the adverse effects of steel spring failures. These harmful effects can be avoided if the spring failure is detected early. Generally, structural damage detection methods analyze the dynamic responses of the structure and detect structural damage from changes in the natural frequencies (Dilena et al., 2015), modal shapes (Gomes and Giovani, 2022), or flexibility matrix (Wickramasinghe et al., 2020). However, these approaches have several shortcomings (Zhu et al., 2021). For example, damage usually only affects the local response of the structure, which requires proper arrangement of sensors to be detectable. Modal shape measurement requires high accuracy and is easily affected by noise and human error. The flexibility matrix method requires prior knowledge of the undamaged structure.
In addition to these traditional monitoring methods, some novel detection methods have been studied and applied in rail transit. The identification of suspension has been extensively carried out in vehicles. Ankrah et al. (2020) used vehicle acceleration combined with a support vector machine to predict the fault state of suspension systems. Similarly, Hong et al. (2020) proposed a data-driven framework for identifying suspension system status through train vibration. Some scholars also use train vibration for track state evaluation (Cong et al., 2020), but separating the influence of suspension system and track state is a challenge which makes this method difficult for stiffness failure identification of steel springs. For the track structure, damage detection approaches frequently use visual, ultrasonic, or electromagnetic inspections for identifying rail damage (Loveday et al., 2020), fastener failure (Chandran et al., 2022), and track slab cracking (Li et al., 2020). However, these technologies require access to the inspected element surface, but the steel springs are wrapped by sleeves and are therefore inaccessible. The spring break indicator developed in recent years tries to address this challenge. If a steel spring is broken, an indicator light will switch on. However, the device has many shortcomings: each steel spring requires an individual indicator, the light will not turn on until a certain degree of fracture is reached, and the degree of suspension cannot be displayed. In addition, the light can only by detected by night patrols rather than monitored in real-time. Conventional vibration monitoring of track structure is easy to implement but signal anomaly detection is challenging. On the one hand, the conventional time-domain data change little, so it is difficult to identify failure whereas; on the other hand, the regular detection cycle is long and its time is short. Even if abnormal data are found, the failure may already be severe. If failure can be discovered early, the maintenance costs can be significantly reduced. Zhu et al. (2021) proposed a failure detection method based on a convolution neural network using the vibration data from a floating slab, but their approach required undamaged and damaged data sets, which is difficult to satisfy in the field.
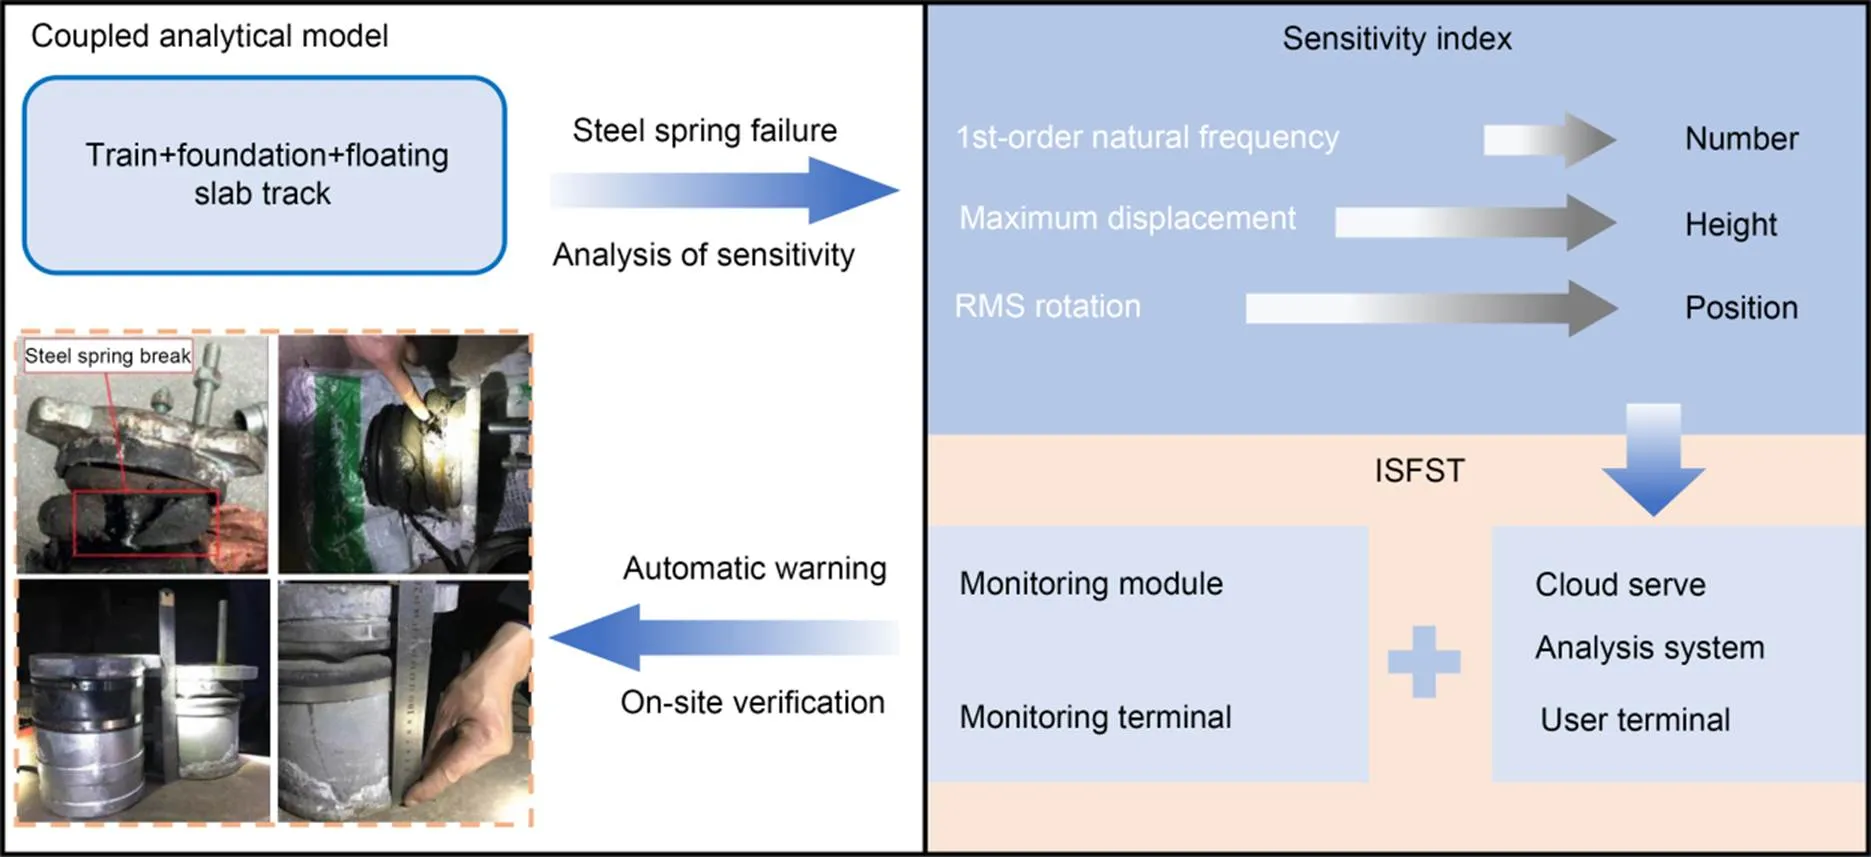
Fig. 2 Proposed technology structure. RMS: root mean square
This study presents a more straightforward method to identify the number, degree, and location of steel spring failures. Firstly, a refined train-floating slab track-foundation analytical model is established and the sensitivity of various floating slab dynamic response indices to failure is analyzed. Methods for identifying the failure of steel springs are proposed based on the specific sensitive dynamic response indices. Based on the proposed method, an intelligent monitoring system for the support stiffness of the floating slab track (ISFST) system was developed and applied in the field, where it detected steel spring failures. An on-site inspection confirmed the failure identification results. Furthermore, the monitoring data returned to normal pre-damage values after repairs. The structure of the proposed technology is shown in Fig. 2. Although steel spring support failure is studied in this paper, the proposed method will be applicable to other types of supports as well.
2 Detailed coupled train‒floating slab track‒foundation analytical model
The developed coupled train‒floating slab track‒foundation dynamic model comprises three subsystems: the train, the track, and the foundation, as shown in Fig. 3.,, andrefer to the translational directions.,, andrefer to the rotational directions. The subscripts c, w, and t refer to the train body, wheel, and bogie, respectively. The subscripts s and p refer to the first and second suspensions, respectively. The train is a multi-rigid body structure, while the track and foundation are flexible bodies. The train consists of six A-type vehicles, each consisting of a train body, two bogies, four wheelsets (Chinese LMA tread), and eight axle boxes. The train body and bogies have three translational and three rotational degrees of freedom (DOFs), while the wheelsets have two translational DOFs (the translation in the-direction is realized through the specified train driving speed) and three rotational DOFs. The wheels and axle box are connected through primary springs and dashpots, and the bogies and train body are connected through secondary springs and dashpots. The train parameters are listed in Table 1. The track and foundation model comprise, from top to bottom, the rails, fasteners, floating slabs, steel springs, substrates, and soil. A Timoshenko beam was used to simulate the rail and the finite element method was adopted to model the floating slabs and foundation. The rail was connected to the floating slabs through the fasteners (6-DOF spring-dashpot elements), the floating slabs were connected to the foundation through steel springs (3-DOF spring-dashpot elements), and eventually the foundation was connected to the soil. The longitudinal spacing of fasteners was 0.6 m and the transverse spacing was 1.5 m. The longitudinal spacing of steel springs was 1.6 m, while the transverse spacing was 1.5 m. The slabs were connected by shear hinges (simulated by 3-DOF springs with a large stiffness) to ensure the consistency of slab end displacements.
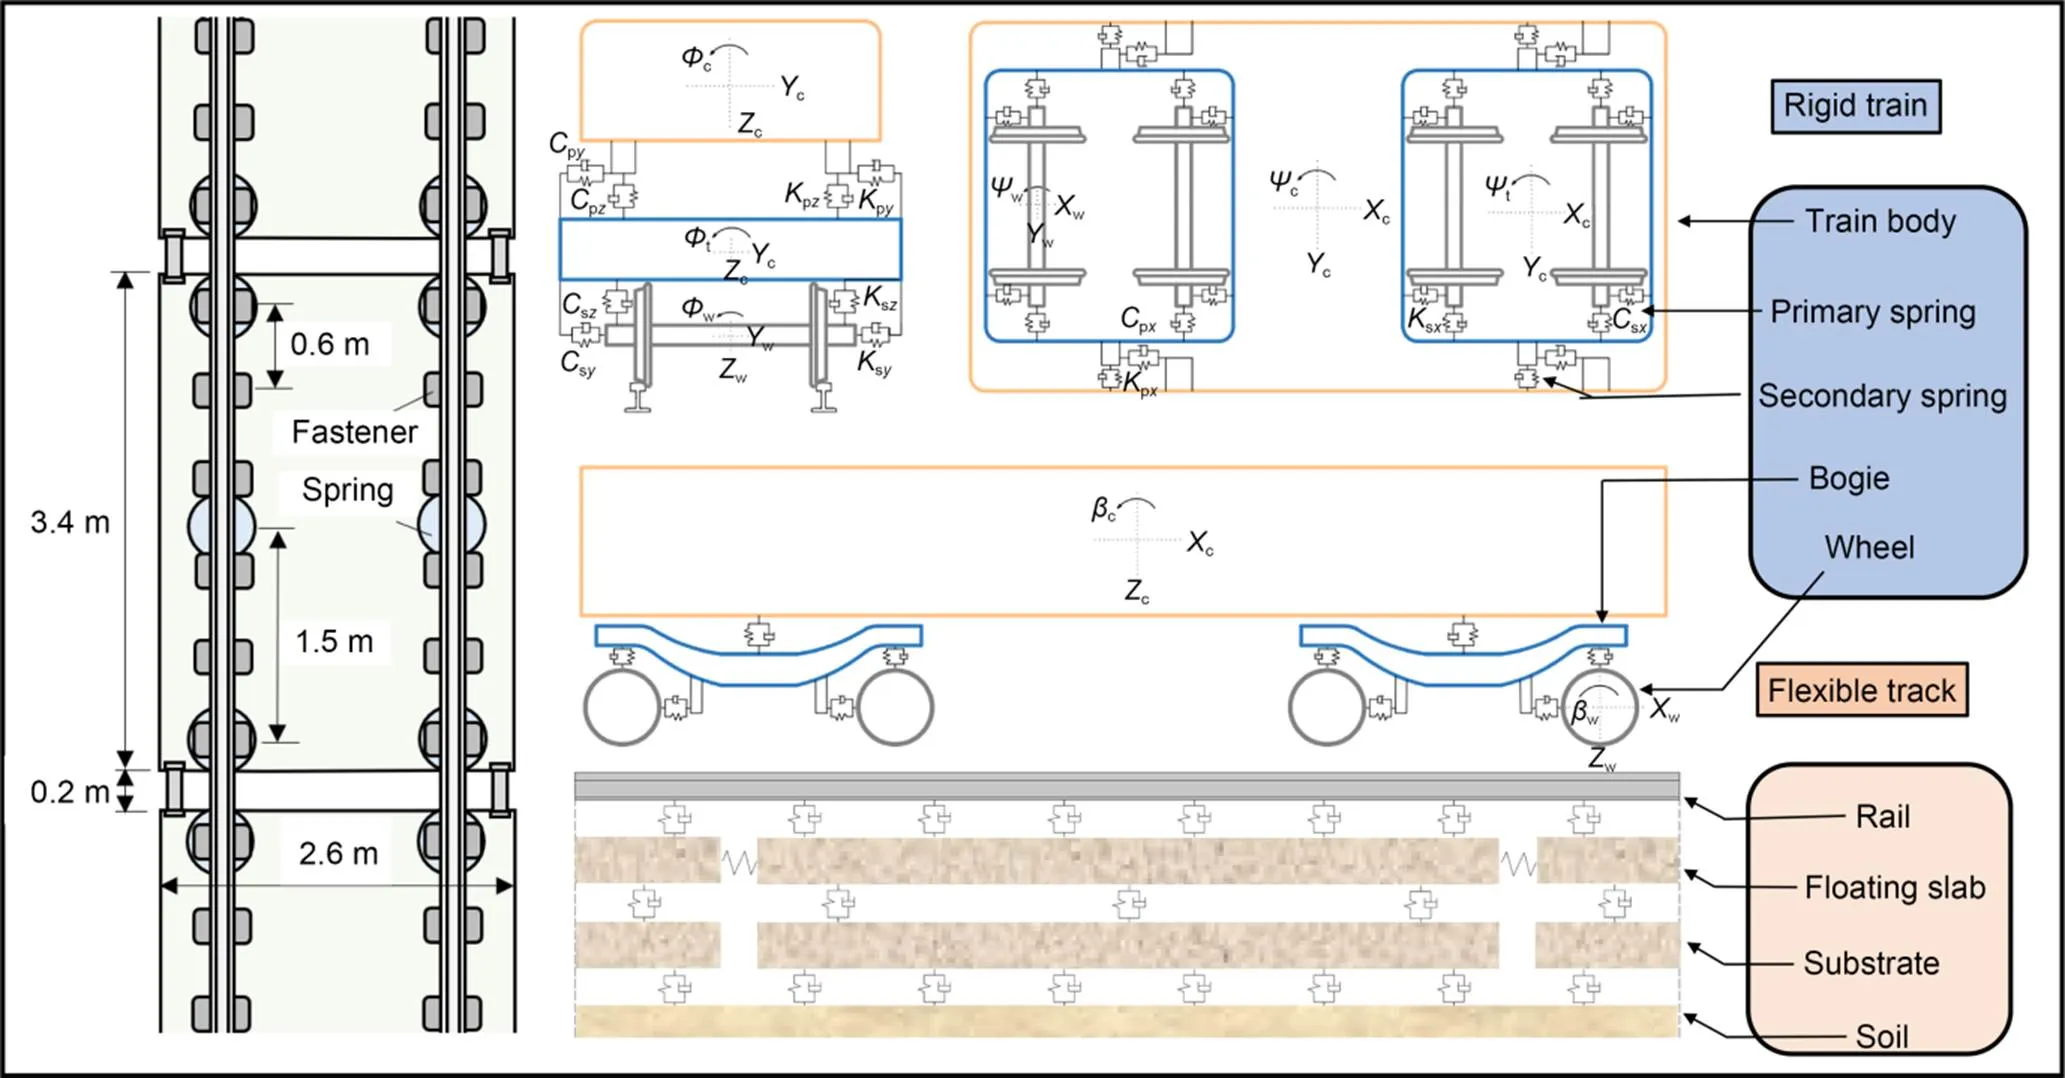
Fig. 3 Train structure

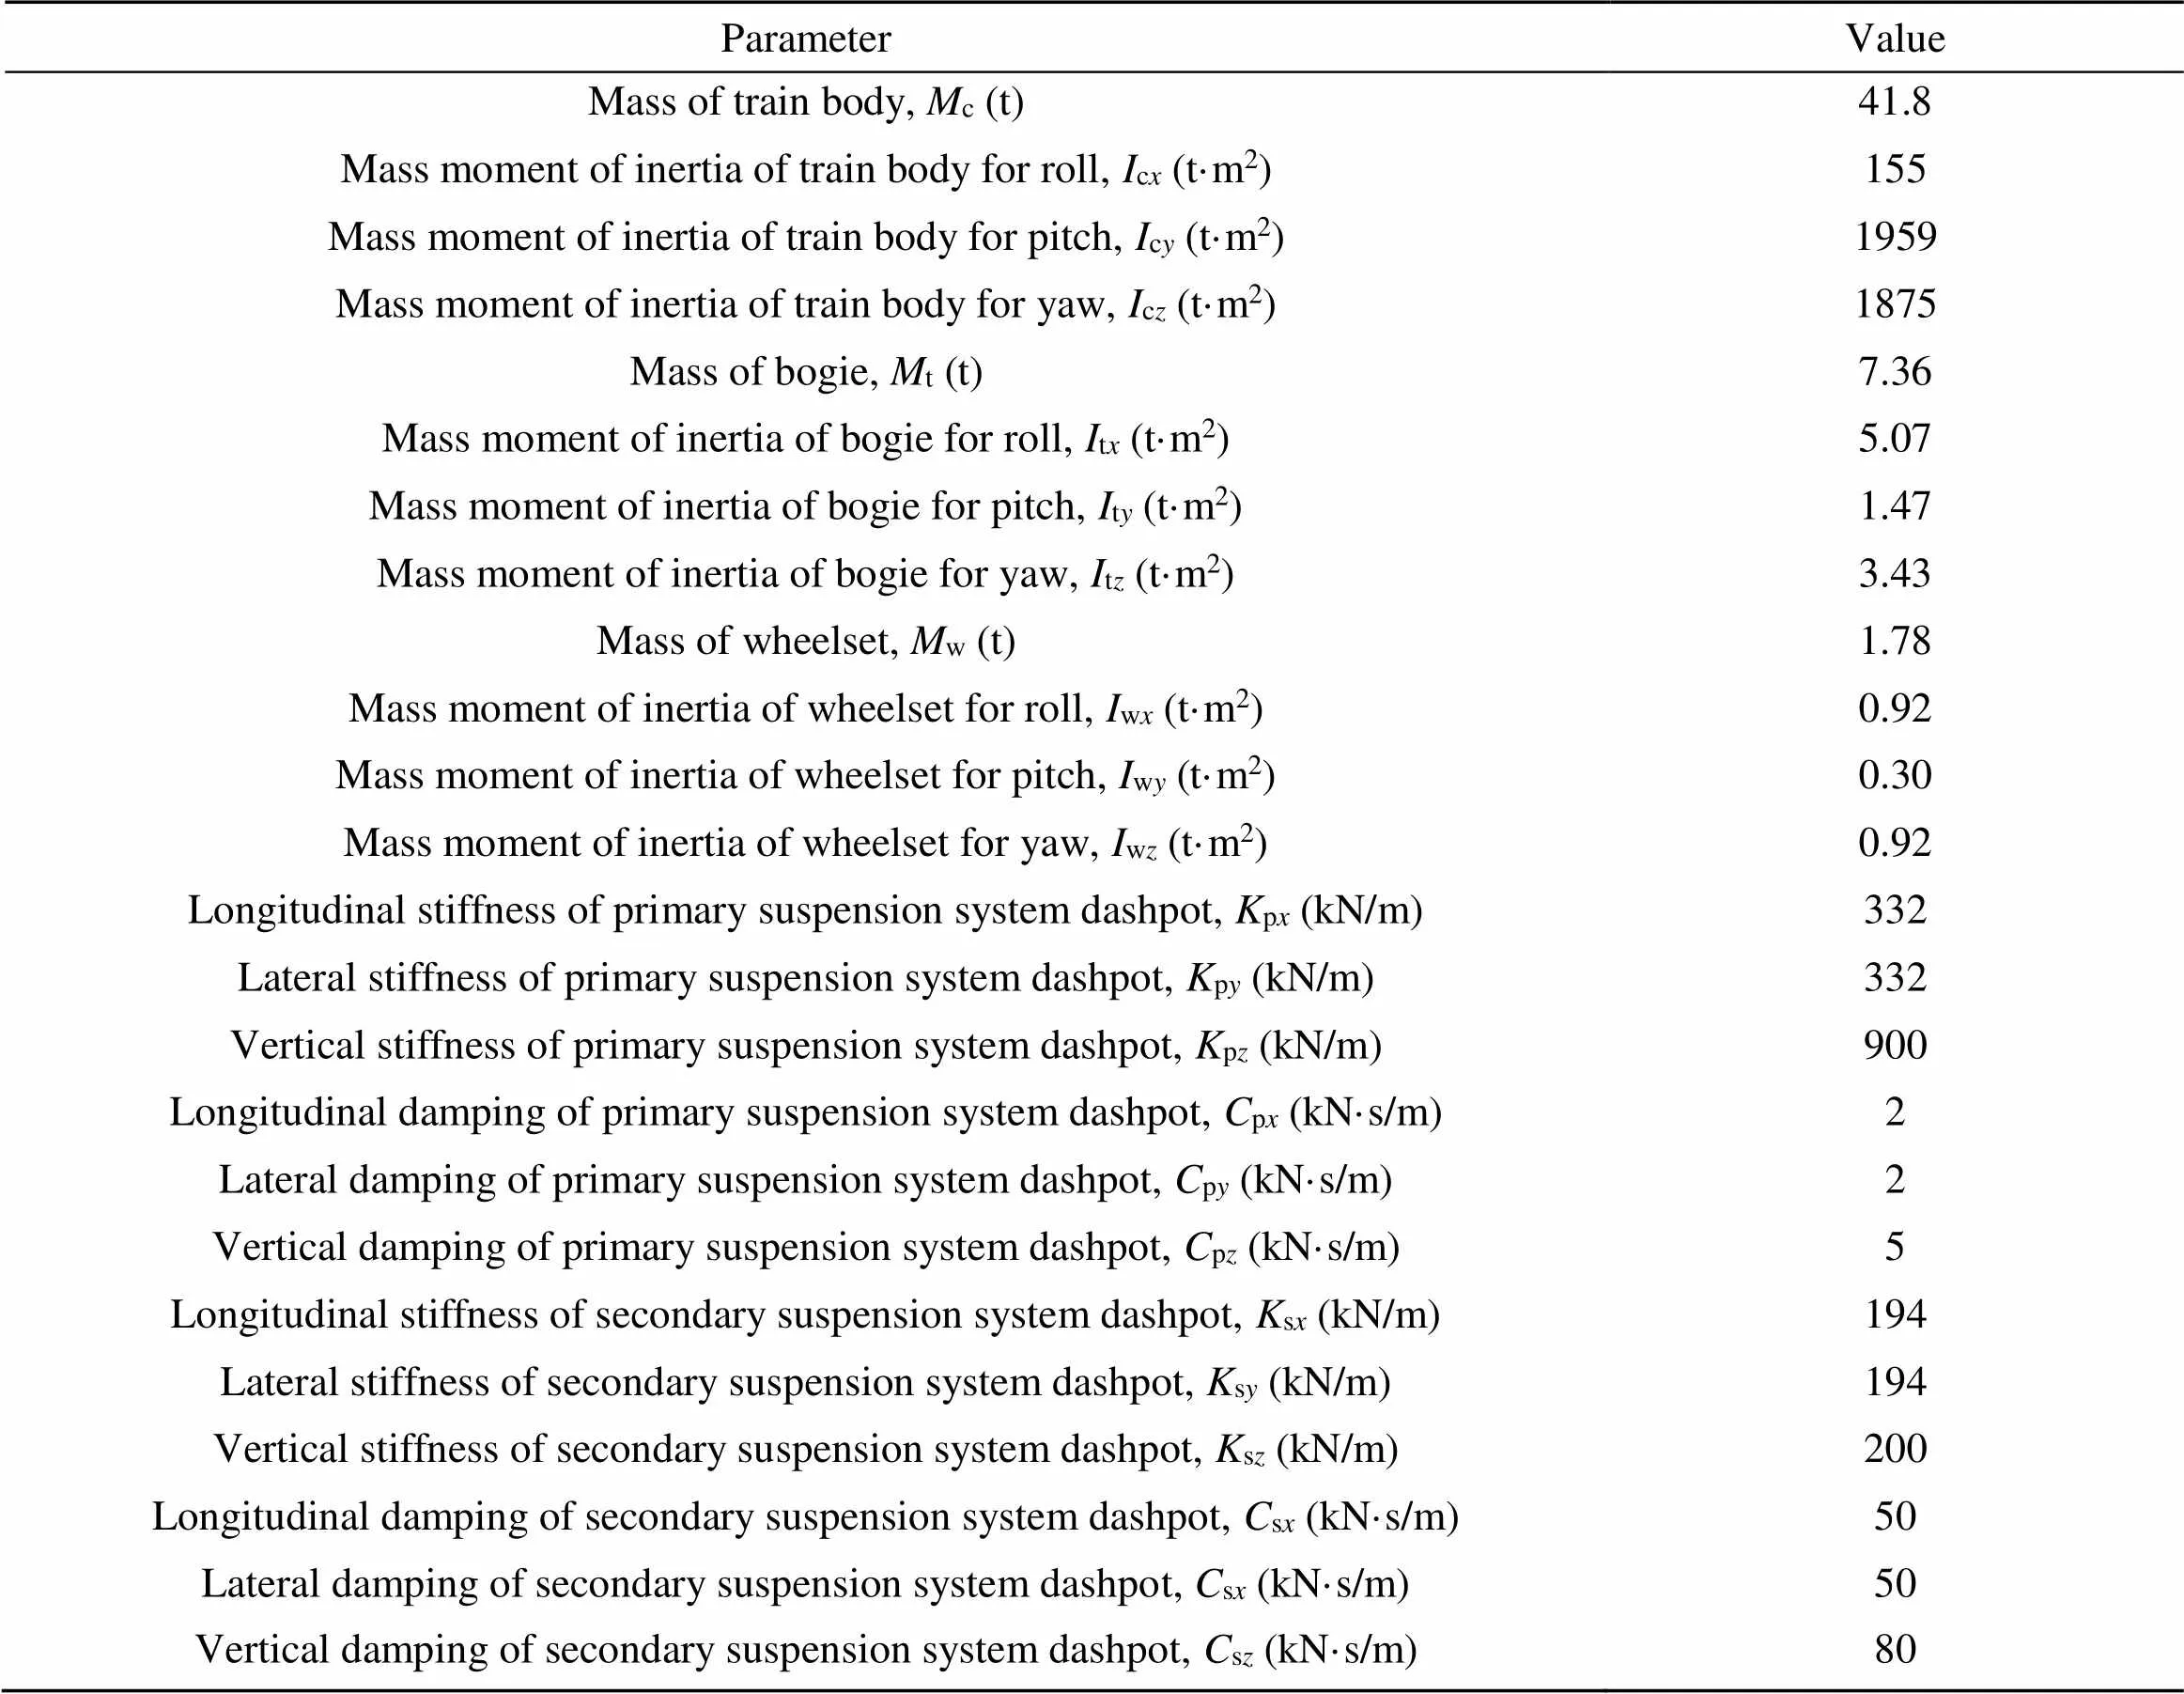
Table 1 A-type train parameters
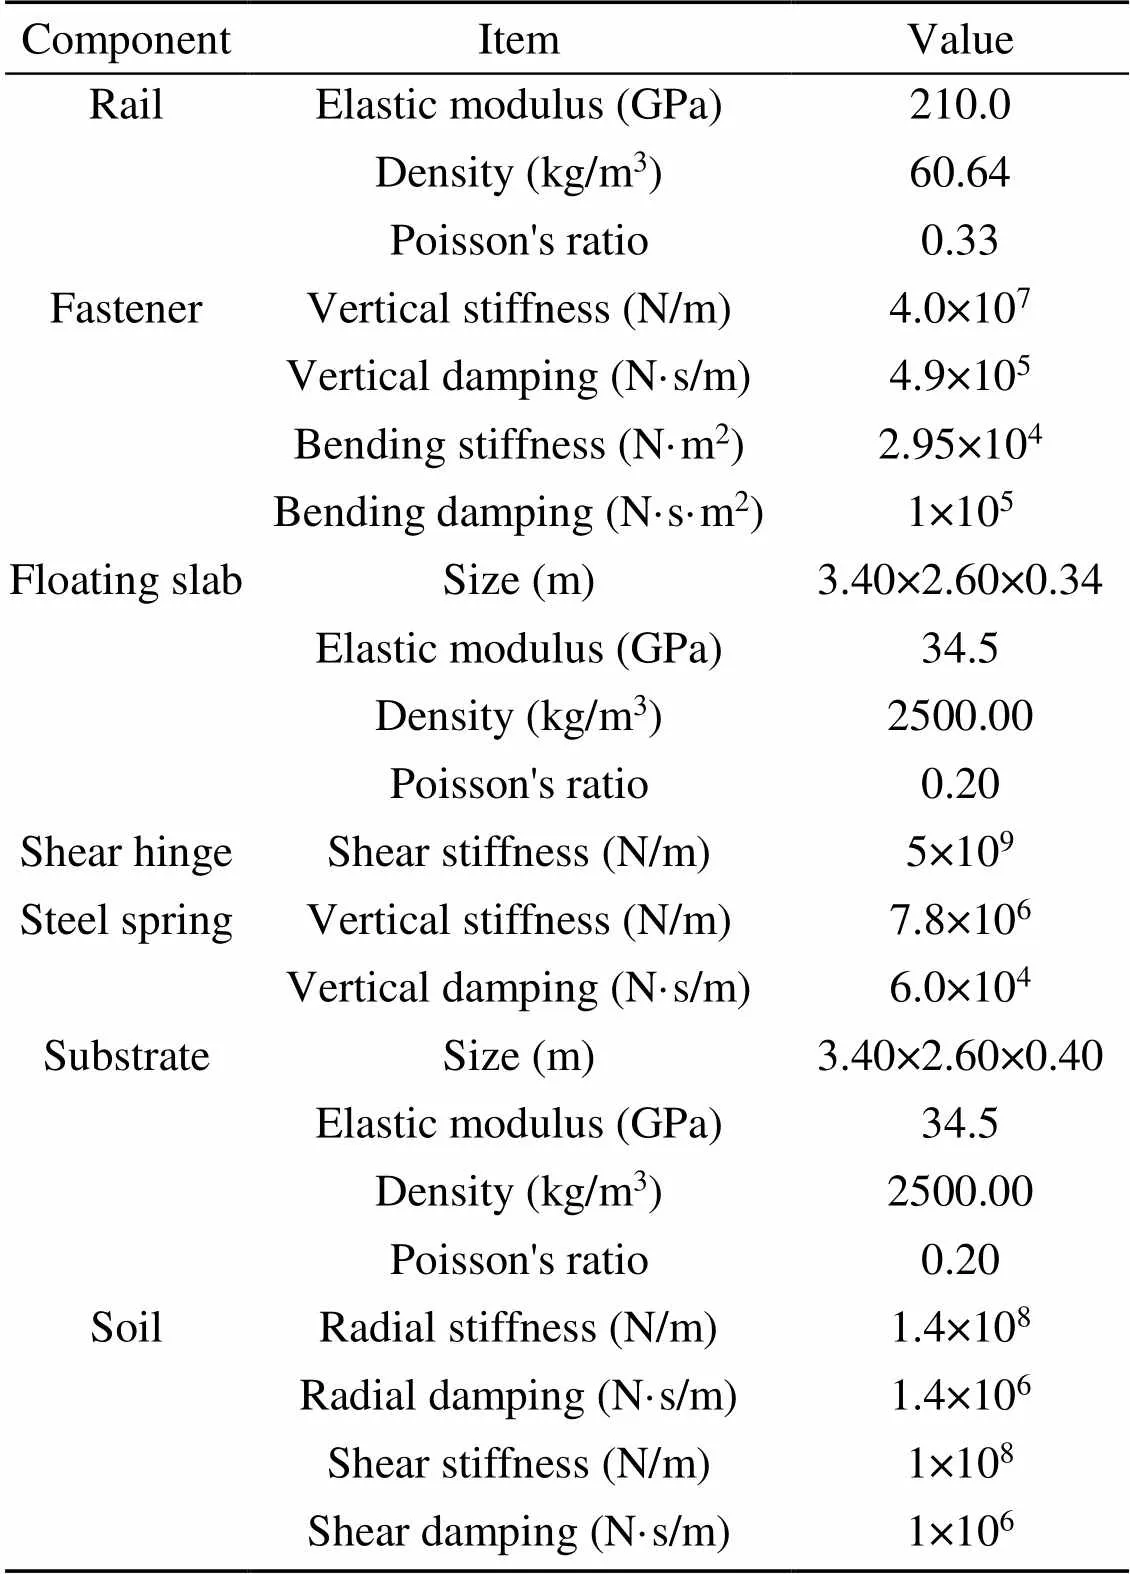
Table 2 Track parameters


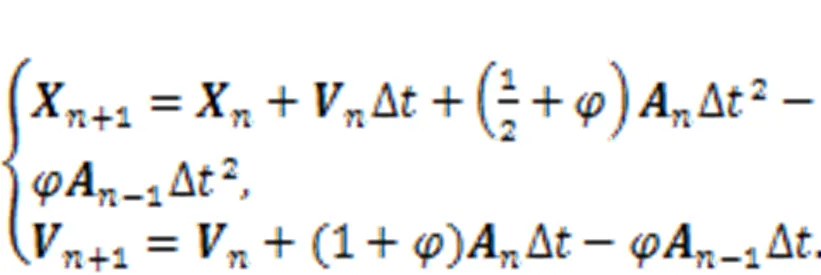
3 Dynamic response sensitivity to damage
Numerous physical quantities can describe the vertical motions of the floating slab, such as linear acceleration, velocity, displacement, angular displacement, angular velocity, and angular acceleration. Selecting physical quantities sensitive to steel spring failure can improve the damage identification accuracy. A failed spring was considered to have two states: complete failure, i.e., the steel spring is fully fractured, and partial failure, i.e., the steel spring is suspended. A partially failed, or suspended, steel spring may still provide some support to the floating slab. Both damage states are collectively referred to as failure in the following text. Slab No. 17 was the central one of all the floating slabs in the model and was the focus of analyses. Different slab No. 17 spring failure cases were considered and compared. All failures in this section are fracture for obvious comparison. The steel springs were numbered as shown in Fig. 4.
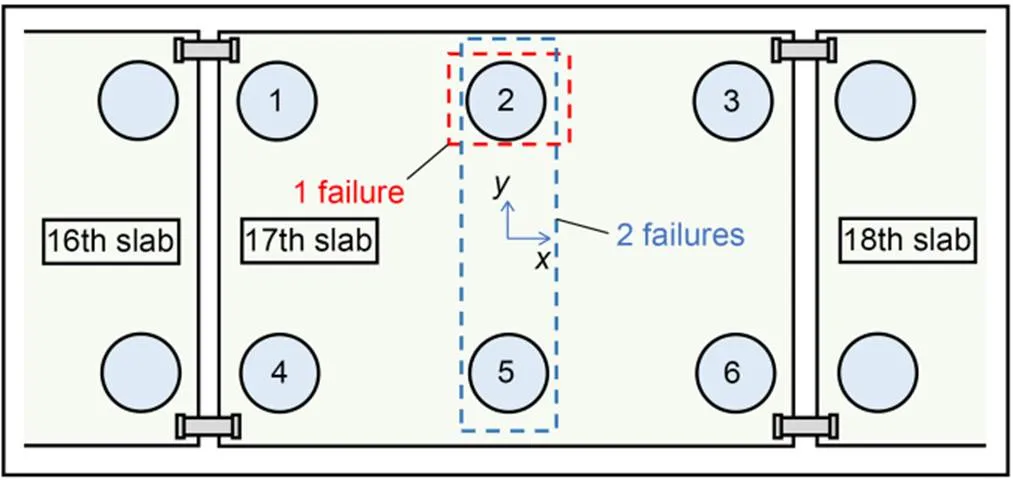
Fig. 4 Steel spring failure cases
The dynamic response results are shown in Fig. 5. In Figs. 5a and 5b, numerous signal bursts in acceleration and velocity can be seen, caused mainly by local impact, resulting in significant fluctuations in peak values. However, the RMS values are more stable. It can be seen that the fracture of a spring causes an increase in the RMS value, and the sensitivity of velocity to fracture is higher than that of acceleration. The displacement in Fig. 5c is smoother relative to acceleration and velocity, and the changes in peak and RMS values are more sensitive, evident, and stable. Figs. 5d and 5e show angular displacements with respect to the- and-axes, respectively. Positive angular displacement satisfies the right-hand screw rule and is not sensitive to the fracture of the steel springs. However, in Fig. 5d, the angular displacement corresponding to one spring failure is the largest, and the fracture position is located in the positive-direction, which may suggest a technique for spring fracture location identification. As in translational motion, the angular displacement stability and sensitivity were higher than those of the angular velocity and acceleration, which are not shown here.
Fig. 5f shows the 1st-order vertical mode natural frequency of the floating slab. This vibration mode is the overall vertical resonance of the floating slab–steel spring system. The theoretical natural frequency was obtained by finite element modal analysis. The experimental frequency identified in the figure was obtained through operational modal analysis (OMA) and the data source came from Fig. 5a. This method can obtain the natural frequency from the dynamic response of the slab under external load excitation, avoiding separate modal tests such as hammer tests (Rajaram and Nelson, 2019). The modal identification was divided into two steps. Firstly, the free attenuation signal was extracted from the vertical acceleration time-domain signal, and then the modal parameters were calculated using a time-domain modal parameter identification method. Fig. 6 shows the main steps of modal parameter identification and the identified 1st-order natural frequency without failure. The random decrement technique (RDT) (Vandiver et al., 1982) only uses the center point data, while the natural excitation technique (NExT) (James III et al., 1995) uses the center point and corner point data. It can be seen that the differences in data handling by the different methods are the main cause of the difference in frequency identification. RDT is not suitable because the signal has no apparent attenuation, which is mainly caused by poor stability of train excitation. However, NExT uses more data and the identification results are very good. Autoregressive moving average model (ARMA) (Bertha and Golinval, 2017) and stochastic subspace identification (SSI) are more accurate for the preprocessed data. However, ARMA has fewer calculation steps and higher efficiency and is more suitable for processing data from many train runs. As shown in Fig. 5f, the difference between the calculation results using NExT/ARMA and the theoretical results is within 0.3 Hz. The theoretical and experimental identification results show that the 1st-order vertical mode natural frequency of the floating slab is sensitive to spring fracture.
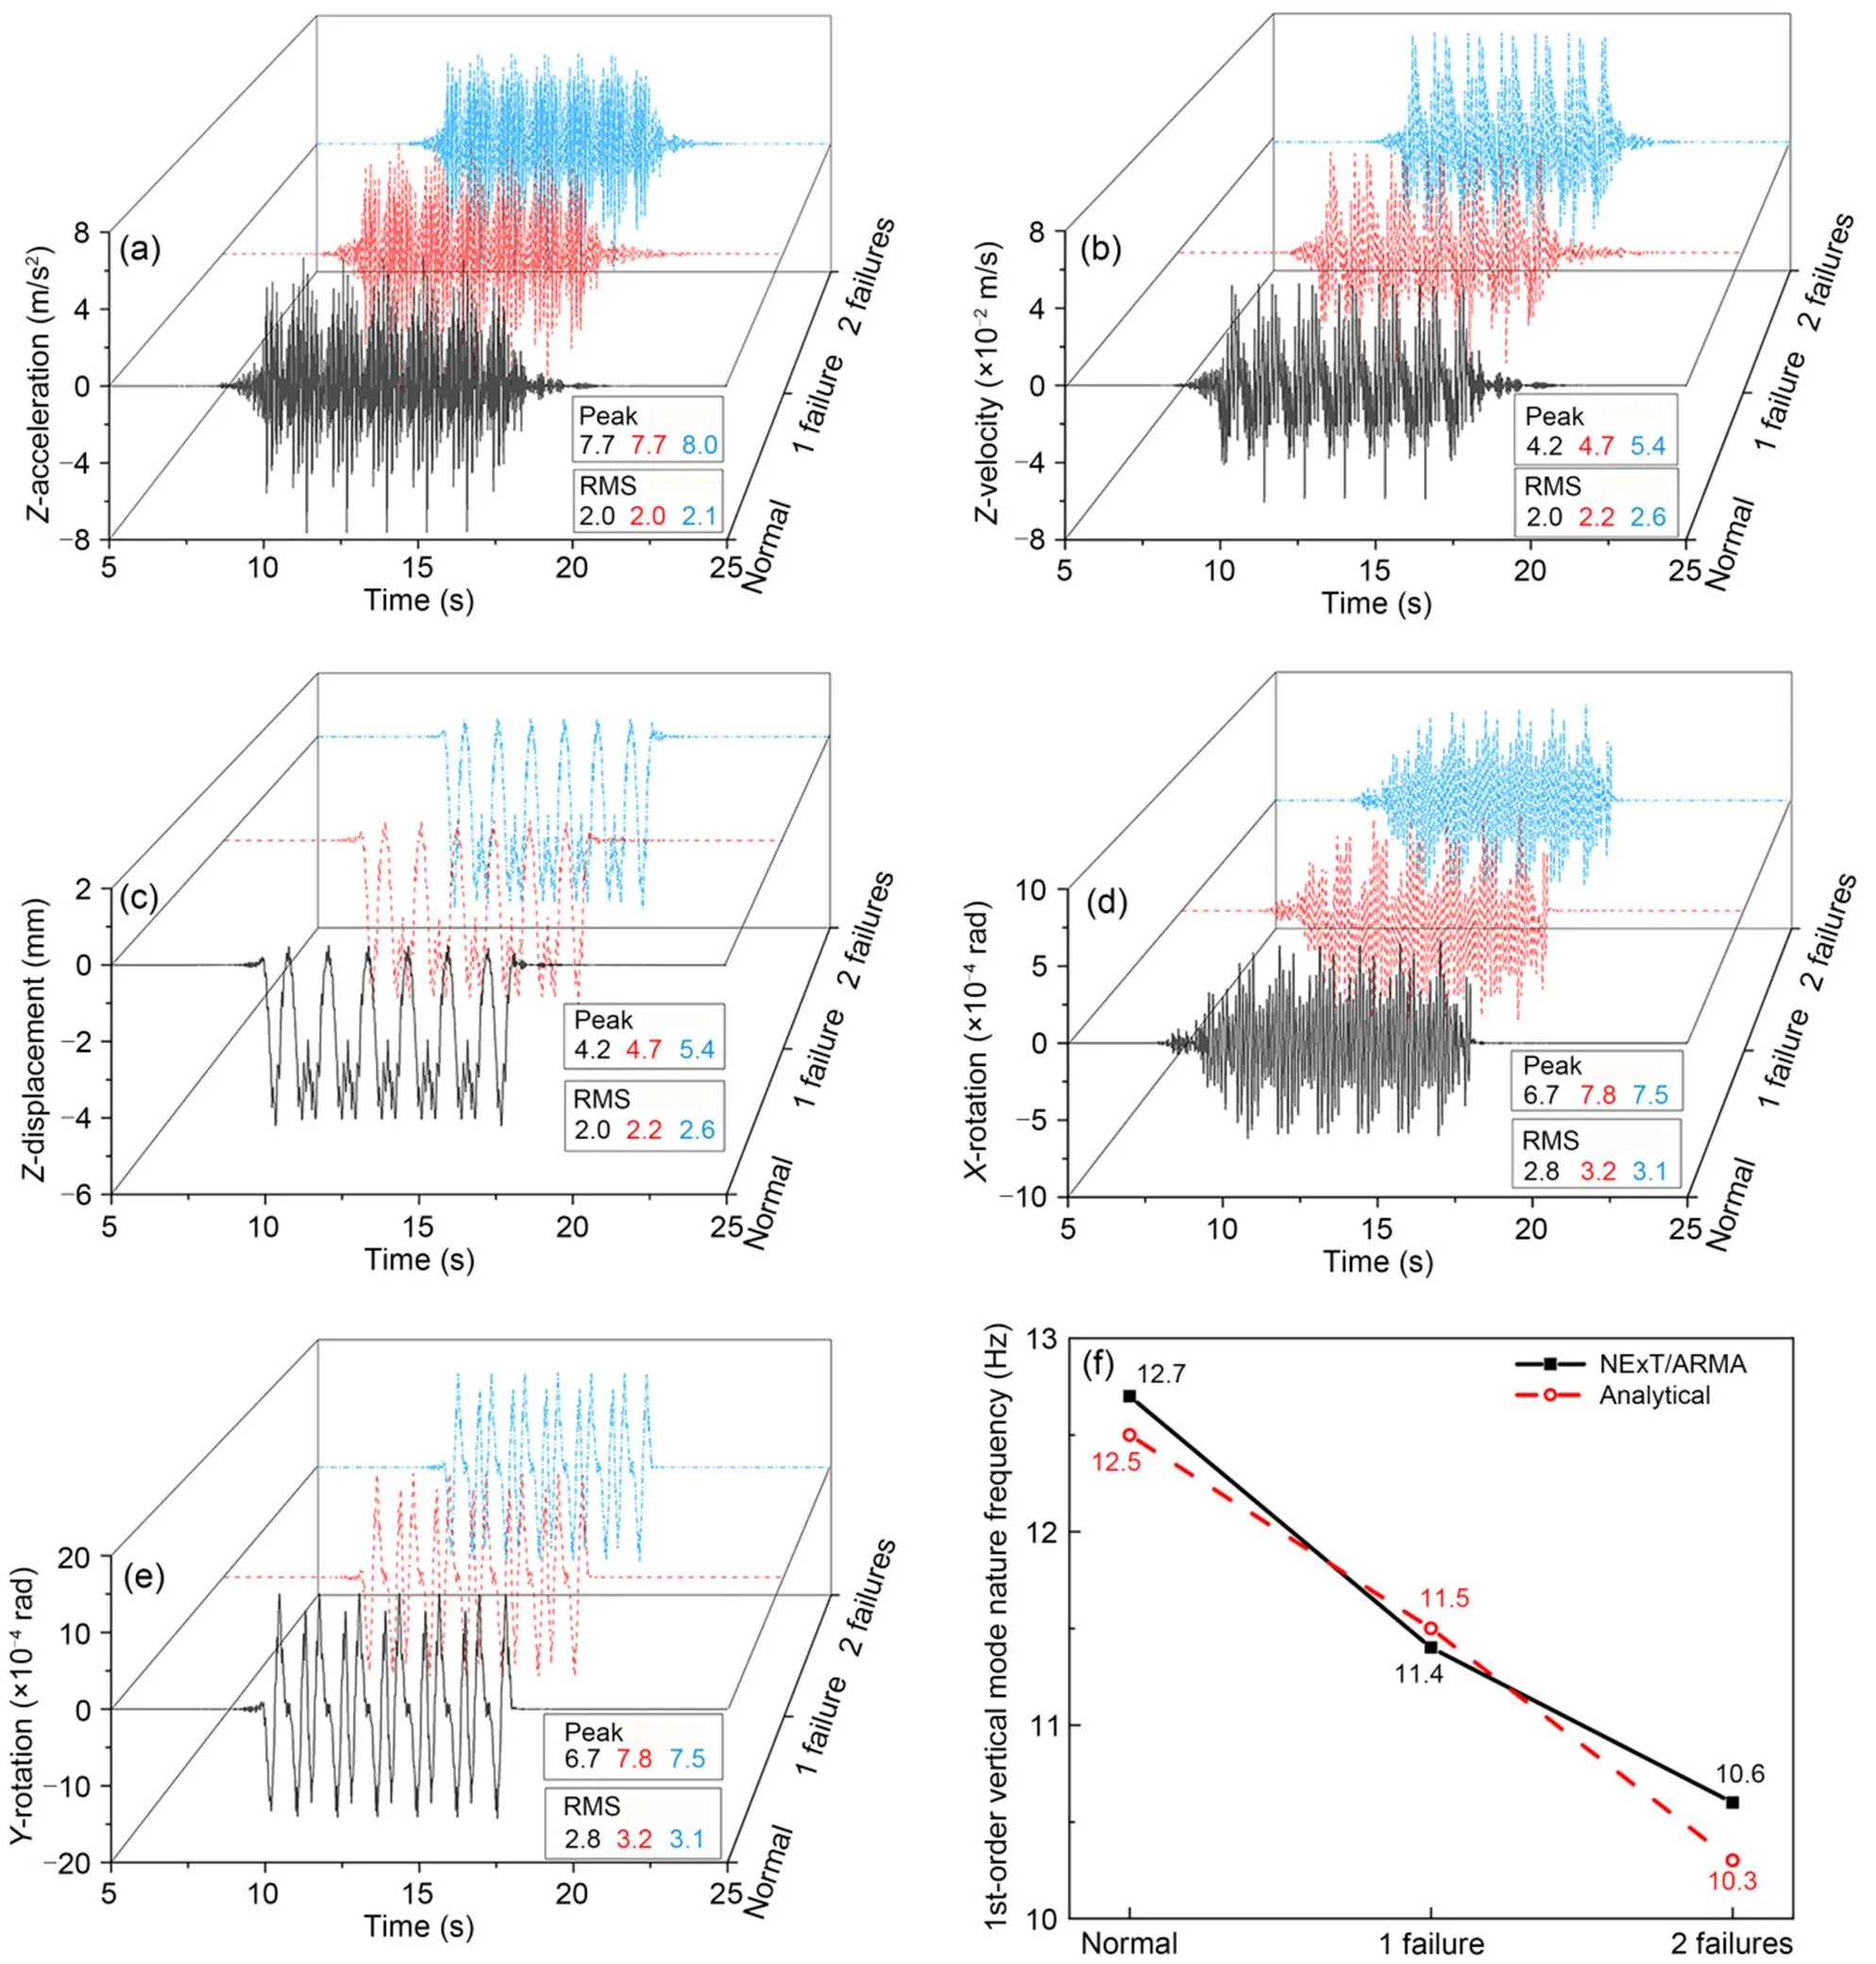
Fig. 5 Sensitivity analysis of dynamic response indices of slab No. 17: (a) vertical acceleration; (b) vertical velocity; (c) vertical displacement; (d) X-rotation; (e) Y-rotation; (f) 1st-order vertical mode natural frequency. References to color refer to the online version of this figure
4 Steel spring failure identification
4.1 Failure number identification
The 1st-order vertical mode natural frequency at different failure numbers, gaps, and positions is investigated in this section. The failure gap here refers to the vertical distance between the spring contact point and the floating slab after the system reaches static equilibrium under gravity. Different spring failure gaps for slab No. 17 were simulated by a nonlinear spring. Four failure gaps of 0, 2, 4, and 6 mm were considered, where 0 mm indicated that the failed spring was just in contact with the floating slab, and 6 mm meant the spring was broken because it could not contact the slab at all (Fig. 5c). The force–displacement relationships for steel springs with different failure gaps are illustrated in Fig. 7 and Table 3. The failure causes nonlinear behavior of the floating slab and it is challenging to solve the natural frequency by the finite element method. The modal identification method in the previous section can avoid this problem. This paper only studies the failure of one or two springs. Four failure cases are considered: spring No. 1 failed, spring No. 2 failed, springs Nos. 1 and 4 failed, and springs Nos. 2 and 4 failed. In the two-spring failure cases, e.g., springs Nos. 1 and 4 failed by 1 mm and 3 mm, respectively, the spring positions were noted as positions 14, and the gaps were abbreviated as 1+3.
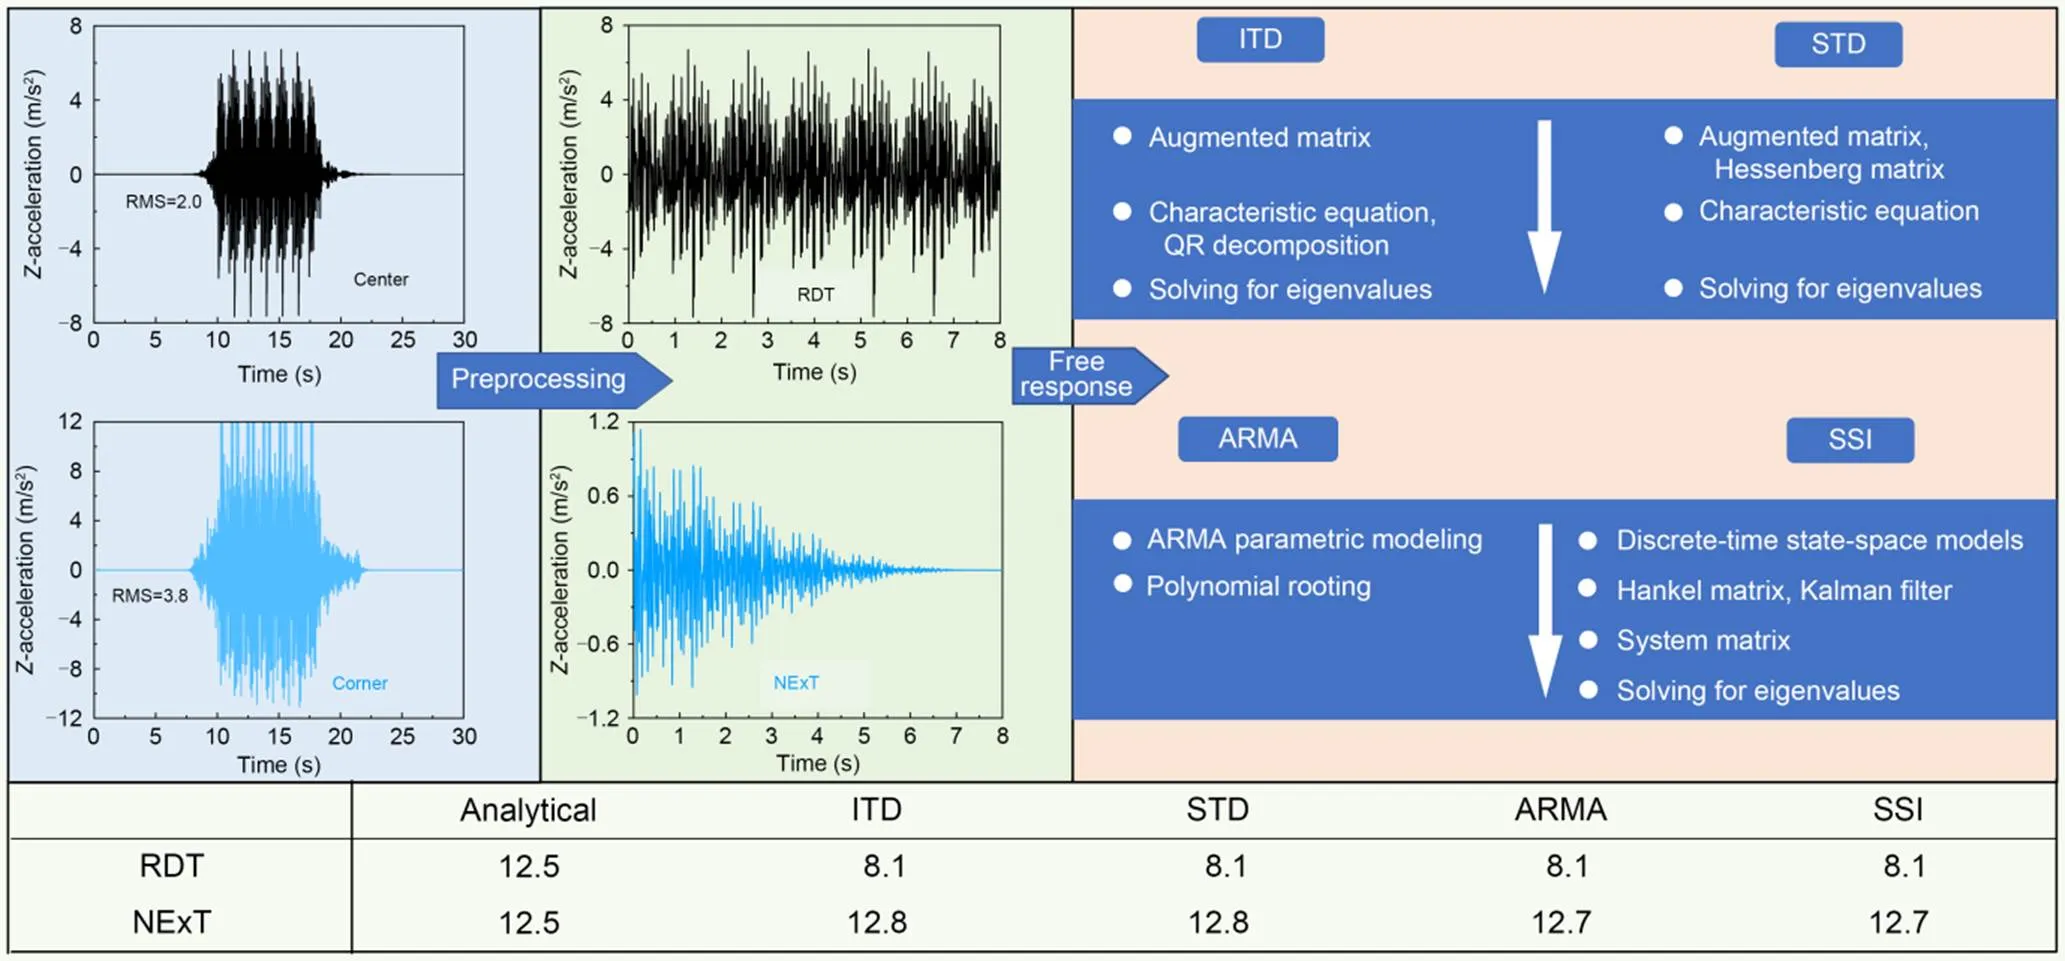
Fig. 6 Steps and results of natural frequency identification. ITD: Ibrahim time domain technique; STD: sparse time domain technique; QR: an orthonormal matrix Q and an upper triangular matrix R
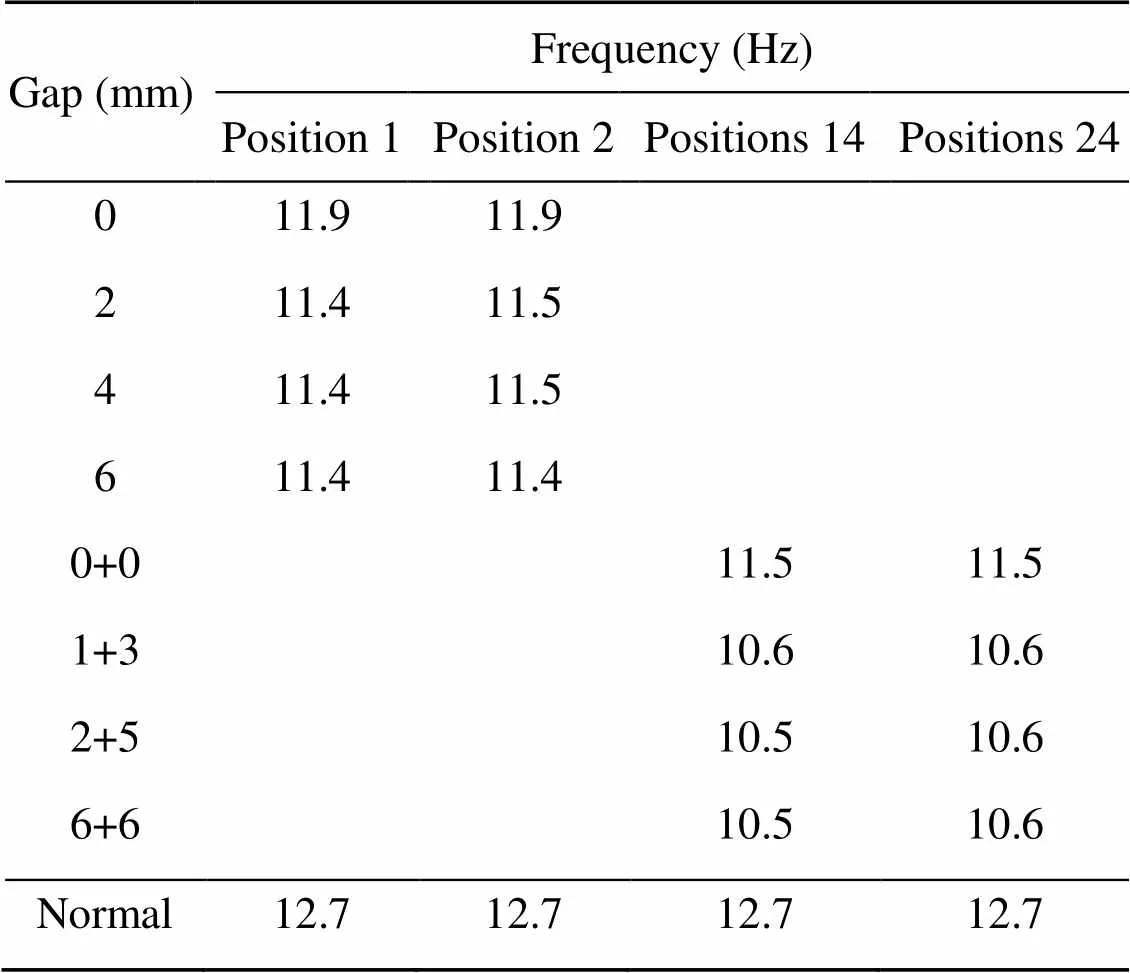
Table 3 1st-order vertical mode natural frequencies of floating slab subjected to different combined failures
The 1st-order slab vertical mode natural frequencies of different failure cases are shown in Table 3. Each 1st-order frequency dropped significantly when the steel spring just failed (0 mm). After the failure gap exceeded 2 mm, the frequency gradually tended to the spring fracture frequency, which hardly changed with the failure gap. In addition, when the number of failed springs is the same, different failure gaps and positions had little effect on the frequency. This is because the failed spring can only be compressed and not stretched, equivalent to changing from a bidirectional spring to a unidirectional spring, which plays a significant role in the change of frequency. These characteristics show that the 1st-order vertical mode natural frequency can be used robustly to identify the number of failed springs.
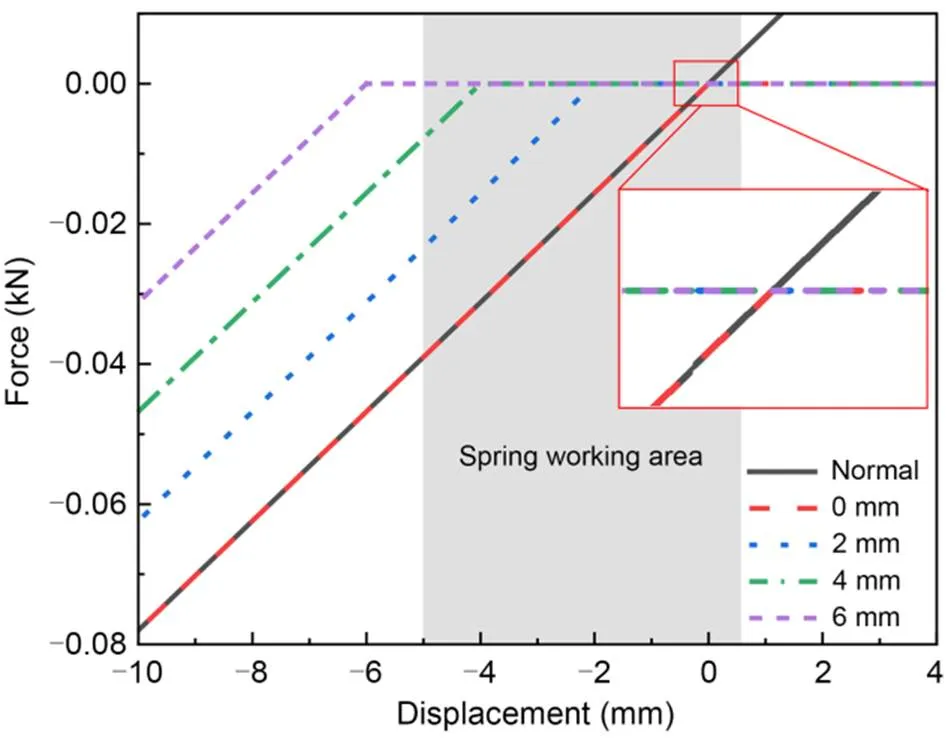
Fig. 7 Force–displacement relationships for steel springs with different failure gaps
4.2 Failure severity identification
The failure gap was used to quantify failure severity. Since the frequency was not sensitive to the failure gap, the maximum displacement was considered as an index to quantify the failure gap. Table 4 shows the peak displacements at various failure gaps. For one-spring failures, failure position No. 1 or No. 2 was selected. Before complete failure (gap<5 mm), there was a stable linear relationship between the displacement peak and the failure gap. For two-spring failure cases, the symmetrical case of positions 16 and asymmetrical case of positions 15 were selected. It can be seen that the different positions did not affect the maximum displacement in the case of two-spring failures. In addition, except for the case of 2+4, when the total failure gap of two springs was equal to the total failure gap of one spring, the maximum displacement of both springs was the same. This was because, in the case of 2+4, the two springs failed only partially, but in the case of one spring, 6 mm signified a complete failure. This indicates that the maximum dynamic displacement of the floating slab was only related to the total failure gap. However, when the failure gap changed, the displacement change rate was low. The on-site results will be further complicated because there are inevitable fluctuations in the actual track structure parameters. It was difficult to identify the failure gap accurately from displacements except when the failure gap was large.
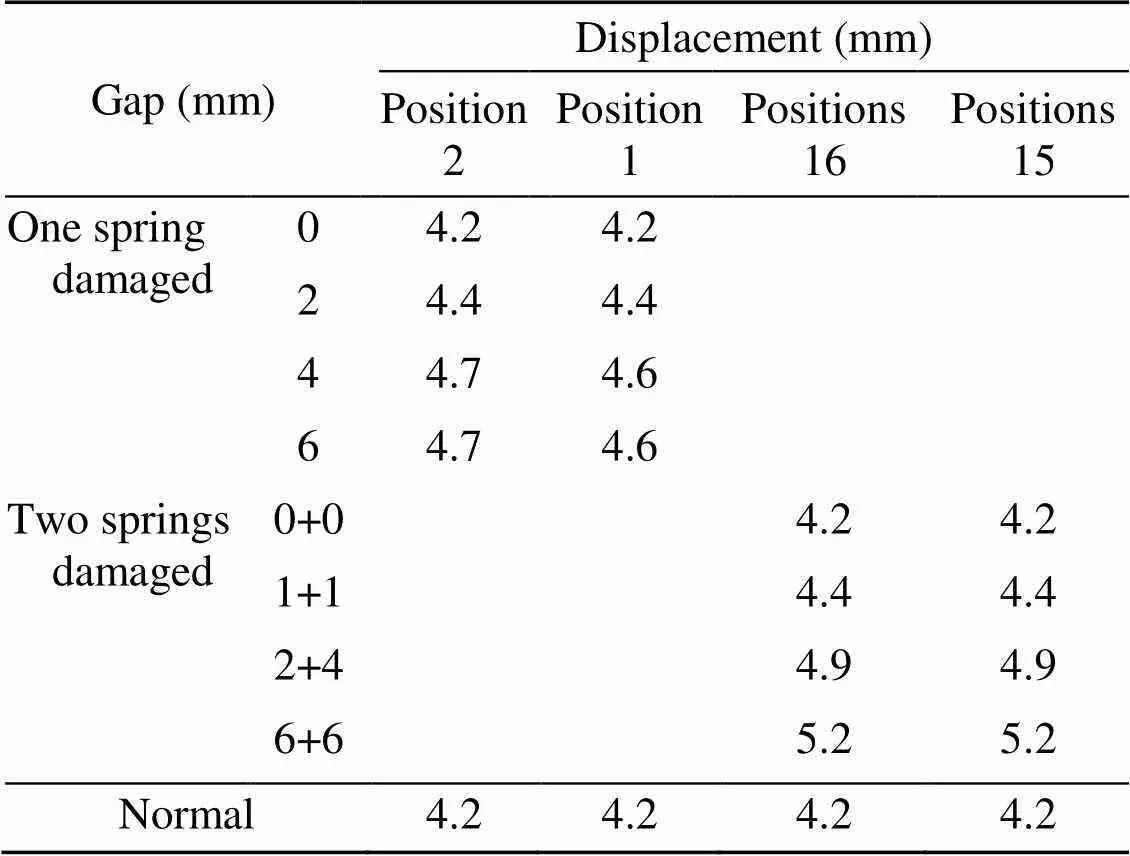
Table 4 Maximum vertical dynamic displacements of floating slab subjected to different failures
4.3 Failure location identification
Based on the results shown in Fig. 5d, failure position identification from the rotation angle was attempted. Since the fluctuation of peak values was too large, the RMS of rotation angle was used. Two cases of one-spring failure, Nos. 1 and 2, were considered. Fig. 8 shows the RMS of each rotation direction in these two cases, where the purple solid line is the RMS of the rotation angle when there is no defect. Note that there are two types of RMS in Fig. 8. One is the RMS of the positive rotation part, and the other is the RMS of the negative rotation part. For example, 1: RMS+in Fig. 8a indicates the RMS of positive rotation angle around the-direction when spring No. 1 failed, while 2: RMS-represents the RMS of the negative rotation angle around the-direction when spring No. 2 failed. It can be seen from Figs. 8a and 8b that 1: RMS->1: RMS+and 1:RMS->1:RMS+in the case of spring No. 1 failure. This difference increased with the increase in the failure gap. In the case of spring No. 2 failure, 2: RMS-≈2: RMS+and 2: RMS->2: RMS+. The above observations can be summarized as follows: if a spring in a specific direction fails, the rotation in this direction will increase. For other failure cases, such as spring No. 6 failure, a similar analysis can be conducted, which showed that 6:RMS-<6:RMS+and 6:RMS-<6:RMS+. The equivalence here assumes that the rotation angle is symmetric when there is no failure, which is confirmed by the purple line in Fig. 8a.
Failure of two springs can be analyzed in a similar way by division into six independent cases, as shown in Fig. 8c. Damage positions 1 and 2, 1 and 3, and 2 and 5 can be identified from the- and-rotations. The remaining positions require special consideration. For positions 1 and 6, since the failure positions are centrosymmetric, the rotation should be considered as diagonal. Diagonal rotation can be calculated from the- and-rotations. Note that the directions of diagonal lines for damage cases 16 and 43 are denoted asand, respectively (Fig. 8c). Considering the complete spring fracture at positions 16, the calculated RMS±is 5.3×10⁻⁵rad, and RMS±is 4.4×10⁻⁵rad, indicating that failure occurred at positions 1 and 6 instead of 3 and 4. For damage positions 1 and 4 and 1 and 5, their rotations in the- and-directions are similar and should be judged in combination with the diagonal rotation. In case of complete failure, the RMS-and RMS-of positions 14 are both 6.6×10⁻⁴rad, and the RMS-and RMS-of positions 15 are 5.4×10⁻⁴and 4.8×10⁻⁴rad. Therefore, it can be discerned whether the failure is in positions 14 or positions 15. Fig. 8d shows the rotations of the three exceptional cases.
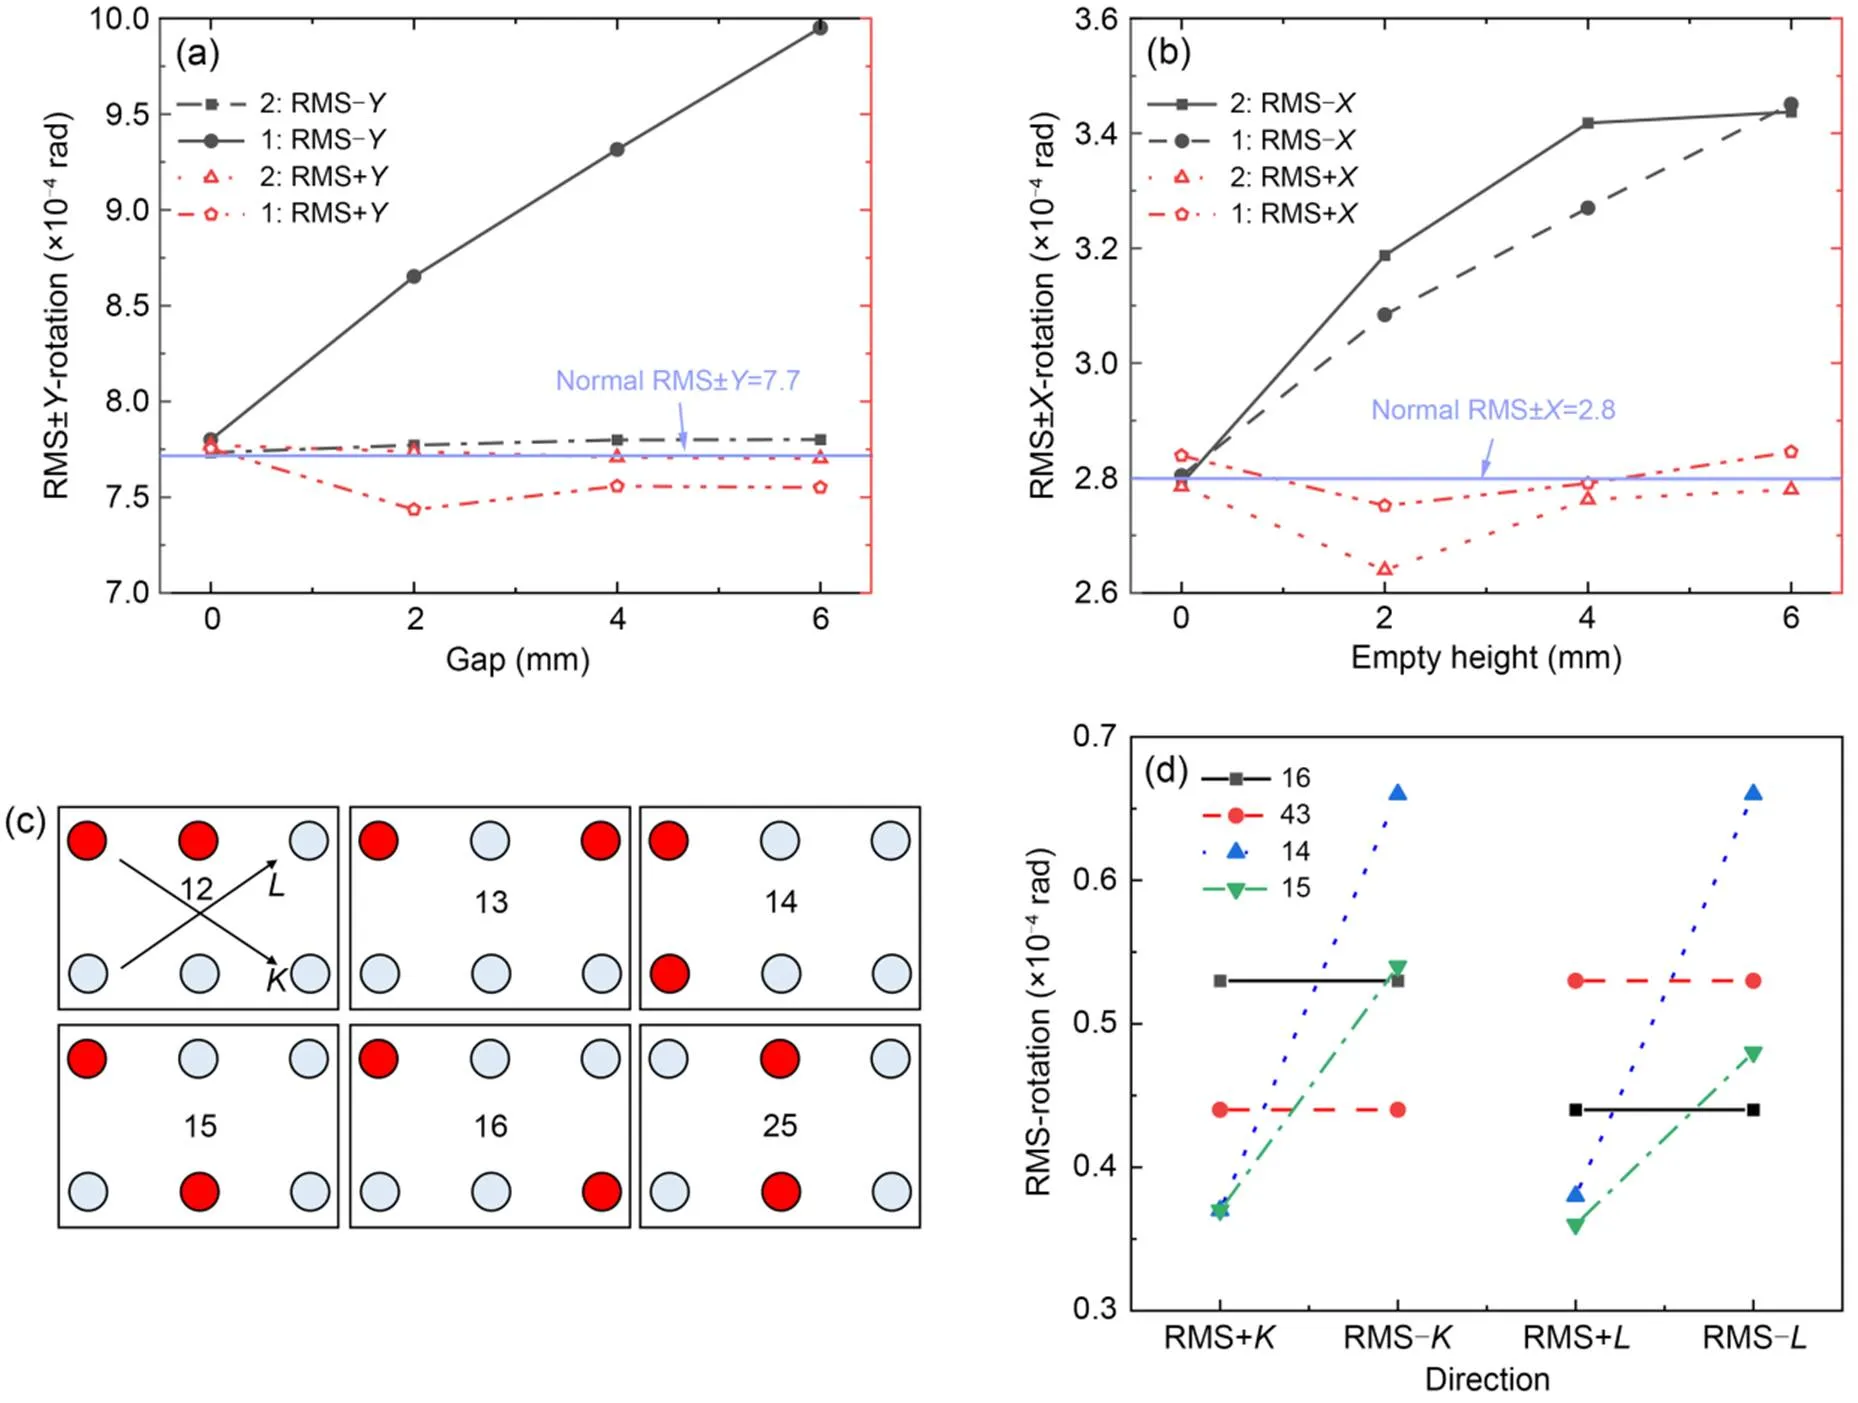
Fig. 8 Effective value of rotation angle for different failure positions: (a) RMS of Y-rotation; (b) RMS of X-rotation; (c) six cases for two-spring failures; (d) effective values of diagonal corner rotations in special cases. References to color refer to the online version of this figure
(1) For one-spring failure,
1: RMS->RMS+, RMS->RMS+;
2: RMS->RMS+, RMS-≈RMS+.
(2) For two-spring failure,
12: RMS->RMS+, RMS->RMS+;
13: RMS->RMS+, RMS-≈RMS+;
14: RMS-≈RMS+, RMS->RMS+, RMS-≈RMS-;
次日清晨,我早早儿就爬起。心想今朝一定要见到狼剩儿,我都跟大梁说了,今朝要赶回去的。抬眼瞄赛十娘,她困得正香。我蹑手蹑脚走到门口,伸手拉门,外面还锁着。轻轻摇了两下,冇得人应。
15: RMS-≈RMS+, RMS->RMS+, RMS->RMS-;
25: RMS-≈RMS+, RMS-≈RMS+;
16: RMS->RMS-.
5 Floating slab monitoring system
Based on the above analysis, the ISFST was proposed. The system has five parts: monitoring module, monitoring terminal, cloud server, data analysis system, and user terminal, as shown in Figs. 9 and 10. The monitoring module comprises sensors and communication units. The sensors are three-axial acceleration and three-axial angular velocity sensors. The communication unit includes a converter and a transmission cable. The converter changes analog electrical signals into digital ones. The transmission cable connects the monitoring module and the monitoring terminal. The monitoring terminal receives the digital signal from the monitoring module and transmits the data to the cloud server through a wireless network. The data analysis system processes the vibration data on the cloud server and then sends the data processing results to the user terminal. If the data is abnormal, the system automatically sends an alarm message to the user.
The system was successfully implemented on a section of a metro line in southern China. The radius of this rail line section is 390 m, the dimensions of the floating slab are 3.576 m×2.600 m×0.340 m, the gap between slabs is 12 mm, and the natural design frequency is 12.5 Hz. A monitoring module was arranged at the center of each slab. The monitoring area contains 16 boards, with a total length of about 60 m. The tunnel power supply was used to operate the entire monitoring system. Slightly different from the above theoretical analysis, the vibration isolators at the adjacent slab ends support the two adjacent floating slabs simultaneously and their stiffness is about twice that of the steel springs in the middle of the slab. Although this section is located on a curve, this does not affect the above identification rules. The functions of the monitoring system include more than steel spring condition monitoring. The training data can be obtained by analyzing the responses of the floating slabs caused by different train runs. The rail status can be monitored by comparing the responses of floating slabs at different times caused by the same train type. However, this study only focuses on the steel spring support stiffness monitoring.
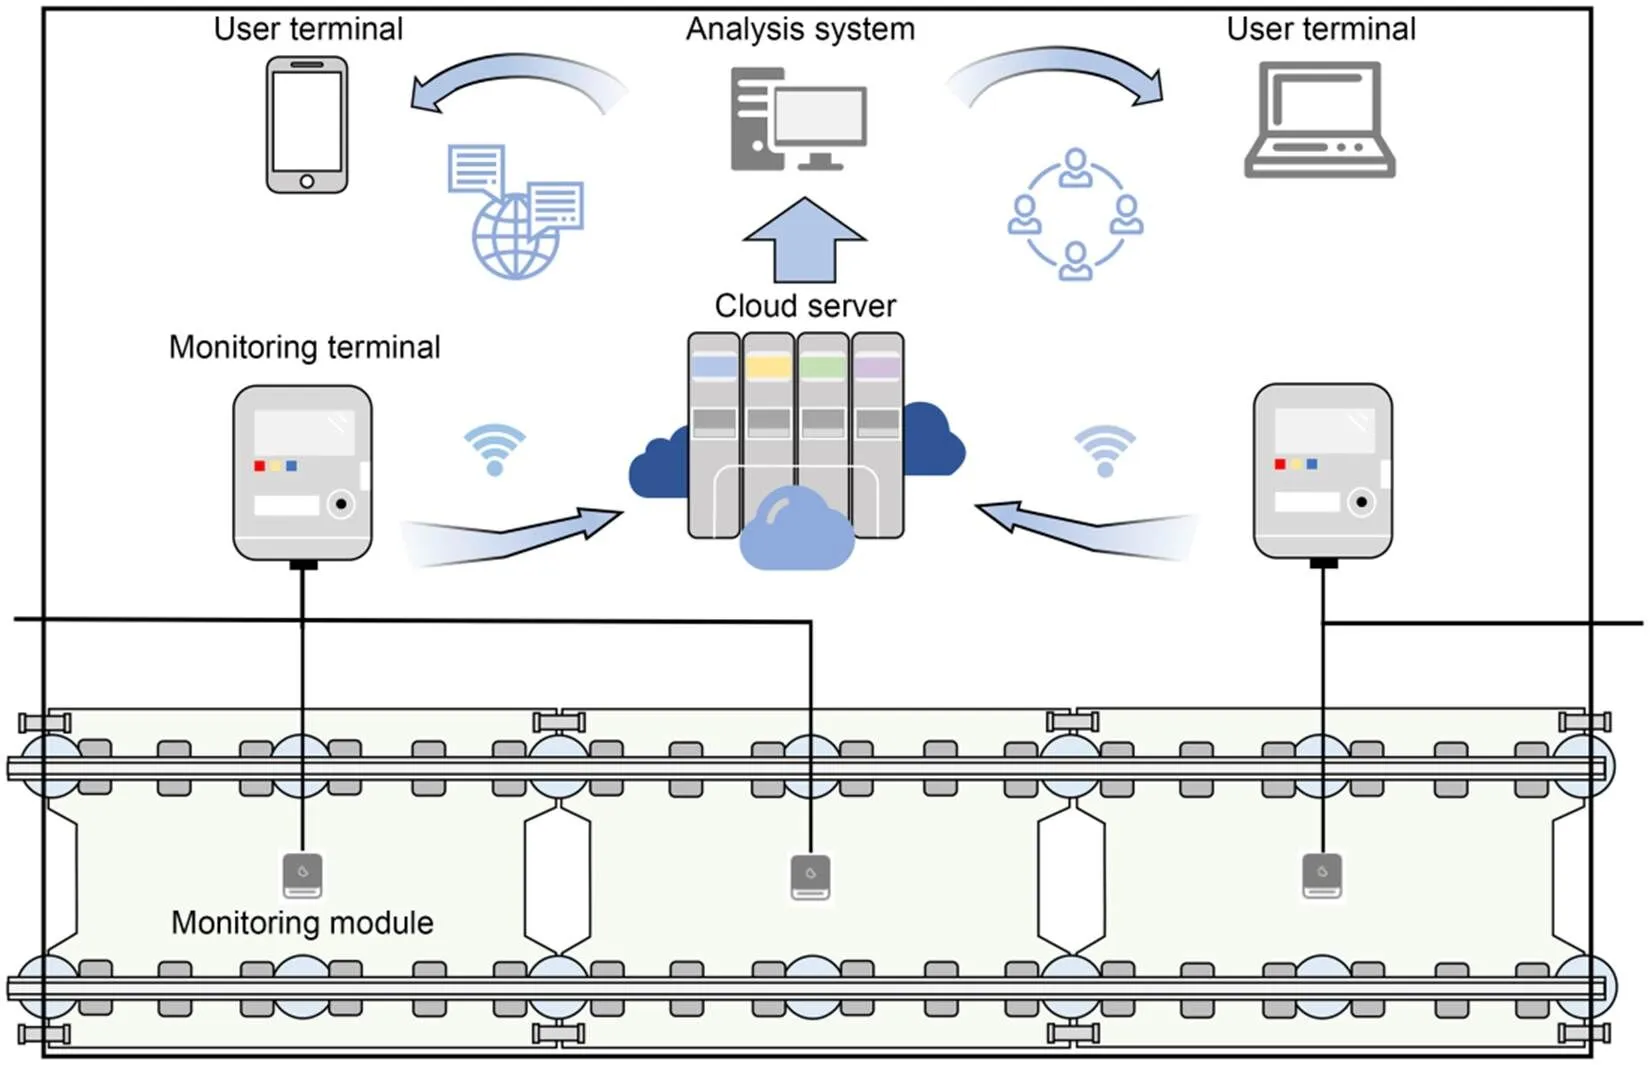
Fig. 9 Architecture of ISFST

Fig. 10 On-site monitoring system: (a) monitoring module; (b) monitoring terminal; (c) power supply; (d) signal line


Fig. 11 shows the clustering results of the data from 20 train runs at the beginning of the system operation. There were two types of data. Type I is all the data of slab No. 4, but a few data of slab No. 4 are classified as type II (outliers), indicating that a steel spring in slab No. 4 was damaged. As shown in Fig. 11b, although the planar projections of two types of data overlapped, the method achieved satisfactory results using three types of data (Fig. 11a), which shows that the method can reduce the impact of single-type data fluctuations on failure identification. This method was still very effective for data clustering from one train run, which shows that this method can effectively find failures.
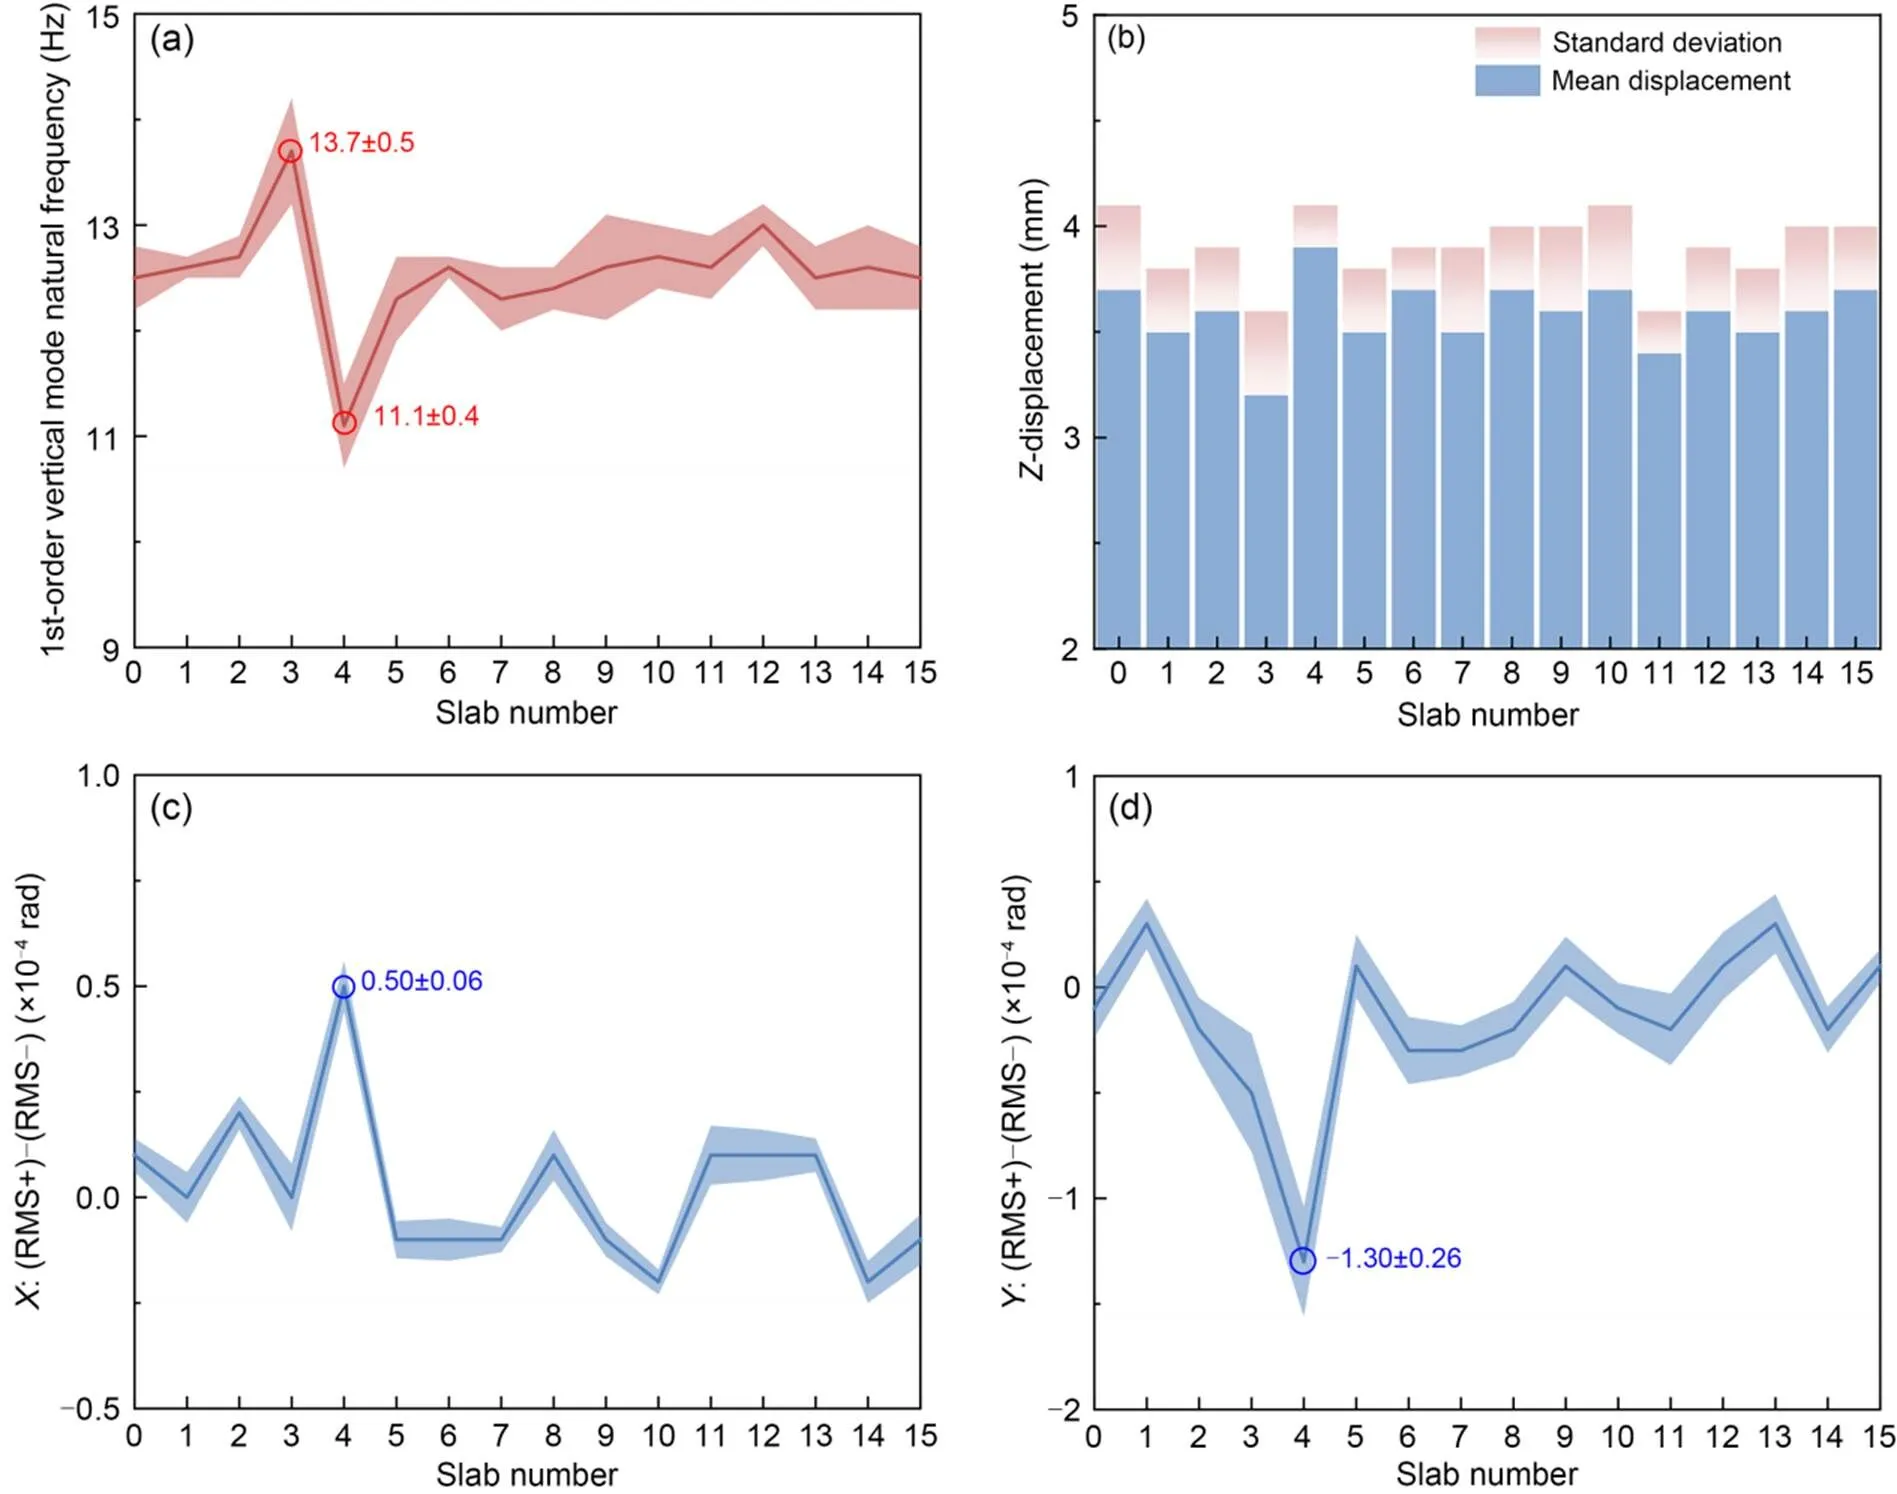
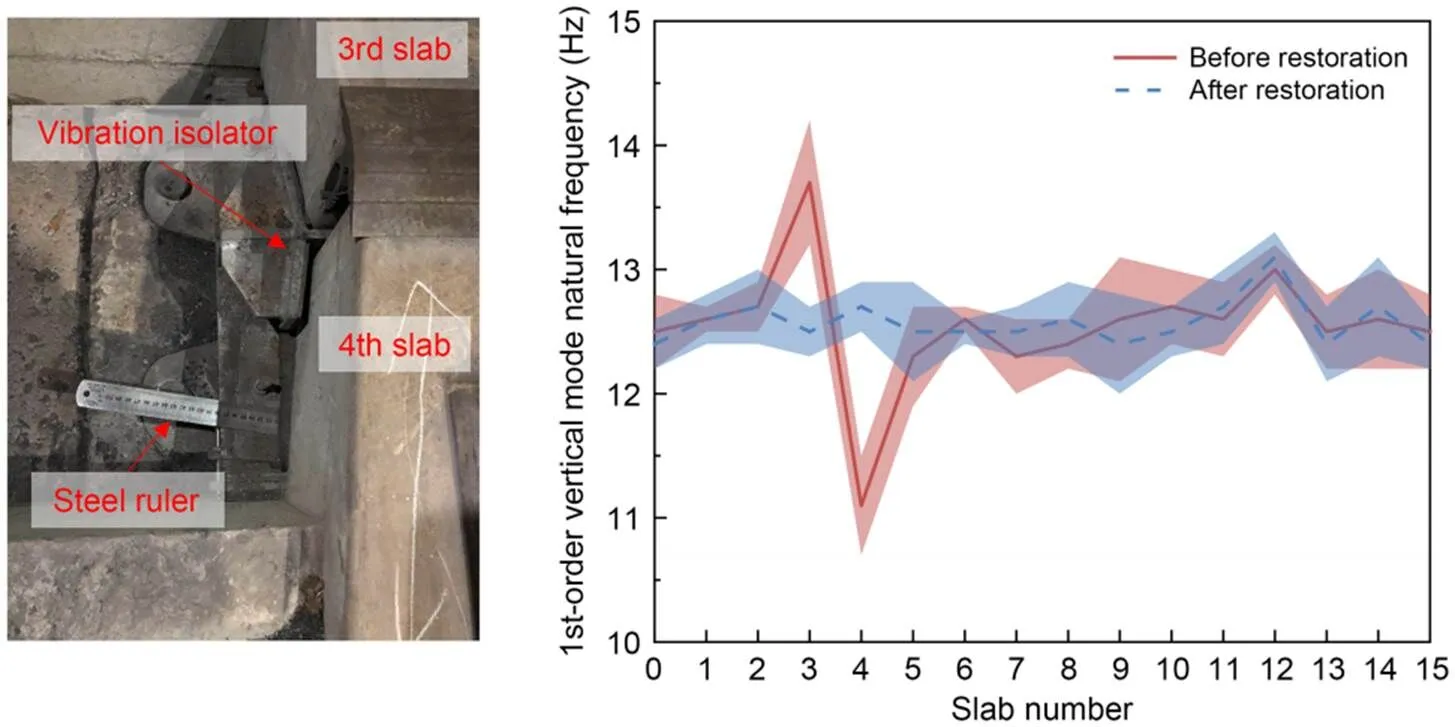
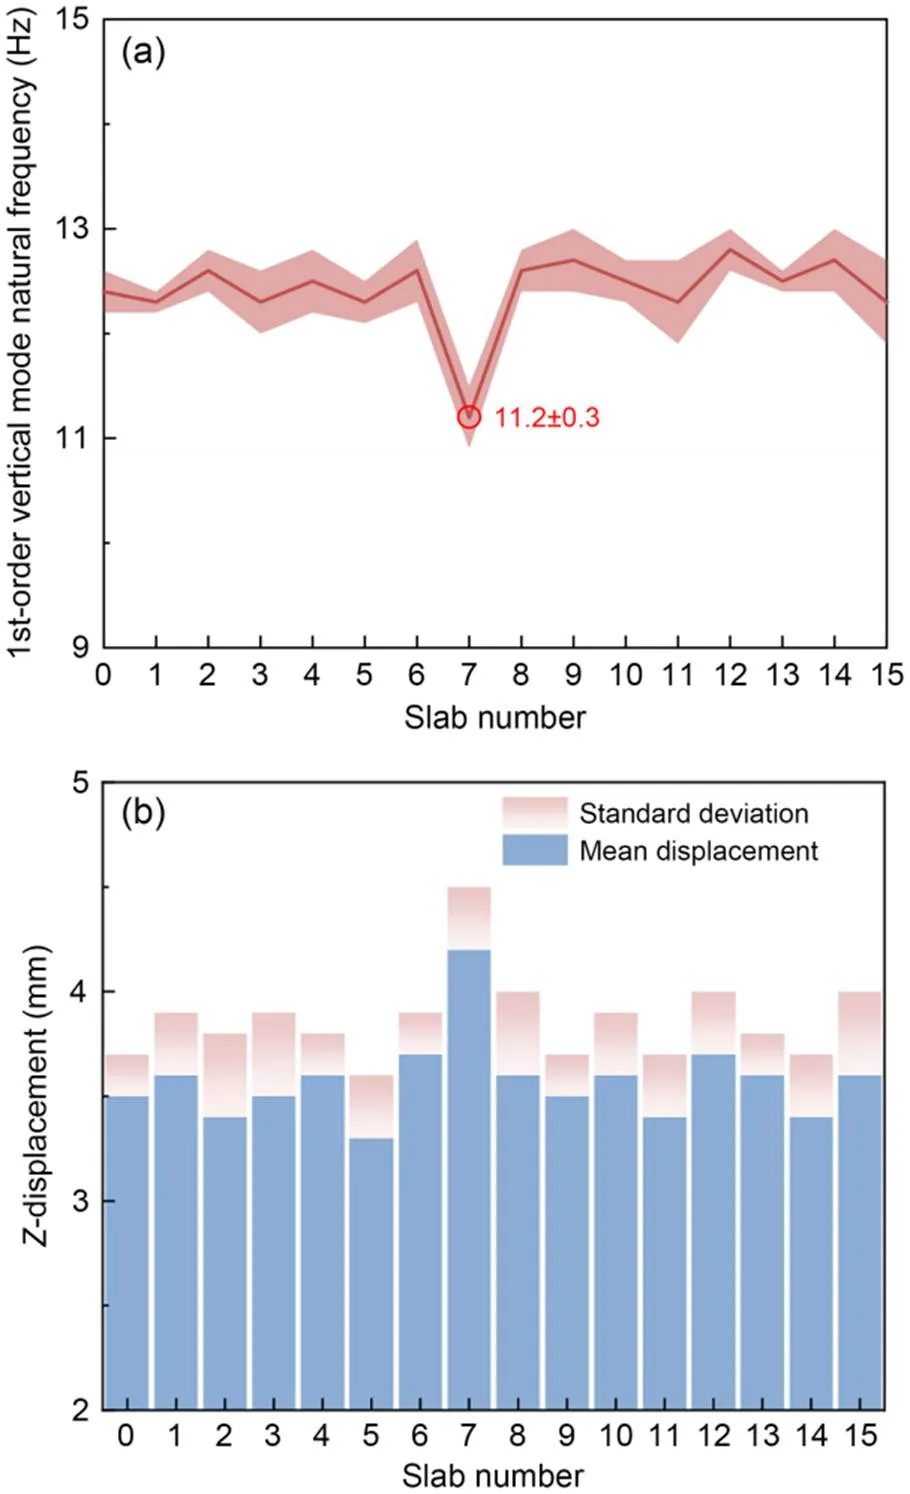
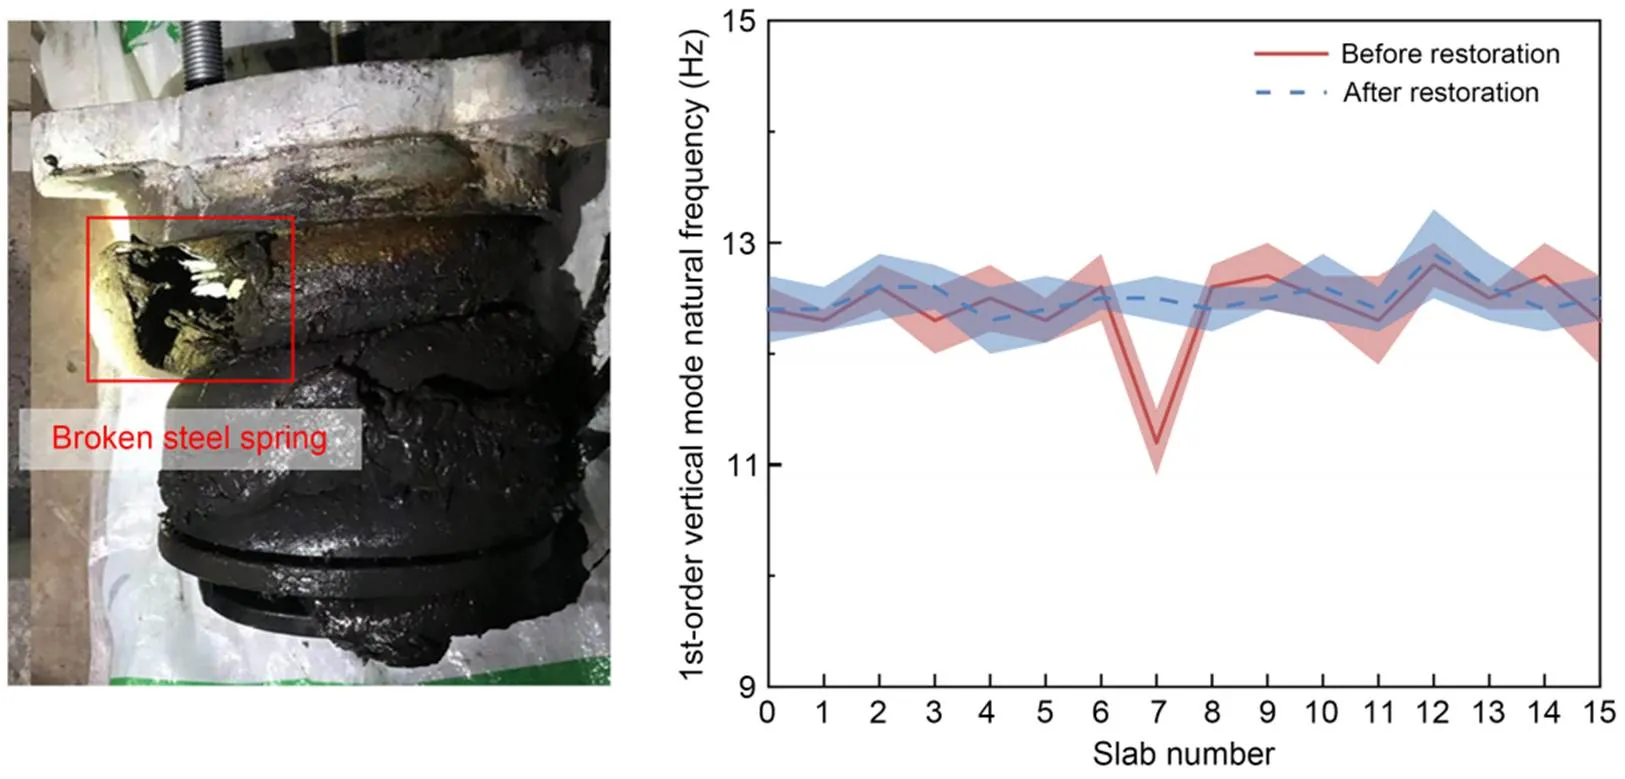
The failure characteristics were identified by statistical analysis. Fig. 12 shows the average value of all data on a particular day at the beginning of system operation, and the shaded area represents the standard deviation. It can be seen from Fig. 12a that the frequency of slab No. 4 was much lower than that of other slabs, indicating that the support stiffness was insufficient, which may be due to the suspension of the support or the fracture of the steel spring. Compared to the design frequency, the frequency of slab No. 4 has decreased by 1.4 Hz. According to Fig. 5f, there is a high probability of one failure. The dynamic displacement of slab No. 4 shown in Fig. 12b was high, and the difference from other slabs was almost 0.5 mm. Based on these observations, it was speculated that lifting might have occurred. Figs. 12c and 12d show the difference between each slab RMSs of positive and negative rotations. It is evident that for slab No. 4, RMS+>RMS-and RMS+ Fig. 11 Cluster analysis based on sensitive response indices: (a) space distribution; (b) projection in XYZ. References to color refer to the online version of this figure After a field inspection performed by maintenance personnel, it was found that the shared isolator of slabs Nos. 3 and 4 had failed. The failure gap was about 2–3 mm, and a steel ruler with a thickness of 1.5 mm could be inserted. The isolator was repaired by adding vibration isolation gaskets, and the natural frequency of slab No. 4 was monitored the next day. It was found that the frequency had returned to the normal value, as shown in Fig. 13. In the following three years of long-term monitoring, the system also identified a steel spring fracture damage and cluster analysis quickly found that the abnormality was located in slab No. 7. Statistical analysis showed that steel spring No. 2 in slab No. 7 was broken. Since the process was similar to the above suspension failure identification, only the 1st-order vertical mode natural vibration frequency and vertical dynamic displacement are shown here. Based on the frequency difference, it could be determined that the number of failures was 1. Sensitivity analysis showed that the maximum dynamic displacement was the main difference between steel spring fracture and suspension data. The dynamic displacement of slab No. 7 in Fig. 14b was almost 0.5 mm higher than that of other slabs, so the possibility of fracture was high. The identification results were confirmed on-site, as shown in Fig. 15. After the damaged steel spring was removed and replaced with a new one, the natural frequency returned to the pre-damage value. Fig. 12 Damage indices of floating slab: (a) 1st-order vertical mode natural frequency; (b) vertical dynamic displacement; (c) difference in effective values of rotation angles in X-direction; (d) difference in effective values of rotation angles in Y-direction Fig. 13 On-site confirmation of steel spring hoisting Fig. 14 Damage indices of floating slab: (a) 1st-order vertical mode natural frequency of floating slab; (b) vertical dynamic displacement Fig. 15 On-site confirmation of steel spring fracture This study was concerned with the problem of steel spring failures in steel spring floating slab tracks. It established a refined coupled train-floating slab track-foundation analytical model and analyzed the sensitivity of several dynamic response indices of a floating slab to failure. Adopting the damage-sensitive physical quantities, a method for identifying the number, severity, and location of steel spring failures was proposed. Based on this method, the ISFST was established and installed on a rail line in southern China. Cases of steel spring suspension and fracture were successfully identified and detailed failure information was obtained. The sensitivity analysis of the dynamic model responses showed that the 1st-order vertical mode natural frequency, the maximum vertical dynamic displacement, and the RMS of the rotation of the floating slab under the train loads are easily affected by steel spring failures. The specific features are as follows: 1. The experimental 1st-order vertical mode natural frequency of the floating slab under train load was obtained using the NExT/ARMA algorithms. This index is most sensitive to the number of failed springs but is insensitive to the spring failure gap or failure location. Thus, it can be used to determine the number of failed steel springs. 2. The maximum vertical dynamic displacement has an excellent linear relationship with the total failure gap, but is relatively unaffected by the specific distribution of the locations of failed springs. Due to the complexity of track parameters, it is difficult to identify the failure gap accurately but it can nevertheless be roughly estimated. 3. The RMS of the response angles is susceptible to the number, severity, and location of failures. However, the magnitudes of the practical values of the rotation angles are very stable for the specific distribution of failure positions, enabling the failure position to be determined. According to the above observations, a set of identification methods for steel spring failure was established. Firstly, the number of failures was determined using the identified 1st-order vertical mode natural frequency and then the failure severity was determined from the maximum vertical dynamic displacement. The failure position was obtained from the RMS of the rotations in each direction. This study considered only the damage location identification of one or two springs. Using the above methods, the ISFST was established utilizing the DBSCAN algorithm and statistical analysis and used successfully to detect the failures of steel springs on-site, which were consistent with the field investigation results. After repair, the 1st-order vertical mode natural frequency returned to its pre-damage average level. In addition to the steel spring failure mentioned in this study, there are also shear hinge fractures and fastener failures in floating slab track. The identification of these defects is worth further research. This work is supported by the National Natural Science Foundation of China (Nos. 51978585 and 52008264), the Applied Basic Research Programs of Science and Technology Commission Foundation of Sichuan Province (No. 2020YJ0214), the Foundation of High-speed Rail Joint Fund Key Projects of Basic Research (No. U1734207), and the Foundation of National Engineering Laboratory for Digital Construction Evaluation Technology of Urban Rail Transit, China (No. 2023JZ01). Junyuan ZHENG designed the research. Caiyou ZHAO, Jian WANG, and Bolong JIANG processed the corresponding data. Junyuan ZHENG wrote the first draft of the manuscript. Duojia SHI, Ping WANG, and Xi SHENG helped to organize the manuscript. Junyuan ZHENG revised and edited the final version. Junyuan ZHENG, Caiyou ZHAO, Duojia SHI, Ping WANG, Jian WANG, Bolong JIANG, and Xi SHENG declare that they have no conflict of interest. Ankrah AA, Kimotho JK, Muvengei OM, 2020. Fusion of model-based and data driven based fault diagnostic methods for railway vehicle suspension., 12(3):51-81. https://doi.org/10.4236/jilsa.2020.123004 Auersch L, 2017. Static and dynamic behaviours of isolated or unisolated ballast tracks using a fast wavenumber domain method., 87(3):555-574. https://doi.org/10.1007/s00419-016-1209-6 Bashir S, Akhtar N, 2022. Development of low-frequency mass spring system for underground high-speed railways., 10(2):559-579. https://doi.org/10.1007/S42417-021-00392-W Bertha M, Golinval JC, 2017. Identification of non-stationary dynamical systems using multivariate ARMA models., 88:166-179. https://doi.org/10.1016/j.ymssp.2016.11.024 Chandran P, Thiery F, Odelius J, et al., 2022. Unsupervised machine learning for missing clamp detection from an in-service train using differential eddy current sensor., 14(2):1035. https://doi.org/10.3390/su14021035 Collier M, 2003. A micro-AGV for flexible manufacturing in small enterprises., 14(5):442-448. https://doi.org/10.1108/09576060310477843 Cong JL, Gao MY, Wang Y, et al., 2020. Subway rail transit monitoring by built-in sensor platform of smartphone., 21(8):1226-1238. https://doi.org/10.1631/FITEE.1900242 Cui XL, Chen GX, Yang HG, et al., 2016. Study on rail corrugation of a metro tangential track with Cologne-egg type fasteners., 54(3):353-369. https://doi.org/10.1080/00423114.2015.1137955 Dersch MS, Khachaturian C, Edwards JR, 2021. Methods to mitigate railway premium fastening system spike fatigue failures using finite element analysis., 121:105160. https://doi.org/10.1016/j.engfailanal.2020.105160 Dilena M, Limongelli MP, Morassi A, 2015. Damage localization in bridges via the FRF interpolation method., 52-53:162-180. https://doi.org/10.1016/j.ymssp.2014.08.014 Gomes GF, Giovani RS, 2022. An efficient two-step damage identification method using sunflower optimization algorithm and mode shape curvature (MSDBI–SFO)., 38(2):1711-1730. https://doi.org/10.1007/s00366-020-01128-2 Hong N, Li LS, Yao WR, et al., 2020. High-speed rail suspension system health monitoring using multi-location vibration data., 21(7):2943-2955. https://doi.org/10.1109/tits.2019.2921785 James III GH, Carne TG, Laufer JP, 1995. The natural excitation technique (NExT) for modal parameter extraction from operating structures., 10(4):260-277. Lam HF, Wong MT, Yang YB, 2012. A feasibility study on railway ballast damage detection utilizing measured vibration of in situ concrete sleeper., 45:284-298. https://doi.org/10.1016/j.engstruct.2012.06.022 Li SS, 2020. An improved DBSCAN algorithm based on the neighbor similarity and fast nearest neighbor query., 8:47468-47476. https://doi.org/10.1109/ACCESS.2020.2972034 Li ZW, Liu XZ, Lu HY, et al., 2020. Surface crack detection in precasted slab track in high-speed rail via infrared thermography., 13(21):4837. https://doi.org/10.3390/ma13214837 Loveday PW, Long CS, Ramatlo DA, 2020. Ultrasonic guided wave monitoring of an operational rail track., 19(6):1666-1684. https://doi.org/10.1177/1475921719893887 Nelson JT, Watry DL, Amato MA, et al., 2018. Sound transit prototype high performance low frequency floating slab testing and evaluation.: Anderson D, Gautier PE, Iida M, et al. (Eds.), Noise and Vibration Mitigation for Rail Transportation Systems. Springer, Heidelberg, Germany, p.607-618. https://doi.org/10.1007/978-3-319-73411-8_48 Rajaram S, Nelson JT, 2019. High-performance floating slab track: design and construction improvements based on lessons learned from prototype slabs., 2673(1):300-309. https://doi.org/10.1177/0361198118823004 Ramos A, Correia AG, Calçada R, et al., 2021. Influence of track foundation on the performance of ballast and concrete slab tracks under cyclic loading: physical modelling and numerical model calibration., 277:122245. https://doi.org/10.1016/j.conbuildmat.2021.122245 Rio G, Soive A, Grolleau V, 2005. Comparative study of numerical explicit time integration algorithms., 36(4):252-265. https://doi.org/10.1016/j.advengsoft.2004.10.011 Shen ZY, Hedrick JK, Elkins JA, 1983. A comparison of alternative creep force models for rail vehicle dynamic analysis., 12(1-3):79-83. https://doi.org/10.1080/00423118308968725 Sitharam TG, Sebastian R, Fazil F, 2018. Vibration isolation of buildings housed with sensitive equipment using open trenches–case study and numerical simulations., 115:344-351. https://doi.org/10.1016/j.soildyn.2018.08.033 Talbot JP, 2016. Base-isolated buildings: towards performance-based design., 169(8):574-582. https://doi.org/10.1680/jstbu.15.00057 Tamagawa S, 2021. Determination of load test conditions for rail fastenings of a floating slab track., 9(1):14-27. https://doi.org/10.2495/CMEM-V9-N1-14-27 Vandiver JK, Dunwoody AB, Campbell RB, et al., 1982. A mathematical basis for the random decrement vibration signature analysis technique., 104(2):307-313. https://doi.org/10.1115/1.3256341 Wang L, Zhao YN, Sang T, et al., 2022. Ultra-low frequency vibration control of urban rail transit: the general quasi-zero-stiffness vibration isolator., 60(5):1788-1805. https://doi.org/10.1080/00423114.2021.1874428 Wickramasinghe WR, Thambiratnam DP, Chan THT, 2020. Damage detection in a suspension bridge using modal flexibility method., 107:104194. https://doi.org/10.1016/j.engfailanal.2019.104194 Wilson GP, Saurenman HJ, Nelson JT, 1983. Control of ground-borne noise and vibration., 87(2):339-350. https://doi.org/10.1016/0022-460X(83)90573-4 Xu FZ, Song XL, Yang JJ, 2020. Influence of steel spring failure of floating slab track on vibration characteristics of infrastructure.: Tutumluer E, Chen XB, Xiao YJ (Eds.), Advances in Environmental Vibration and Transportation Geodynamics. Springer, Singapore, p.987-998. https://doi.org/10.1007/978-981-15-2349-6_67 Yu P, Manalo A, Ferdous W, et al., 2021. Failure analysis and the effect of material properties on the screw pull-out behaviour of polymer composite sleeper materials., 128:105577. https://doi.org/10.1016/j.engfailanal.2021.105577 Yuan XC, Zhu SY, Xu L, et al., 2020. Investigation of the vibration isolation performance of floating slab track with rubber bearings using a stochastic fractional derivative model., 234(9):992-1004. https://doi.org/10.1177/0954409719883552 Zhao CY, Liu DY, Zhang XM, et al., 2019. Influence of vibration isolator failure on vehicle operation performance and floating slab track structure vibration reduction effectiveness., 2019:8385310. https://doi.org/10.1155/2019/8385310 Zhao CY, Zheng JY, Sang T, et al., 2021. Computational analysis of phononic crystal vibration isolators via FEM coupled with the acoustic black hole effect to attenuate railway-induced vibration., 283:122802. https://doi.org/10.1016/j.conbuildmat.2021.122802 Zhu SY, Zhang QL, Zhai WM, et al., 2021. Sensor deploying for damage identification of vibration isolator in floating-slab track using deep residual network., 183:109801. https://doi.org/10.1016/j.measurement.2021.109801 Zou JH, Du TF, Chen W, et al., 2022. Experimental study of concrete floating slab municipal road with steel spring isolators under vehicle loads., 315:125686. https://doi.org/10.1016/j.conbuildmat.2021.125686 城市轨道交通钢弹簧浮置板轨道支承刚度失效识别方法:一项中国的案例研究 郑钧元1,2,赵才友1,2,师多佳1,2,王平1,2,王建3,姜博龙4,盛曦5 1西南交通大学,高速铁路线路工程教育部重点实验室,中国成都,610031;2西南交通大学,土木工程学院,中国成都,610031;3青岛零一动测数据科技有限公司,中国青岛,266000;4中国铁路设计集团有限公司,城市轨道交通数字化建设与测评技术国家工程研究中心,中国天津,300308;5深圳大学,城市智慧交通与安全运维研究院,中国深圳,518060 在列车往复动力作用和复杂环境因素耦合作用下,常出现诸如钢弹簧隔振器断裂、基底不均匀沉降诱发吊空等隔振器支承刚度失效的问题。本文提出一种钢弹簧浮置板轨道支承刚度失效的方法,能及时识别失效数量、失效程度、失效位置,以避免刚度失效引起的轨道结构劣化和行车安全威胁。 1. 分析隔振器支承刚度失效对浮置板轨道系统各动力指标的影响,并构建一套浮置板轨道钢弹簧失效识别方法;2. 结合具有噪声的基于密度的聚类方法(DBSCAN)算法和统计分析构建一套浮置板轨道支承刚度智能监测系统,并应用于中国南部某线路。 1. 通过动力响应敏感性分析,得出浮置板自振频率、动位移、转角对支承刚度失效的敏感性较高(图5和6);2. 通过分析多种刚度失效的情况,得出敏感性指标和支承刚度失效的关系(表3和4,图8);3. 基于上述成果,构建智能监测系统并应用到现场,验证方法的有效性(图13和15)。 1. 动力学模型的敏感性分析表明,列车荷载下的浮置板一阶垂向自振频率、最大垂向动位移、转角有效值易受刚度失效影响。2. 浮置板的一阶垂向频率主要跟失效数量有关;浮置板最大垂向动位移与失效高度具有较好的线性关系;浮置板转角之间的大小关系对失效位置很敏感。3. 以上述方法为理论基础构建浮置板轨道支承刚度智能监测系统,成功识别出钢弹簧失效。 浮置板轨道;支承刚度;精细化模型;失效识别;监测系统 https://doi.org/10.1631/jzus.A2300085 https://doi.org/10.1631/jzus.A2300085 Duojia SHI, https://orcid.org/0000-0001-5081-7973 Received Feb. 14, 2023; Revision accepted June 26, 2023; Crosschecked Jan. 3, 2024 © Zhejiang University Press 2024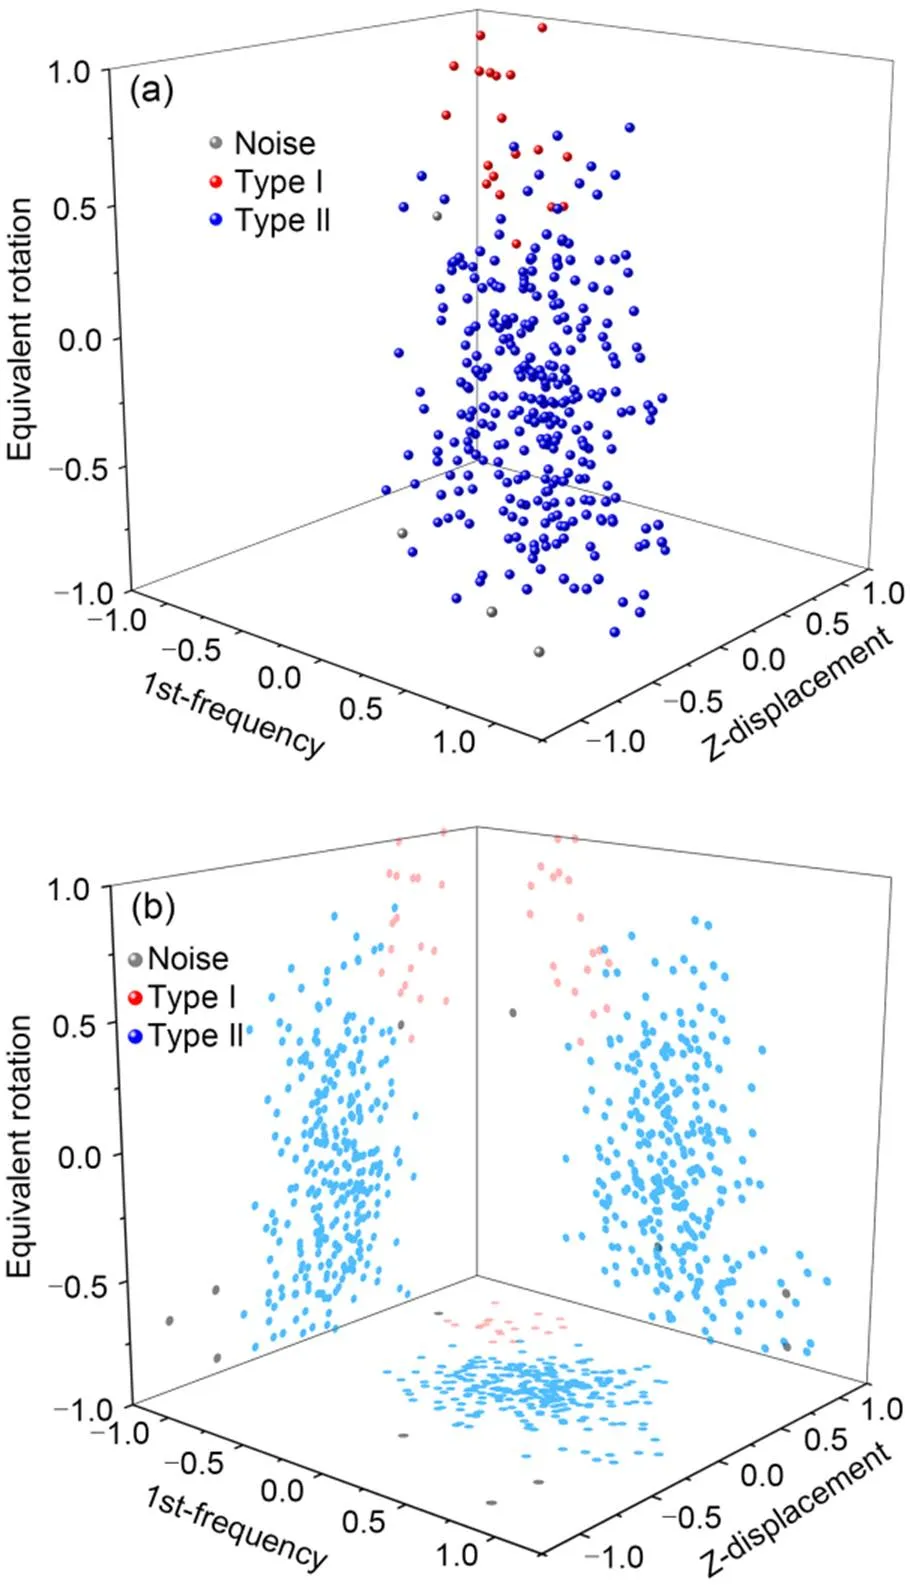
6 Conclusions
 Journal of Zhejiang University-Science A(Applied Physics & Engineering)2024年3期
- Journal of Zhejiang University-Science A(Applied Physics & Engineering)的其它文章
- Recent progress in the development of dielectric elastomer materials and their multilayer actuators
- Non-uniform thermal behavior of single-layer spherical reticulated shell structures considering time-variant environmental factors: analysis and design
- Synthesis and characterization of three new solid polyoxometalates based on Wells-Dawson-derived sandwich-type polyanions Co4(H2O)2(P2W15O56)2]16-
- Churning loss characteristics of a wet three-phase high-speed reluctance motor
- Development of underwater electric manipulator based on interventional autonomous underwater vehicle (AUV)
