Western Mining:Operating Performance in 2023 Achieving Historical High
Western Mining:Operating Performance in 2023 Achieving Historical High
At the beginning of January, Western Mining made the New Year Message of 2024, which expressed that the Company has been making outstanding performance featuring coordinated development of six industries in the past 10 years. In particular, the extension project of Yulong Copper Mine has been officially put into construction, making the dream of “building another new Western Mining” come true. The Company has been continuously making high-level profitability; operating revenue of company-owned products grew from RMB 5 billion to RMB 30 billion; spent less than 7 years to build 6 “new Western Mining”; comprehensively completed the strategic task of “building confidence inside and building image outside, starting a new undertaking and creating a resplendent moment”, and create Western Mining benefit and reshape Western Mining image.
According to Western Mining, looking back on 2023, the Company has been transforming from scale merit to quality benefit; main mine business is making steady progress; smelting enterprises comprehensively reached target output; salt lake resources are being utilized efficiently; operating performance achieved historical high; main business indicators surpassed the same period in the past, surpassed expectation and surpassed history; the Company takes a firm step forward to a first-class modern enterprise in China. According to Western Mining, 2024 is the critical year when the Company implements “The 14th Five Year Plan” for Development and accelerates the construction of a first-class modern enterprise in China; it is the critical year the Company improves quality development and seek common progress of development and efficiency. It is a major subject for the Company to “get stronger and get more outstanding” in current and future period.
According to information, Western Mining owns 2146.49 tons of silver metal. The affiliated Sichuan Gacun Silver Polymetallic Mine is famous for integrated enrichment of silver, lead, zinc, and copper. Xitie Mountain Lead Zinc mine, Yulong Copper mine and Huogeqi Copper mine is rich in symbiotic silver metal resources and associated silver metal resources. Western Mining made introduction in its 2023 semi-annual report that as of June, 30th, 2023, the Company totally owns 6177400 tons of copper metal, 1651300 tons of lead metal, 2881500 tons of zinc metal, 372200 tons of molybdenum metal, 644300 tons of Vanadium Pentoxide, 271200 tons of nickel metal, 127500 tons of gold metal, 21464900 tons of silver metal, 258614600 tons of iron (ore quantity), and 30462500 tons of magnesium chloride.
As the second biggest lead zinc concentrate producer and the fifth biggest copper concentrate producer in China, Western Minig is mainly engaged in the mining and dressing, smelting and trade of base metal and ferrous metal such as copper, lead, zinc, iron, nickel, vanadium and molybdenum; and the production and sales of rare and precious metals such as gold and silver, and sulfur concentrate. In November, 2023, “Western Mining” Grade A copper (produced by Qinghai Copper Co., Ltd., affiliated to Western Mining) successfully got approved in delivery brand registration in ShFE, with registered capacity of 100000 tons. “Western Mining” Grade A copper is eligible for futures contract performance delivery.
Unit: metric ton

Name of province or cityProduction inNov. 2023Total outputJan.-Nov. 2023% Change2022-2023 Shanxi12139126725-3.77 Inner-Mongolia725967325227.18 Liaoning1012910855932.78 Jilin11601117705-4.93 Jiangsu2199127579811.01 Zhejiang540055782968.19 Anhui9977411047009.17 Fujian746767966394.28 Jiangxi17054217813167.55 Shandong159679133690629.93 Henan515046243793.5 Hubei6439469940431.59 Hunan163481682403.74 Guangdong2037926181479.32 Guangxi99719103062113.79 Sichuan22258-16.96 Yunnan554686262373.17 Tibet4544908-6.92 Shaanxi78811-50.58

Gansu111953104038523.5 Xinjiang990812885112.61 Total output China11404781181070213.26
Unit: metric ton
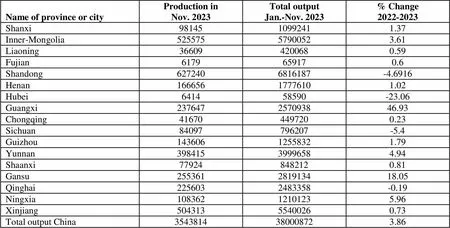
Name of province or cityProduction inNov. 2023Total outputJan.-Nov. 2023% Change2022-2023 Shanxi9814510992411.37 Inner-Mongolia52557557900523.61 Liaoning366094200680.59 Fujian6179659170.6 Shandong6272406816187-4.6916 Henan16665617776101.02 Hubei641458590-23.06 Guangxi237647257093846.93 Chongqing416704497200.23 Sichuan84097796207-5.4 Guizhou14360612558321.79 Yunnan39841539996584.94 Shaanxi779248482120.81 Gansu255361281913418.05 Qinghai2256032483358-0.19 Ningxia10836212101235.96 Xinjiang50431355400260.73 Total output China3543814380008723.86
Unit: metric ton

Name of metalProduction inNov. 2023Total outputJan.-Nov. 2023% Change2022-2023 Copper11404781181070213.26 Aluminium3543814380008723.86 Lead653399689540712.2 Zinc65765564875197.29 Nickel------ Tin------ Antimony------ Mercury------ Magnesium------ Titanium------ Total China6503765679599287.23
Unit: metric ton
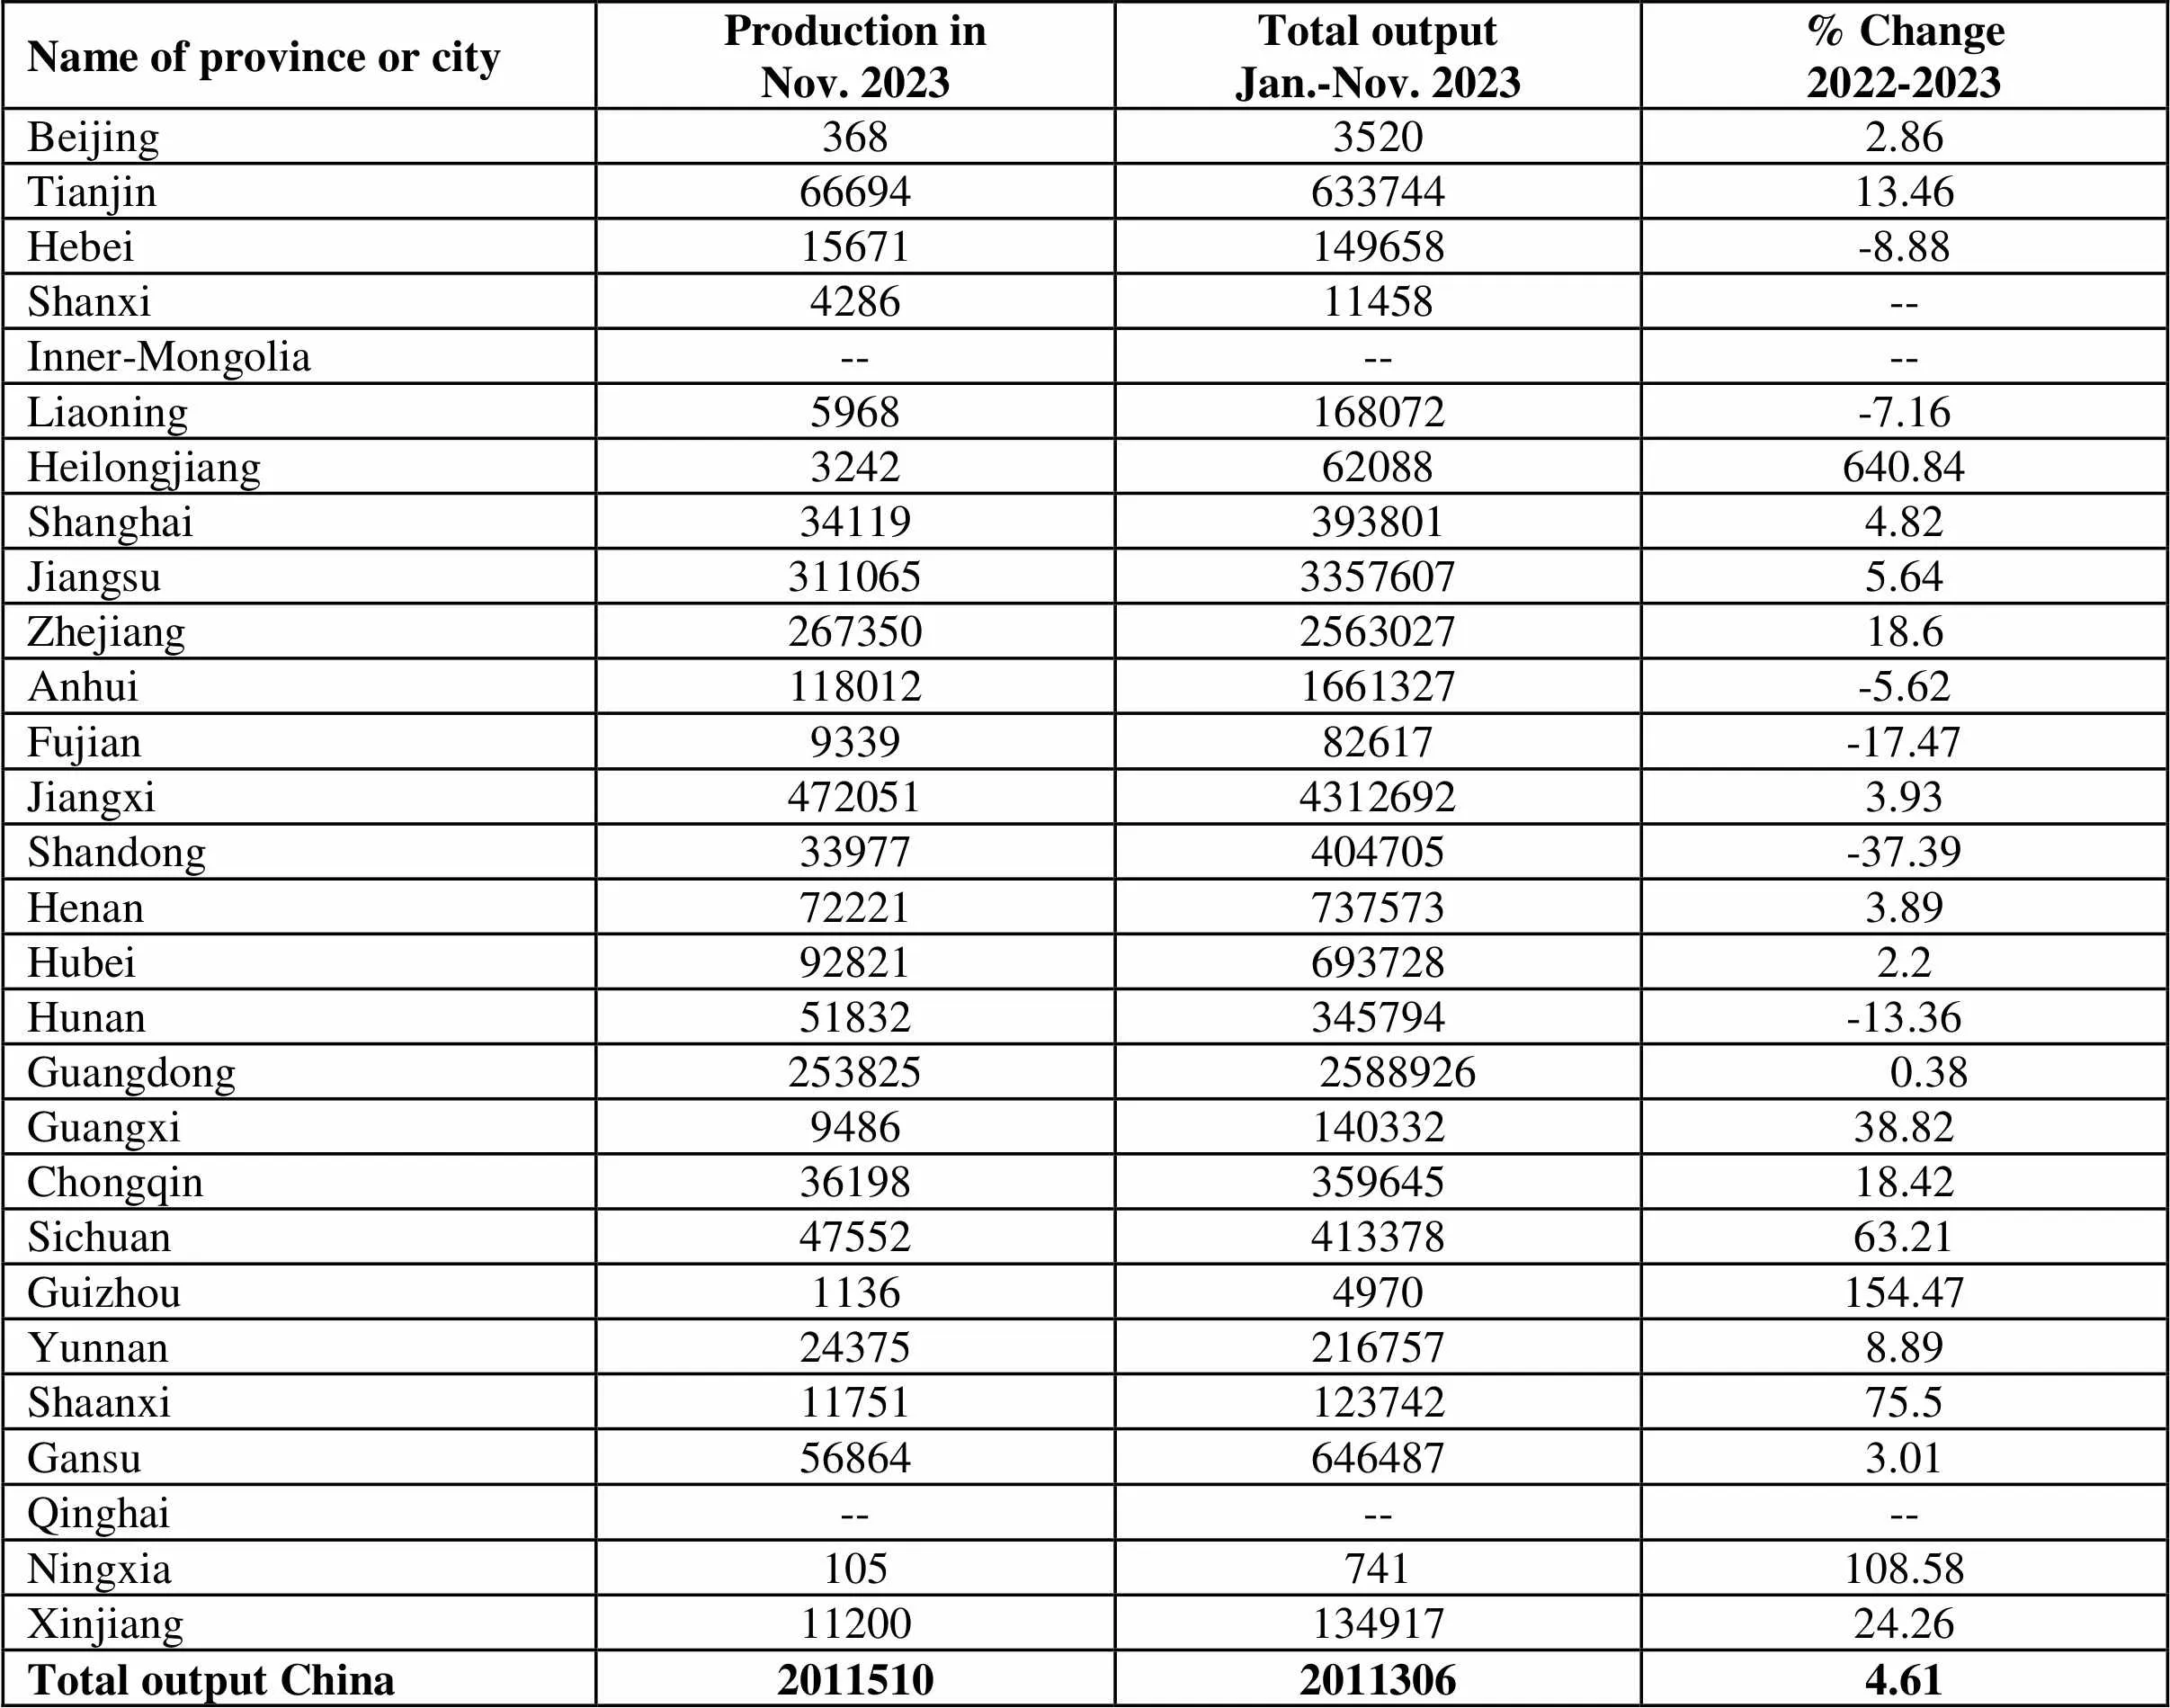
Name of province or cityProduction inNov. 2023Total outputJan.-Nov. 2023% Change2022-2023 Beijing36835202.86 Tianjin6669463374413.46 Hebei15671149658-8.88 Shanxi428611458-- Inner-Mongolia------ Liaoning5968168072-7.16 Heilongjiang324262088640.84 Shanghai341193938014.82 Jiangsu31106533576075.64 Zhejiang267350256302718.6 Anhui1180121661327-5.62 Fujian933982617-17.47 Jiangxi47205143126923.93 Shandong33977404705-37.39 Henan722217375733.89 Hubei928216937282.2 Hunan51832345794-13.36 Guangdong25382525889260.38 Guangxi948614033238.82 Chongqin3619835964518.42 Sichuan4755241337863.21 Guizhou11364970154.47 Yunnan243752167578.89 Shaanxi1175112374275.5 Gansu568646464873.01 Qinghai------ Ningxia105741108.58 Xinjiang1120013491724.26 Total output China201151020113064.61
Unit: metric ton
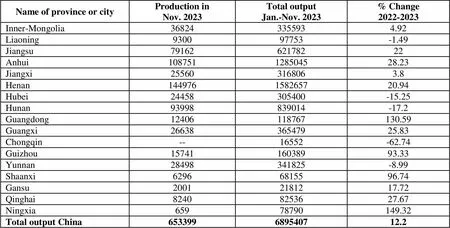
Name of province or cityProduction inNov. 2023Total outputJan.-Nov. 2023% Change2022-2023 Inner-Mongolia 368243355934.92 Liaoning930097753-1.49 Jiangsu7916262178222 Anhui108751128504528.23 Jiangxi255603168063.8 Henan144976158265720.94 Hubei24458305400-15.25 Hunan93998839014-17.2 Guangdong12406118767130.59 Guangxi2663836547925.83 Chongqin--16552-62.74 Guizhou1574116038993.33 Yunnan28498341825-8.99 Shaanxi62966815596.74 Gansu20012181217.72 Qinghai82408253627.67 Ningxia65978790149.32 Total output China653399689540712.2
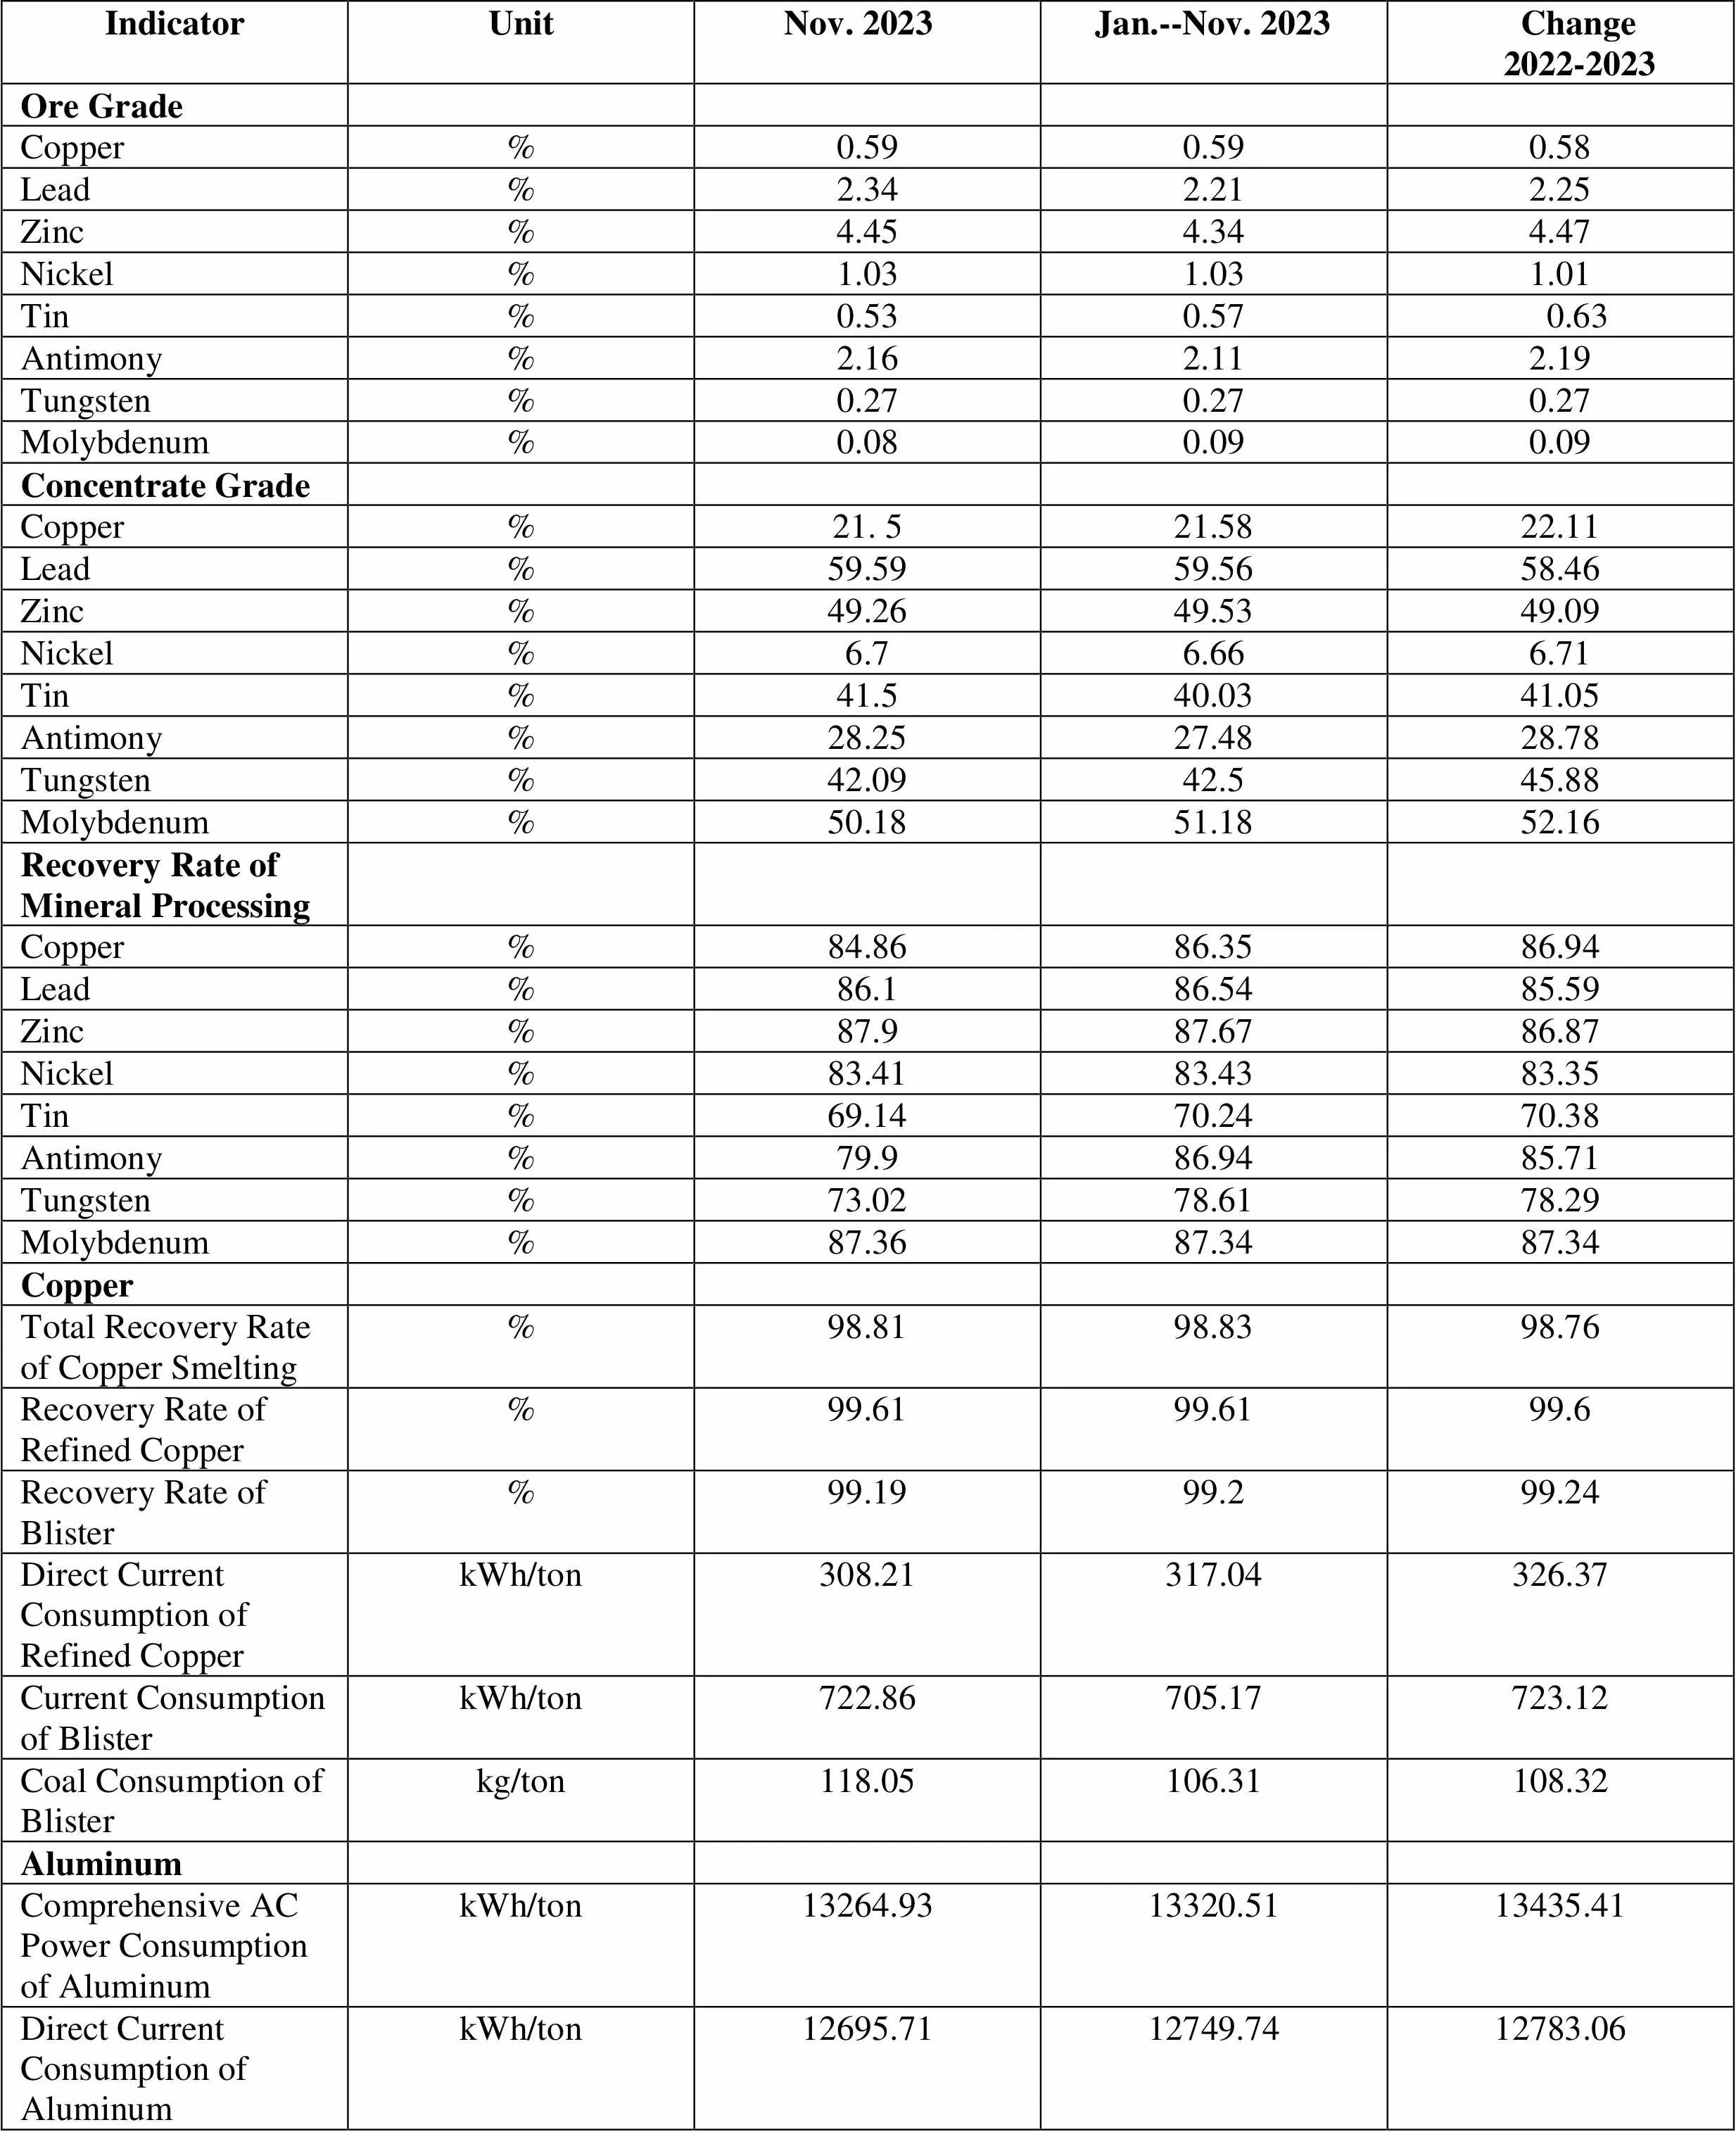
IndicatorUnitNov. 2023Jan.--Nov. 2023 Change 2022-2023 Ore Grade Copper%0.590.590.58 Lead%2.342.212.25 Zinc%4.454.344.47 Nickel%1.031.031.01 Tin%0.530.570.63 Antimony%2.162.112.19 Tungsten%0.270.270.27 Molybdenum%0.080.090.09 Concentrate Grade Copper%21. 521.5822.11 Lead%59.5959.5658.46 Zinc%49.2649.5349.09 Nickel%6.76.666.71 Tin%41.540.0341.05 Antimony%28.2527.4828.78 Tungsten%42.0942.545.88 Molybdenum%50.1851.1852.16 Recovery Rate of Mineral Processing Copper%84.8686.3586.94 Lead%86.186.5485.59 Zinc%87.987.6786.87 Nickel%83.4183.4383.35 Tin%69.1470.2470.38 Antimony%79.986.9485.71 Tungsten%73.0278.6178.29 Molybdenum%87.3687.3487.34 Copper Total Recovery Rate of Copper Smelting%98.8198.8398.76 Recovery Rate of Refined Copper%99.6199.6199.6 Recovery Rate of Blister%99.1999.299.24 Direct Current Consumption of Refined CopperkWh/ton308.21317.04326.37 Current Consumption of BlisterkWh/ton722.86705.17723.12 Coal Consumption of Blisterkg/ton118.05106.31108.32 Aluminum Comprehensive AC Power Consumption of AluminumkWh/ton13264.9313320.5113435.41 Direct Current Consumption of AluminumkWh/ton12695.7112749.7412783.06

IndicatorUnitNov. 2023Jan.--Nov. 2023 Change 2022-2023 Alumina Consumption of Aluminumkg/ton1906.51906.121909.56 Total Recovery Rate of Aluminakg/ton78.9680.1480.42 Soda consumption of Aluminakg/ton133.8133.98132.56 Lead Total Recovery Rate of Lead Smelting%97.3497.3197.28 Recovery Rate of Lead Bullion%98.3698.3998.28 Coal Consumption of Lead Bullionkg/ton407.66396.07446.88 Direct Current Consumption of Refined LeadkWh/ton127.28122.9116.99 Zinc Total Recovery Rate of Refined Zinc%96.3596.4996.16 Direct Current Consumption of Refined ZinckWh/ton3134.453124.913102.27 Tin Total Recovery Rate of Tin Smelting%96.497.4898.57 Direct Current Consumption of Tin SmeltingkWh/ton2228.642195.532199.41 Coal Consumption of Tin Smeltingkg/ton1343.421270.21276.01 Nickel Total Recovery Rate of Nickel Smelting%94.194.2694.15 Antimony Total Recovery Rate of Antimony Smelting%98.7398.397.53 Direct Current Consumption of Antimony SmeltingkWh/ton458.47609.74634.58 Yield of Processed Material Rate of Total Copper Products%83.4882.1681.76 Copper Melting %96.195.7395.14 Copper Processing Products%85.6985.4385.8 Rate of Total Aluminum Products%65.5567.4668.92 Aluminum Melting%88.2988.7289.15 Aluminum Processing Products%71.2773.1776.9
Unit: metric ton

Name of province Production inNov. 2023Total outputJan.-Nov. 2023% Change2022-2023 Shanxi170405717898943-5.84 Inner-Mongolia------ Shandong2493047270243085.99 Henan7448107933213-13.89 Guangxi1120339126773468.83 Chongqing375908404446526.22 Sichuan324834949-13.63 Guizhou40361544521190.96 Yunnan12622513828289.41 Total output China6986743755972221.11
Unit: metric ton
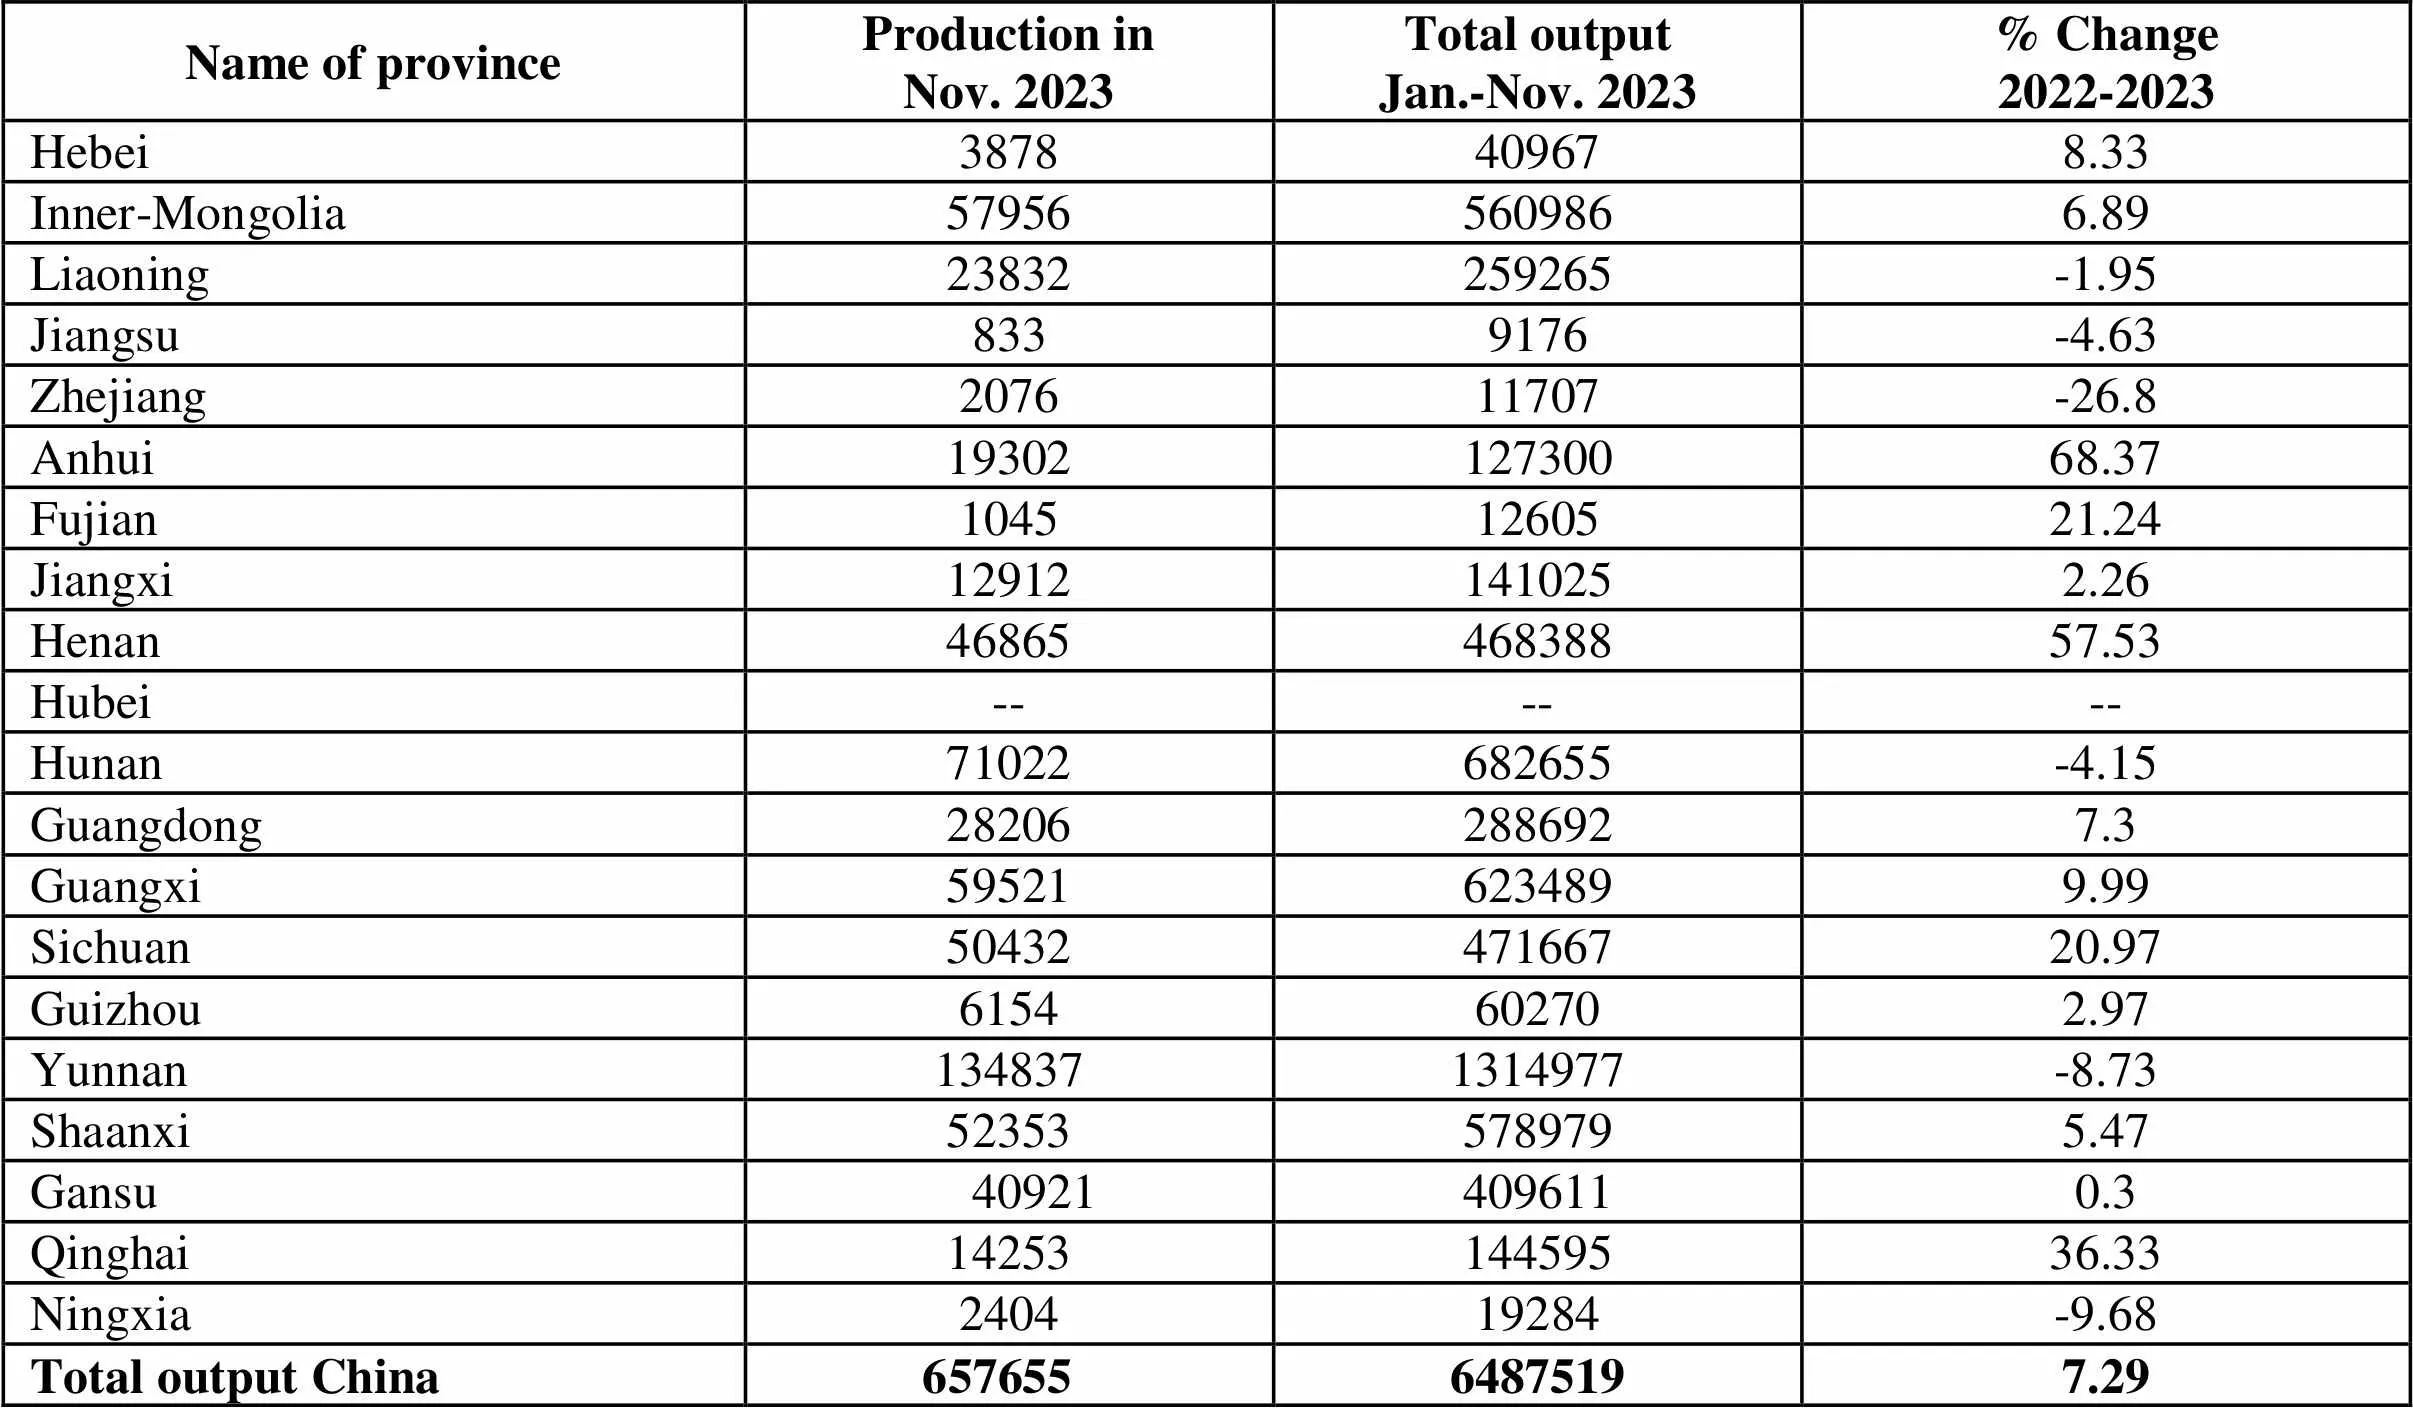
Name of provinceProduction inNov. 2023Total outputJan.-Nov. 2023% Change2022-2023 Hebei3878409678.33 Inner-Mongolia579565609866.89 Liaoning23832259265-1.95 Jiangsu8339176-4.63 Zhejiang207611707-26.8 Anhui1930212730068.37 Fujian10451260521.24 Jiangxi129121410252.26 Henan4686546838857.53 Hubei------ Hunan71022682655-4.15 Guangdong282062886927.3 Guangxi595216234899.99 Sichuan5043247166720.97 Guizhou6154602702.97 Yunnan1348371314977-8.73 Shaanxi523535789795.47 Gansu409214096110.3 Qinghai1425314459536.33 Ningxia240419284-9.68 Total output China65765564875197.29
