Microstructure Characterization of Bubbles in Gassy Soil Based on the Fractal Theory
WU Chen , LIN Guoqing , , LIU Lele , LIU Tao , ,LI Chengfeng and GUO Zhenqi
1) Shandong Provincial Key Laboratory of Marine Environment and Geological Engineering, Ocean University of China, Qingdao 266100, China
2) Key Laboratory of Gas Hydrate, Ministry of Natural Resources, Qingdao Institute of Marine Geology,Qingdao 266237, China
3) College of Environmental Science and Engineering, Ocean University of China, Qingdao 266100, China
4) Key Laboratory of Marine Environment and Ecology, Ministry of Education, Ocean University of China,Qingdao 266100, China
5) Qingdao National Laboratory for Marine Science and Technology, Qingdao 266237,China
Abstract The microscopic characterization of isolated bubbles in gassy soil plays an important role in the macroscopic physical properties of sediments and is a key factor in the study of geological hazards in gas-bearing strata. Based on the box-counting method and the pore fractal features in porous media, a fractal model of bubble microstructure parameters in gassy soil under different gas contents and vertical load conditions is established by using an industrial X-ray CT scanning system. The results show that the fractal dimension of bubbles in the sample is correlated with the volume fraction of bubbles, and it is also restricted by the vertical load. The three-dimensional fractal dimension of the sample is about 1 larger than the average two-dimensional fractal dimension of all the slices from the same sample. The uniform porous media fractal model is used to test the equivalent diameter, and the results show that the variation of the measured pore diameter ratio is jointly restricted by the volume fraction and the vertical load. In addition, the measured self-similarity interval of the bubble area distribution is tested by the porous media fractal capillary bundle model, and the fitting curve of measured pore area ratio in a small loading range is obtained in this paper.
Key words gassy soil; bubble microstructure parameters; fractal dimension; vertical load
1 Introduction
Due to many natural and human causes (e.g., global warming, oil and gas exploitation), natural gas hydrates in the submarine reservoir can decompose and release free gas(mainly methane). The free gas will temporarily stay in the marine sediments and then migrate upward to the seabed surface, normally occurring in a discrete form. This kind of sediments with discrete gas bubbles is called gassy soil.Not all the gases within gassy soil in nature come from natural gas hydrates, they can also be directly produced by microbial degradation of organic matter under anaerobic conditions and thermogenic methanogenesis (Liet al.,2019, 2021a). Gassy soil or gassy sediment is widely distributed in the coastal areas of continents (Fleischeret al.,2001; Liet al., 2021b). Gassy soil has characteristics of large porosity, under compaction, poor cementation, and partial non-uniformity, which easily lead to insufficient bearing capacity of the overlying strata. Under the external load, it is easy to deform and lead to subsidence after gas evolution, causing threats to the stability of seabed equipment and the safety of marine engineering projects (Liuet al., 2022). For example, in the Quaternary deposit along the coastal region of Shanghai, plenty of methane gas released during urbanization and leaded to burning, poisoning,and instability of submarine structures (Xuet al., 2017).Therefore, mechanical properties of gassy soil and the disaster-causing mechanism have become increasingly important in the field of marine geotechnical engineering.
At present, there are a lot of studies focusing on the macroscopic mechanics of gassy soil. Wheeler (1988) and Honget al. (2017) observed the microstructure within two samples of typical fine-grained gassy soil by using scanning electron microscope (SEM). It is shown that the undissolved gas in the saturated matrix occurs in the form of large discrete bubbles, and the size of bubbles is much larger than those of soil particles and pores in the matrix.This not only changes the compression characteristics of pore fluids but also significantly alters the microstructure of soil, affecting mechanical properties of gassy soil. Thomas (1987) carried out a series of one-dimensional consolidation tests on remolded gassy soil (undrained when loaded, then drained), and found that, with the increase of gas contents, the compressibility of gassy soil increases,and the compression curve of gassy soil will eventually coincide with the compression curve of saturated soil. Honget al. (2017) systematically studied the undrained shear characteristics of remolded gassy silt under the condition of large initial pore water pressure. The results show that the existence of bubbles will significantly affect the undrained shear behavior of aerated soil, and the shearing process may produce excess pore water pressure, which depends on the initial pore water pressure and the initial gas content. Sultanet al.(2012) studied the effects of gas evolution and bubble expansion on the consolidation and undrained shear characteristics of gassy soil during undrained unloading processes. The test results showed that the gas evolution and bubble expansion caused by the pressure unloading would enhance the compressibility of gassy soil but reduce its pre-consolidation pressure. The undrained shear strength was significantly reduced, and the structural changes caused by the gas evolution would affect the effective stress path. At the microscopic level, Honget al.(2019) conducted the experiments under one-dimensional consolidation conditions and found that, with the increase of vertical load, bubbles were mainly compressed along the direction of vertical load, while there is basically no compression in the horizontal direction. However, the distribution of isolated bubbles in gassy soil is very complex.Understanding of the evolved microstructure of gassy soil under different external conditions is still insufficient, and the microscopic response mechanism of macroscopic mechanical properties remains elusive. There are limitations in the application and promotion of relevant constitutive models, which seriously restrict the accurate prediction on mechanical properties of gassy soil and the effective prevention and control of engineering accidents.
The fractal theory is proposed and created by Mandelbrot (1967), which can describe disordered chaos phenomena and irregular shapes without the limitation of cross scale. The fractal theory has been widely used in the field of sediment particle and pore distribution (Katz and Thompson, 1985; Rieu and Sposito, 1991; Yu, 2001; Yu and Cheng,2002a; Shenget al., 2020; Wood, 2021) and hydrate features (Liuet al., 2020a, 2021). It is found that the pore space of sediment samples has obvious fractal characteristics in a certain scale range. Fractal parameters such as pore size fractal dimension, tortuosity fractal dimension, and maximum pore diameter are usually used to quantify the pore structure of porous materials. Based on the pore structure characterization, constitutive models for hydraulic and electrical properties of porous media have achieved well prediction performances (Liuet al., 2020b; Zhanget al.,2021).
Therefore, in this paper, the fractal theory is used to quantitatively characterize the bubble distribution in gassy soil remolded by using sediments from the Yellow River Delta. The fractal parameters to describe the bubble distribution are extracted from X-ray computed tomography (CT)scanning images under different gas-content and load conditions, and characteristics of the bubble distribution in gassy soil and its influence on mechanical properties of gassy soil are discussed. It provides basic support for the prevention and controlling of marine engineering accidents in the offshore area.
2 Methodology
2.1 Test Equipment and Experimental Material
In this paper, all the X-ray CT images were obtained by using a Phoenix v | tome | x industrial CT scanner produced by GE. The scanner has a 180 kV / 15 W high-power nanofocus X-ray tube and three 240 kV / 320 W micro-focus X-ray tubes, which are described in detail by Zhanget al.(2020). The images collected in the experiment are 1000 pixels × 1000 pixels, and each pixel represents 21 μm in this study. The device after consolidation was fixed on the rotary table in the X-ray CT scanning room, and the rotation step was set to 0.3˚ s−1. A miniature X-ray CT experimental device (Guoet al., 2021) with one-dimensional consolidation and multi-stage loading function is installed on the internal rotary table of the X-ray CT scanner to apply different vertical loads, as shown in Fig.1.
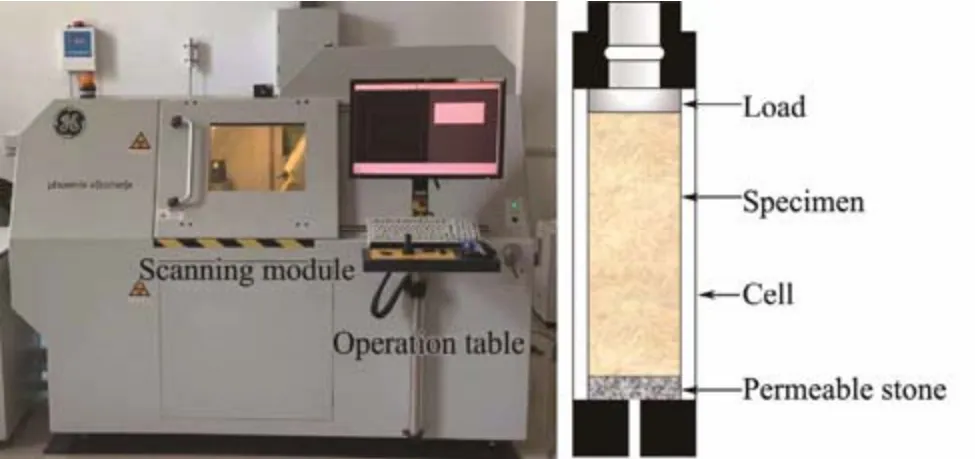
Fig.1 Phoenix v | tome | x industrial CT scanner and loading device.
The silt used in the experiment was collected from the Yellow River Delta. The sediment sample was placed in a ventilated and cool environment to air dry, and then the impurities were removed by using a 0.25 mm soil sieve. According to the method of ‘Geotechnical Test Method Standard’, the physical index experiment of the silt sample was carried out, and the measured parameters such as water content, dry density, specific gravity, and porosity were listed in Table 1.
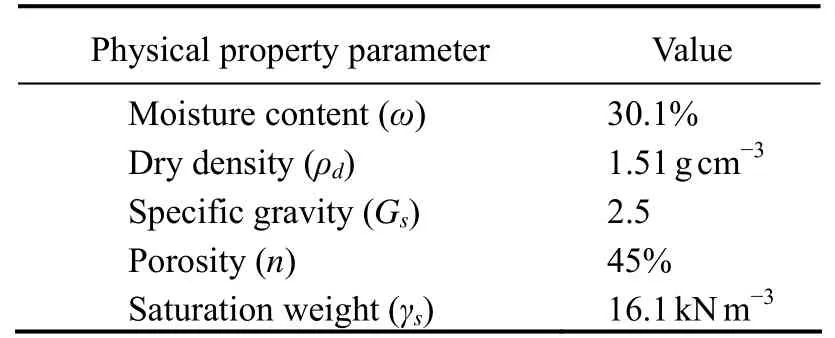
Table 1 Basic physical property parameters of the experimental material
2.2 Preparation of the Gassy Soil Sample
Due to the pressure release caused by deep-water sampling, the gas in silt will dissolve and expand which will change the soil skeleton structure and even produce cracks.Porous media introduction technology was used to prepare remolded gassy soil samples (Honget al., 2019). Due to the strong adsorption of zeolite powder, the small hole continuously absorbs nitrogen (N2) gas, which will exchange the water in the slurry in the next step, forming a porous medium filled with bubbles. And it is easy for small bubbles to form at the edges and corners of the porous medium,which will change the soil skeleton structure, closely resembling the bubbles in the sediments under marine environment. The detailed steps are described as follows:
The porous media materials (zeolite powder: average particle size of 0.8 μm – 3 μm) were dried at a high temperature (100℃, 36 h) and kept in a vacuum saturation instrument (−100 kPa, 36 h); then, the N2gas was pressed into porous media under high pressure (250 kPa, 48 h). The dry silt and stagnant water were mixed according to the ratio of 1:2wL, stirred evenly, and also kept in a vacuum saturated instrument (−100 kPa, 24 h). Finally, the N2saturated zeolite powder is mixed with the watery mud to exchange the N2gas with the water in the slurry, so that bubbles are formed in the silt. Then, carefully pour the slurry into the cylindrical chamber and apply various vertical stresses until the initial consolidation is completed.
Eight samples in two groups with different contents (10%and 20%) of zeolite powder were prepared. The vertical loads of 0 kPa, 2 kPa, 4 kPa, and 6 kPa were applied respectively, and the labels were S10-0, S10-2, S10-4, S10-6,S20-0, S20-2, S20-4, and S20-6, respectively. After 48 h consolidation, X-ray CT scanning experiments were carried out to observe the distribution of bubbles in the air-bearing soil samples under different air contents and loads.
The sample was rotated at a constant speed along the XY plane to complete the scanning process. Each scan takes about 22 min to obtain 1000 slices of original X-ray CT images, and these images are exported by using VG Studio MAX 2.1 software, followed by reconstruction and analyses by using Avizo 9.0 software.
2.3 Image Processing and Fractal Dimension Acquisition of Gas Bubbles
For noise reduction, the median filter method is used to minimize the signal distortion of sharp edges in the original gray images. Then, the optimal segmentation range of gas(Fig.2a) and matrix (Fig.2b) is found by threshold segmentation. The gas is expanded (Fig.2c) by Precise Dilation, and then the matrix part is subtracted by an algorithm.At the same time, the connected pores are subtracted to achieve the best bubble threshold segmentation effect (Fig.2d). After the segmentation, the Label Analysis module is used to extract the segmented bubbles, and the microscopic parameters of the bubble distribution are extracted after three-dimensional reconstruction, as shown in Fig.3.

Fig.2 Segmentation process. (a), gas (red) threshold segmentation; (b), matrix (white) threshold segmentation; (c), gas (blue)dilation; (d), final segmentation effect.

Fig.3 3D reconstruction effect of segmented gas phase extracted by using the Label Analysis module.
The fractal dimension is usually measured by box-counting method, that is, a series of boxes with the same scale are used to cover the object, and the number of boxes intersected with the measured object is calculated. Then the number of intersecting boxes is recalculated by changing the length of the box. Finally, the trendline of the box number with the length of the box is drawn in the double logarithmic coordinate system. The absolute value of the slope of the straight line is the ‘box dimension’ of the measured object.Dfis the fractal dimension of the porous media,which ranges from 0 to 2 in two dimensions (Df2) and 0 to 3 in three dimensions (Df3). In this paper, Fractal Dimension module in Avizo software is used to extract three-dimensional and two-dimensional fractal dimensions of the bubble distribution after segmentation.
3 Results and Analysis
3.1 Fractal Dimension and Volume Fraction of Gas
Fig.4 shows the relationship between the bubble volume fraction in gassy silt and the vertical load under different zeolite powder contents. The experimental data show that the bubble volume fraction decreases non-linearly with the increase of the vertical load. The bubble volume fraction decreased about 29.5% in S10 group, and 32.6% in S20 group when the vertical load increased from 0 kPa to 6 kPa.The upper limit of threshold segmentation is set to 19500 and 20000, and the results show that the three-dimensional fractal dimension numbers of bubble distribution change with the vertical loads under different segmentation conditions, as shown in Fig.5. In this paper, the upper limit of threshold segmentation of 20000 is selected for the better effect. It can be seen that the fractal dimension of bubble distribution decreases linearly with the increase of vertical load in general. Under the same vertical loading condition,values of the fractal dimension numbers of the bubble distribution in S10 samples are significantly smaller than those in S20 samples because of the bubble volume difference.

Fig.4 Effect of vertical loads on bubble volume fractions under different contents of zeolite powder.
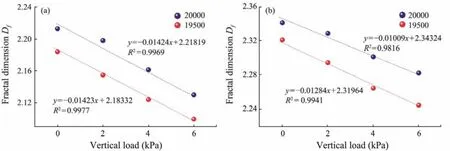
Fig.5 Comparison of three-dimensional fractal dimensions of bubbles with different segmentation thresholds in the sample group of (a) S10 and (b) S20.
The average value of two-dimensional fractal dimensions for all slices of each sample and the three-dimensional fractal dimension under different vertical load conditions are shown in Fig.6. It shows that the fractal dimension decreases with the increase of the vertical load. Combined with Fig.4,the fractal dimension decreases with the decrease of bubble volume fraction. The three-dimensional fractal dimension is about 1 larger than the mean value of two-dimensional fractal dimension of all slices from the same sample.

Fig.6 Differences between mean value of Df 2 and Df 3 for the same sample under various vertical loads. (a), S10; (b), S20.
The normalizedDf2(Two-dimensional fractal dimension divided by the maximum value) and the normalizedϕ(volume fraction divided by the maximum value) are plotted against the normalized slice number (slice number divided by the total number) for the slices 50 – 950 in Fig.7. It shows the relationships of fractal dimension and volume fraction in single slice are similar to the results of the whole sample, but the difference is more obvious in S20 group.The variation amplitude of bubble volume fraction in different slices is much higher than that of fractal dimension,and the variation amplitude in the slices from the sample S10-6 is particularly obvious. The analysis of single slice image shows that there are more irregular large bubbles in this sample, and most of bubble are flat, which will cause the fluctuations of bubble volume fractions obtained by our methods, but does not affect the measured fractal dimension.

Fig.7 Variations of normalized fractal dimension and volume fraction in all slices from one sample. (a), S10; (b), S20.
It can be seen from Fig.7 that the variation trends of fractal dimension and volume fraction are different. In the S20 group, the overall fractal dimension of the sample with the load of 2 kPa is greater than that of 0 kPa. Therefore,the slices at different normalized positions of samples 20-0 and 20-2 were analyzed, that is, the bubble equivalent diameter distribution in the slices at the abnormal normalized positions with inconsistent variations in fractal dimension and volume fraction were compared. By extracting the threshold segmentation effect maps from the slices at the normalized position of 0.55 and 0.65. It was found that the equivalent diameter distribution of the slices with higher two-dimensional fractal dimension was more uniform.
3.2 Microscopic Parameters of Large Bubbles
Because the mechanical properties of gassy soil are mainly affected by large bubbles (Wanget al., 2018; Gaoet al.,2020; Honget al., 2020, 2021), in this paper, only the bubbles with the equivalent diameter larger than 0.3 mm are analyzed, and the results are shown in Figs.8 and 9.
From Fig.8 and Fig.9, we can find that the distribution of bubbles with equivalent diameter greater than 1 mm is not correlated with the load and gas content, but when the larger bubbles with low sphericity increase, the equivalent diameter increases. The variation of bubble sphericity with loads in different samples for the bubbles with diameters greater than 1 mm and greater than 0.3 mm is shown in Fig.10. It can be seen that with the increase of loads, the spherical values generally show the downward trend. In the compression process, the volume change is mainly composed of two parts: gas compression and consolidation drainage. The overall spherical value did not change significantly in S10 because the gas content was low and the compression effect of gas in soil skeleton was not obvious.

Fig.8 Bubble extraction images with specific sizes in S10. (a), equivalent diameter > 1 mm (from left to right the vertical loads are 0, 2, 4, 6 kPa, respectively); (b), 1 mm > equivalent diameter > 0.3 mm (from left to right the loads are 0, 2, 4, 6 kPa, respectively).
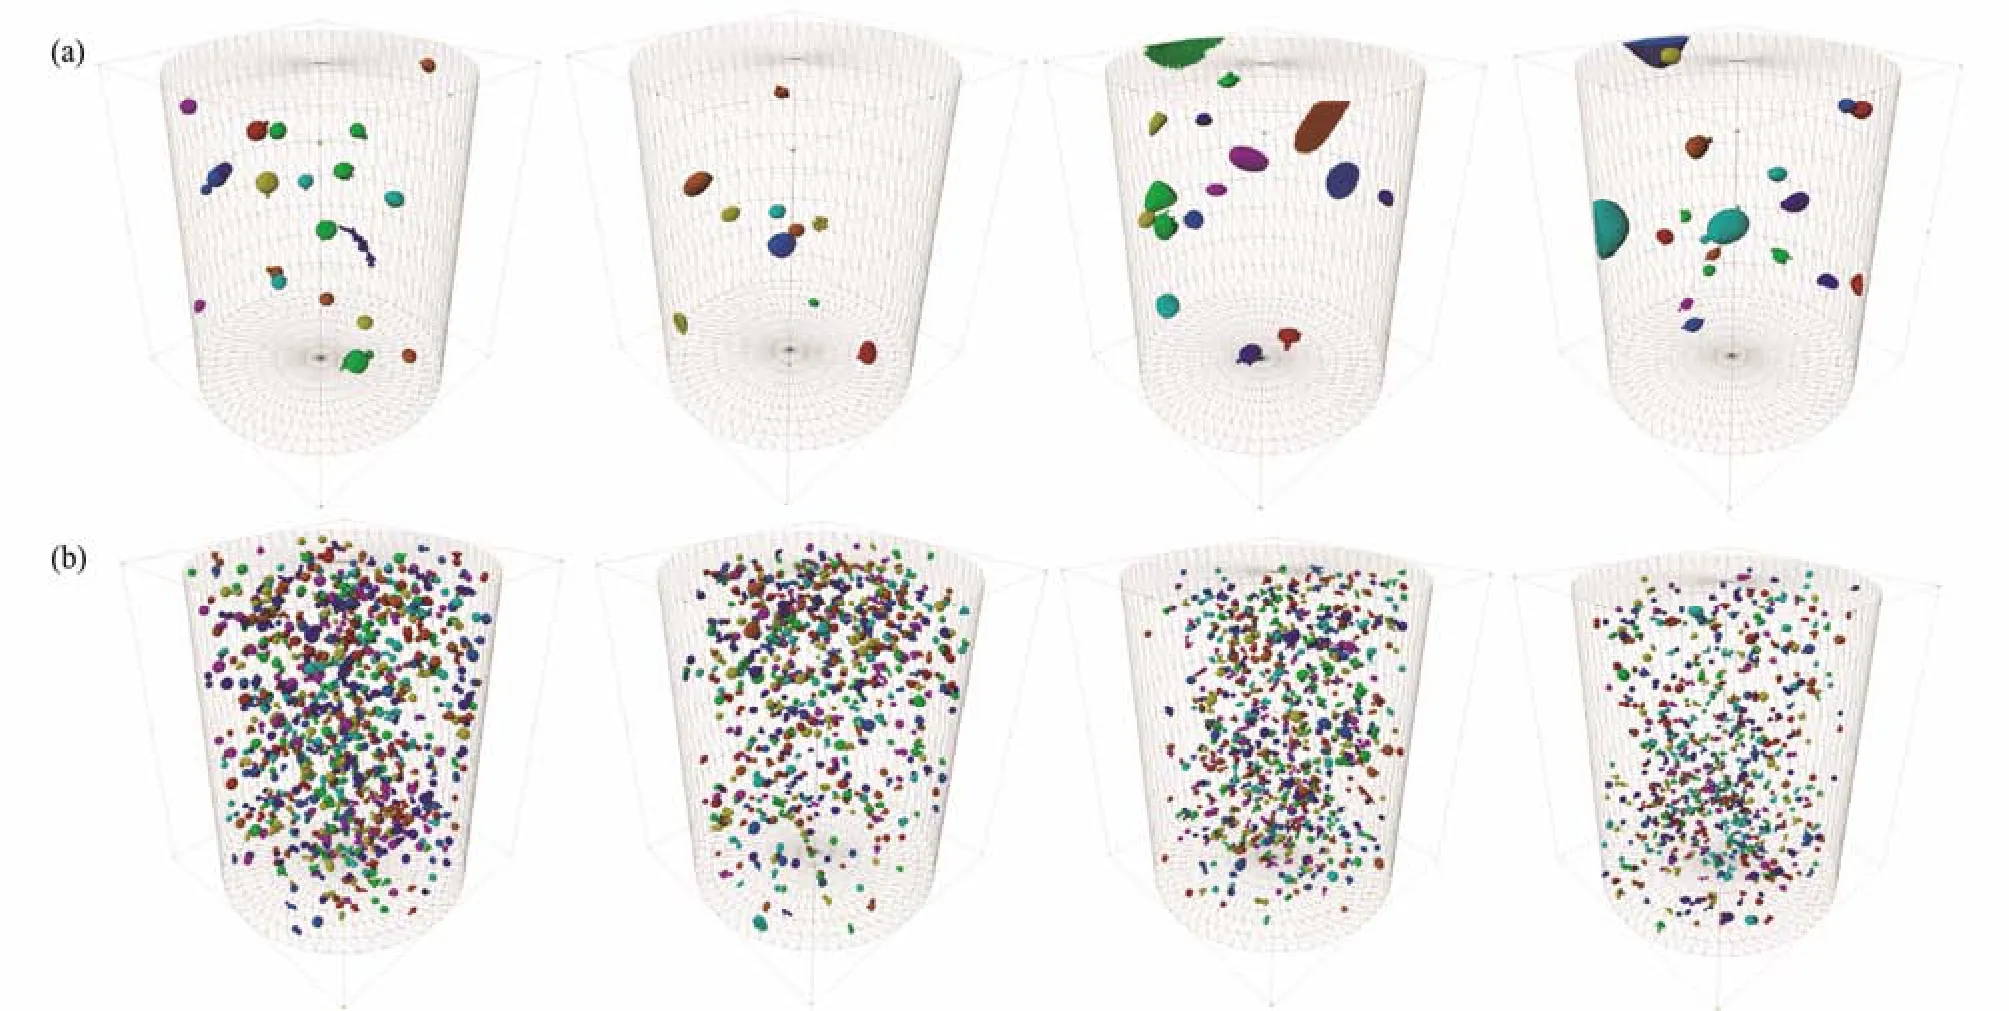
Fig.9 Same as Fig.8, but for S20.
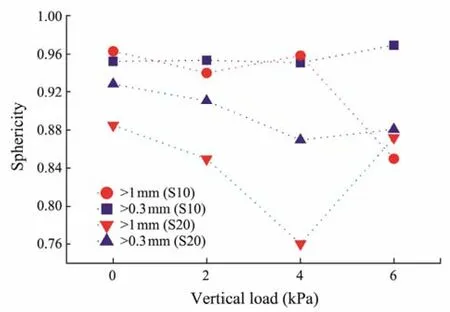
Fig.10 Sphericity variation of large bubbles.
3.3 Inspection of Unified Fractal Model for Porous Media
According to Yu (2001), a unified model describing the fractal characteristics of porous media is proposed as follow:
wheredis the Euclidean dimension and equals to 3 in this study, is volume fraction (i.e., volume porosity),λminandλmaxare minimum and maximum pore diameters, respectively. The ratioλmin/λmaxis the equivalent pore diameter.According to Eq. (1), the volume fraction and fractal dimension of the gassy soil are calculated, and the theoretical value ofλmin/λmaxis obtained, which is compared with the measured value of all bubbles extracted in Label Analysis.
As shown in Fig.11, according to the measured volume fraction and fractal dimension, the values ofλmin/λmaxcalculated by Eq. (1) change little and are stable at about 0.006. However, the actual measured values ofλmin/λmaxare generally higher than the theoretical values, and there is no obvious law with the change of volume fractions. With the increase of the load, the gap between the two values is narrowing, and the difference reaches the minimum at 6 kPa. According to Figs.8 and 9, with the increase of the load, the probability of larger bubbles increases, resulting in the decrease of the measured value ofλmin/λmax. For the equivalent pore diameters obtained by Label Analysis, the minimum values of all samples are basically the same,stable at about 0.037, which is related to the equivalent method of pore size (Liuet al., 2020a).
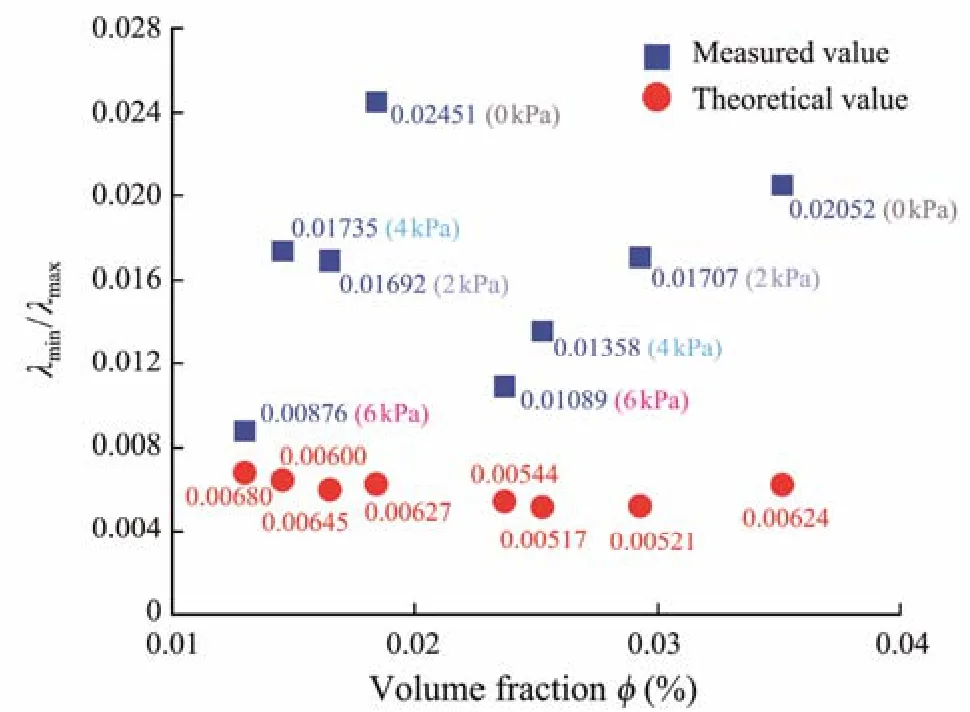
Fig.11 Comparison between the measured values and the theoretical values of λmin / λmax. Note that, values illustrated in the coordinates are all for the parameter λmin / λmax.
3.4 Relationship Between the Area Distribution and the Fractal Dimension of Bubbles
The fractal capillary bundle model of porous media proposed by Yu and Cheng (2002b) conforms to the following rules: the cumulative number of pores with diameter greater than a certain scale obeys the fractal scaling relationship in Eq. (2). Eq. (3) can be obtained by replacing the pore sizeλwith the bubble areaAobtained in Label Analysis.Nrepresents the cumulative numbers under different independent variables.
According to Eq. (3), the obtained overall bubble area distribution is plotted in a double logarithmic coordinate system (Fig.12). There are obvious self-similar scaling intervals in the overall pore area distribution for S10 and S20 groups. The minimum value of the self-similar interval is basically fixed at about 0.06, while the maximum value of the interval increases roughly with the volume fraction of bubbles.

Fig.12 Double logarithmic curves of the bubble area distribution. (a), S10; (b), S20.
Then the maximum value of the obtained interval is set asAmaxand the minimum value is set asAmin, which are substituted into Eq. (3) to replaceλminandλmax, respectively.The results are shown in Fig.13. The ratio ofAmin/Amaxgradually approaches the theoretical value with the increase of volume fraction, but the relationship with the variation of load is not obvious. Therefore, in the range of small loads,the area distribution of bubbles in gassy soil changes regularly with the volume fraction.

Fig.13 Comparison between measured values and theoretical values of Amin / Amax. Note that, values illustrated in the coordinates are all for the parameter Amin / Amax.
4 Conclusions
In this paper, the microstructure within gassy soil samples with different gas contents is observed by using an X-ray CT scanner at different vertical stress levels. X-ray CT images are processed and used to extract gas bubble related microstructure parameters based on the fractal theory. Main conclusions are drawn as follows:
Bubble volume fractions in gassy soil samples decreases nonlinearly with increasing vertical load stress when zeolite powder contents in the samples are the same. Both the three-dimensional fractal dimension and the average of all the two-dimensional fractal dimensions decrease with increasing vertical load stress. In addition, value of the threedimensional fractal dimension for each sample is about unit larger than the average of all the two-dimensional fractal dimension values.
Sphericity of gas bubbles with large sizes generally decreases with increasing vertical loading stress. This indicates that the gas bubble will become more ellipsoidal due to vertical loading. When the gas content is small, the sphericity tends to change little during vertical loading.
Measured values of the equivalent pore diameterλmin/λmaxin gassy soil sample are generally larger than the theoretical values, and the difference between measured and theoretical values becomes small when the vertical loading stress increases. Self-similar scaling intervals are obvious in the gas bubble area distribution, and the upper limit of the scaling intervals is positively correlated with the volume fraction. The measured value of the bubble area ratioAmin/Amaxgradually approaches the theoretical value when the volume fraction of gas bubbles increases.
Acknowledgements
The study is supported by the Open Research Fund Program of State Key Laboratory of Hydroscience and Engineering (No. sk lhse-2022-D-03), the National Natural Science Foundation of China (Nos. U2006213, 42277139),and the Taishan Scholars Program (No. tsqn202306297).
 Journal of Ocean University of China2024年1期
- Journal of Ocean University of China的其它文章
- Using Natural Radionuclides to Trace Sources of Suspended Particles in the Lower Reaches of the Yellow River
- Eutrophication of Jiangsu Coastal Water and Its Role in the Formation of Green Tide
- Evaluation of the Shallow Gas Hydrate Production Based on the Radial Drilling-Heat Injection-Back Fill Method
- Morphological and Sulfur-Isotopic Characteristics of Pyrites in the Deep Sediments from Xisha Trough, South China Sea
- Deformation Characteristics of Hydrate-Bearing Sediments
- Genetic Analysis of Structural Styles in the Makran Accretionary Wedge – Insight from Physical Simulations
