Study on concentration distribution and detonation characteristics for non-axisymmetric fuel dispersal
Linghui Zeng , Zhongqi Wng ,*, Xing Chen , Jinping Li
a State Key Laboratory of Explosion Science and Technology, Beijing Institute of Technology, Beijing,100081, China
b College of Environment and Chemical Engineering, Sichuan University of Science & Engineering, Zigong, 643000, China
Keywords: Fuel dispersal Concentration distribution Detonation characteristic Fuel loss Numerical simulation
ABSTRACT The study of non-axisymmetric fuel dispersal and detonation can provide reference for the prevention of industrial cloud explosion accidents and the design of fuel air explosive (FAE).The concentration and detonation fields of 85 kg cylindrical and fan-shaped fuel are investigated by experiments and numerical simulations.A dynamic model of the whole process for fuel dispersal and detonation is built.The concentration distribution of fuel is used as the initial condition to calculate the detonation stage, thus solving the initial value problem of detonation field.The phase and component changes of fuel cloud at different locations are compared.The fuel cloud is divided into directions of 0°, 90°,135° and 180°.The results show that the maximum cloud radius is 20.94 m in 135° and the minimum is 12.04 m in 0°.The diameter of the detonation fireball is 53.6 m, and the peak temperature is 3455 K.The highest peak overpressure is 3.44 MPa in 0° and the lowest is 2.97 MPa in 135°.The proportion of liquid phase in 0° is 22.90%,and the fuel loss is 11.8%and 9%higher than that in 135° and cylindrical charge,respectively.The stable propagation distance of blast wave in 135° is 42.50% longer than 0° and 28.37% longer than cylindrical charge.
1.Introduction
Fuel dispersal is a process in which fuel disperses and forms a mixed fuel-air cloud driven by the explosion from central charge.It involves the shell rupture of the dispersal device, fuel crushing,stripping and other complex phenomena [1].With the secondary initiation,the fuel-air mixture is detonated and has a large amount of energy output.Fuel dispersal and detonation has wide application background.In the fire protection field,a large number of inert fire extinguishing agents can be quickly dispersed over the fire source by explosive dispersal, so as to achieve rapid fire extinguishing and explosion suppression[2].In the industrial field,food processing, textile fiber, petrochemical and other industries are easy to produce large volume of combustible clouds in the production process [3].More than 40% of these accidents are cloud explosions [4].It is important to study the concentration distribution and detonation characteristics of fuel cloud to prevent explosion accidents.In the military field,fuel air explosive(FAE)is widely used in aviation bombs,rockets,missiles and other weapons[5].
For the model of fuel dispersal process and concentration distribution,Roy et al.[6]concluded that the early fuel dispersal model is mainly one-dimensional and near-field model,which belongs to the jet model dominated by explosive drive.In recent years, the research on fuel dispersal has formed the far-field turbulence model dominated by aerodynamic drag.Li et al.[7] studied the mechanism of liquid dynamic dispersion process.It is revealed that the tensile and shear forces generated by the interaction of reflected dilute waves play a decisive role in the dispersion flow of liquid.Ye et al.[8] obtained the concentration distribution of gasliquid two-phase fuel under unconstrained conditions through numerical simulation, and demonstrated the dynamic instantaneous isothermal field of the whole fuel region in the dispersal process.Chen et al.[9] proposed the smooth discrete particle hydrodynamic method (SDPH) to describe the development of fuel spraying.There are also specific models to describe the shell rupture[10],dispersing ability of central charge[11],mechanism of fuel droplet crushing and stripping [12] in the process of fuel dispersal.
For the experimental study of fuel cloud detonation, Han et al.[13] studied the propagation process of detonation wave with kerosene as fuel.The results show that the mass concentration of kerosene is the main factor affecting the velocity of detonation wave.Huang et al.[14] investigated the effect of concentration gradient on the explosion characteristics of methane-air mixtures.It shows that different concentration gradients will cause instability of turbulent flame.Wang et al.[15]added high-energy metal powder to the fuel, which significantly increased the peak temperature, overpressure and duration of detonation.For the numerical simulation of fuel cloud detonation, Liu et al.[16] built a numerical model for the critical initiation of binary hybrid fuel.The detonation processes of typical clouds such as JP-10,PO and EE are compared.Bai et al.[17] built a multi-source fuel cloud explosion model to simulate the propagation and interaction process of shock wave generated by 340 kg fuel cloud explosion.The results show that the number of blast sources has significant influence on the overpressure.Song et al.[18] numerically studied the explosion characteristics of gas-liquid two-phase n-heptane and analyzed the effects of concentration and initial temperature on the explosion development.
The cylindrical charge structure is the most commonly used fuel dispersal device, so the concentration distribution in the existing studies is mostly simplified to uniform and axisymmetric.However,in practice, the fuel cloud is not completely uniform and axisymmetric.In order to adapt to the more complex practical application environment, the fan-shaped charge structure different from the traditional circular section came into being.Due to the non-circular cross section,the shock wave of the central charge reaches the shell wall in different directions at different times, and the fuel cloud is non-axisymmetrical.Garon et al.[19] compared the aerodynamic differences of several types of non-circular cross section charge.Han et al.[20]performed asymmetric initiation of fuel clouds.The results show that the overpressure distribution in the cloud field is obviously non-uniform,and the superposition effect of shock wave exists in some regions.
To sum up, the existing studies have conducted modeling or experimental studies on each stage of fuel dispersal and detonation.However, the formation of cloud concentration field and detonation field is the result of the interaction of various stages.The existing research lacks a complete description of the whole process of fuel dispersal and detonation, and its concentration field is mostly simplified as premixed uniform distribution, which is different from the actual concentration field.At present,it is rare to discuss the dispersion process of non-axisymmetric structure.The fuel concentration distribution in each direction is not the same,and the directional difference of the detonation power field needs to be re-identified.
In view of the above background, this paper studies the explosive dispersal and detonation characteristics of cylindrical and fanshaped charge by experiments and numerical simulation.The whole process dynamic model of fuel dispersal and detonation is built.The cloud shape and concentration distribution are calculated and used as the initial condition to calculate the detonation stage,thus solving the initial value problem of detonation field.The detonation overpressure, temperature and component changes in different directions are analyzed.It provides reference for charge design, concentration prediction, detonation power optimization and safety protection of fire and explosion accidents in different engineering backgrounds.
2.Experiment
2.1.Experimental materials
The fuel dispersed in the experiment is liquid propylene oxide(PO) with a total mass of 85 kg.The central charge is TNT with a mass of 0.9 kg.The shell is made of aluminum with a thickness of 0.3 mm.The material parameters are shown in Table 1.
2.2.Experimental setup
Fig.1 shows the fuel dispersal device,which is mainly composed of fuel, dispersal charge, shell and fuze.The charge cover and the central pipe are connected by thread, and the other parts are connected by welding.Fig.1(a) shows a cylindrical charge with a diameter of 370 mm and a height of 1150 mm.The dispersal explosive is located in the center of the fuel with a diameter of 20 mm.Fig.1(b) shows a fan-shaped charge with a maximum radius of 600 mm.Since the fan-shaped charge is nonaxisymmetric, the charge structure is divided into five directions of 0°, 90°, 135°, 180°and 270°by counterclockwise rotation.The erection height of the structure is 1.0 m.The distance between the secondary ignition device and the dispersal center is 1.5 m,and the height above the ground is 2.5 m.After 220 ms of fuel dispersal,the shape of the cloud is basically stable and the secondary ignition device is activated.The experimental device is shown in Fig.2.
There are 4 sets of high-speed camera systems.The model is HG-100 K with a shooting speed of 2000 fps.The systems are erected 100 m from the explosion source.The directions are 0°, 90°,135°and 180°,respectively.Thirty-two Kilster-ICP piezoelectric pressure sensors are used in the experiment, and 8 of them are set in each direction.The pressure sensor is fixed on a steel plate with a diameter of 0.3 m.The steel plate surface is parallel to the ground.The data lines are arranged in four main directions.The distance between the sensor and the charge center is 5 m,8 m,10 m,15 m,20 m,30 m,40 m and 50 m,respectively.By measuring the voltage signal,the overpressure can be calculated for a given sensitivity and magnification.The layout of the experimental test system is shown in Fig.3.The experiment is repeated three times under the same conditions.The relative humidity of the air is 90%.The initial temperature of the fuel is 299 K.The wind speed is less than 5 m/s.
3.Numerical simulation
3.1.Governing equation
The basic process of fuel explosive dispersal and cloud detonation can be divided into three parts:explosive dispersal stage,cloud development stage and cloud detonation stage.The first two stages are solved by programming.The fuel concentration distribution isloaded into ANSYS FLUENT as the initial condition for detonation stage calculation.

Table 1The material parameters.

Fig.1.Fuel dispersal device: (a) Cylindrical charge; (b) Fan-shaped charge.
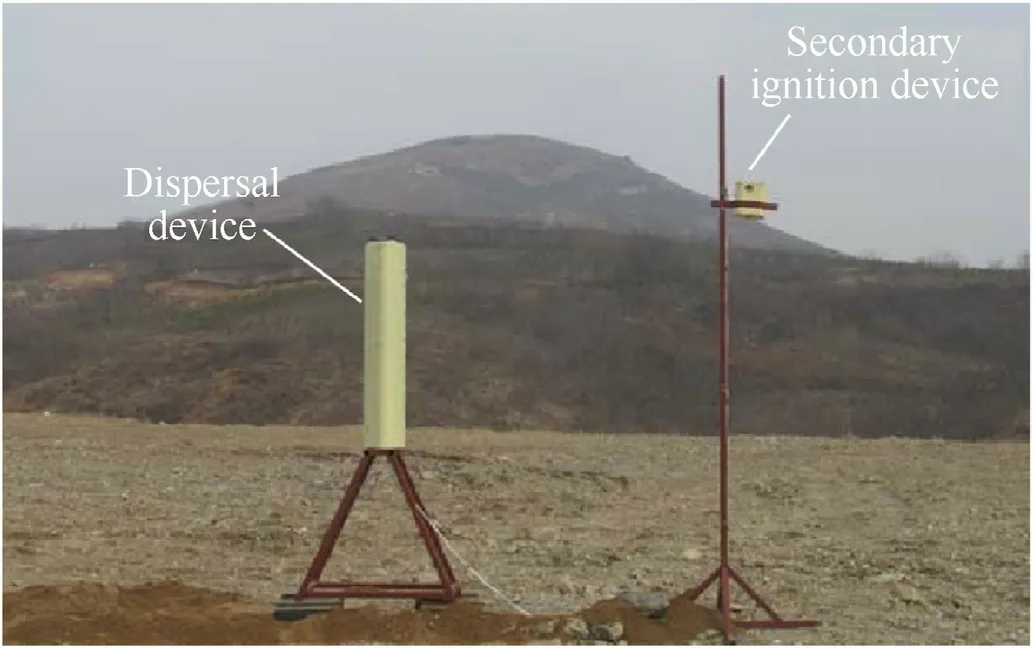
Fig.2.Experimental device for fuel dispersal and detonation.
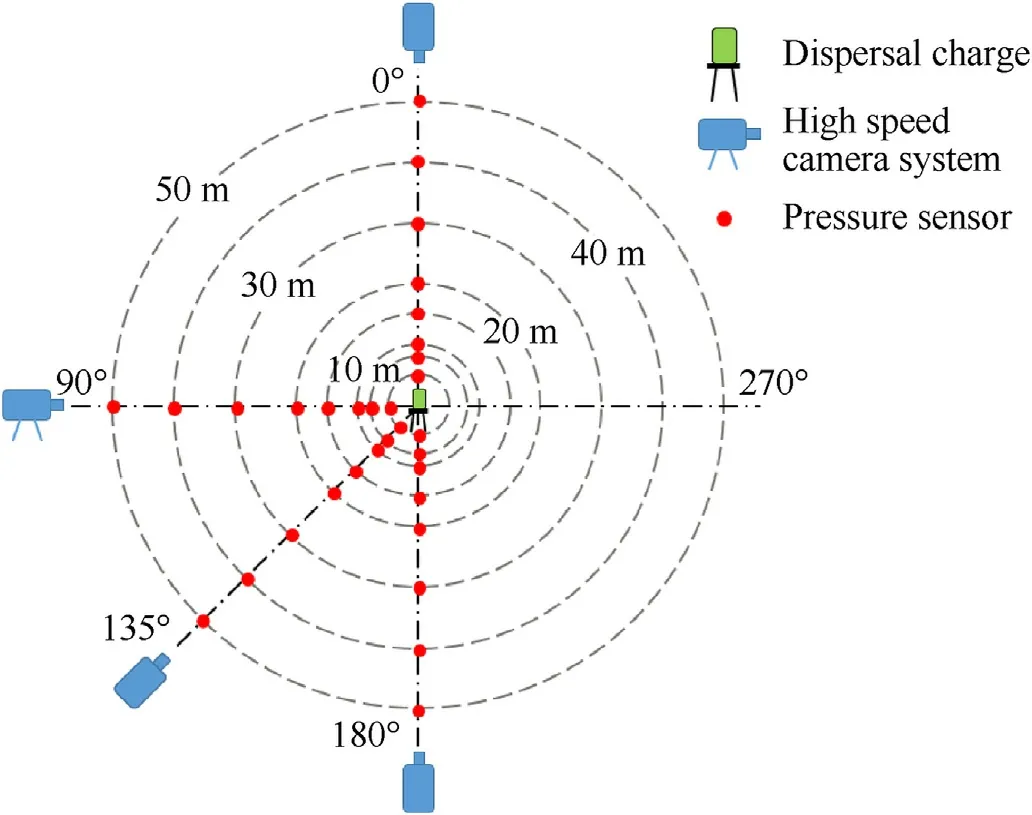
Fig.3.Experimental test system.
3.1.1.Explosivedispersalstage
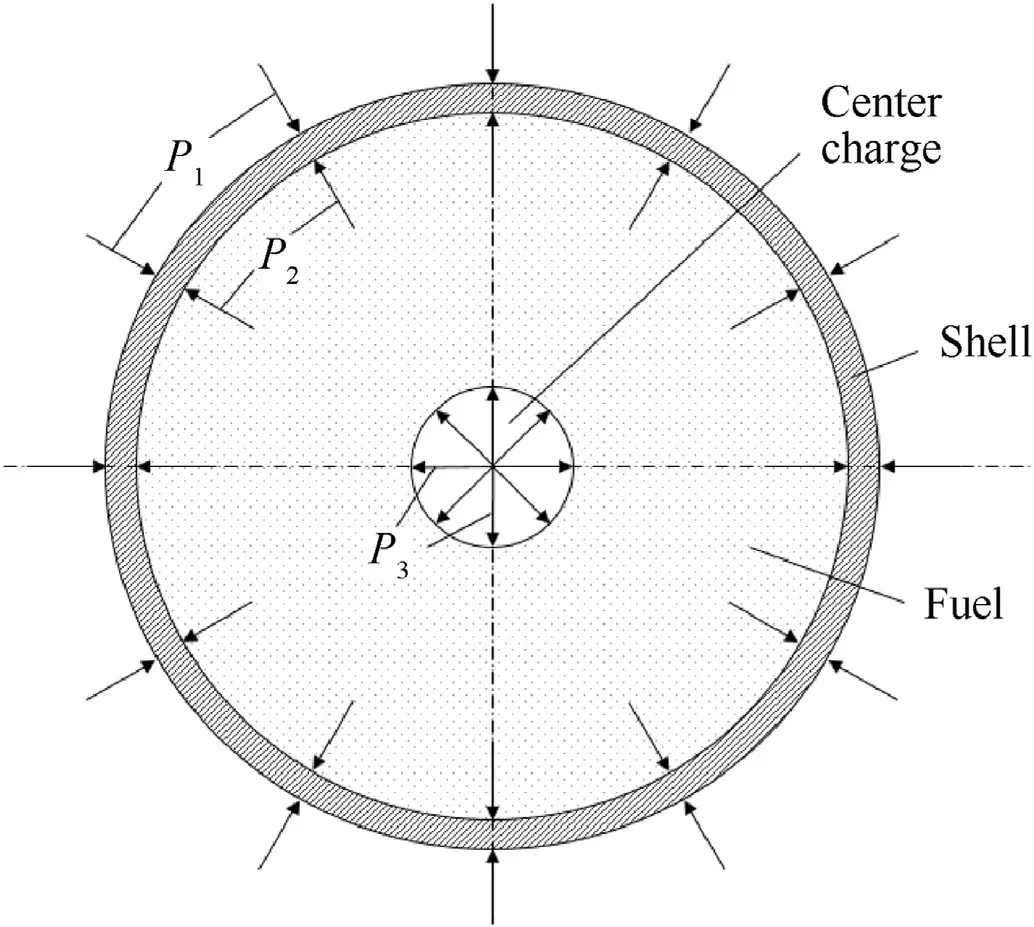
Fig.4.Force condition of shell and fuel ring.
The movement of the fuel mainly depends on the explosive force of the central charge.Fig.4 is the sectional view of the explosive dispersal device,showing the stress of the shell and fuel ring.The air pressure on the outer surface of the shell isP1.The fuel transfer pressure on the inner surface isP2.The pressure caused by the central detonation product isP3.
(1) Instantaneous detonation model
When the polytropic exponentkis 3, the state equation of the instantaneous detonation pressurePmis as follows [21]:
here,ρ0is the initial explosive density.c is the sound velocity.D is the detonation velocity.
(2) Detonation product expansion model
here,p0andv0are the pressure and specific volume of detonation products.The polytropic exponent γ is 3, and a0is the inner wall radius of the central tube before expansion.
(3) Shell rupture model
The particle velocity on the inner wall of the shell varies with time as follows [22]:
here,bis the inner radius of shell.ubanducare particle motion velocities of inner and outer walls of the shell, respectively.
(4) Fuel ring rupture model
The initial rate at which the fuel expands and breaks to form droplets is as follows [23]:
here,uaandubare the movement velocities of the inner and outer walls, respectively.
3.1.2.Clouddevelopmentstage
The fuel block formed by the initial crushing moves in the air,and the secondary crushing occurs under the action of air resistance.The particles are mainly affected by pneumatic stripping and fuel evaporation.
(1) Fuel stripping model
The stripping effect is mainly caused by the friction between the fuel block and the air.The stripping rate is as follows [24]:
here,lis the average radius of droplet.ρ andare the densities of air and fuel,respectively.μ and μLare the viscosity coefficient of air and fuel, respectively.
(2) Fuel evaporation model
Evaporation from the droplet surface is assumed to be uniform.The evaporation rate is as follows [25]:
here,TandTLare the temperatures of air and fuel droplets,respectively.Nuis Nusselt number.Lis vaporization heat.
(3) Particle motion model
The equation of motion for a single particle in Lagrangian coordinates is as follows [26,27]:
here,Fdis particle motion resistance.Fmis additional mass force.Fpis pressure gradient force.FBis Basset force.FMis Magnus force.FSis Saffman force.
(4) Concentration distribution system
As shown in Fig.5, Cartesian rectangular grid is used to discretize the droplets in cuboid V and obtain the coordinates of each droplet after discretization.The total mass of the droplet at each time is as follows:
here,mqis the particle mass in the small rectangle △vat timet.The grid concentration can be regarded as the concentration at the point (xi,yj,zk).
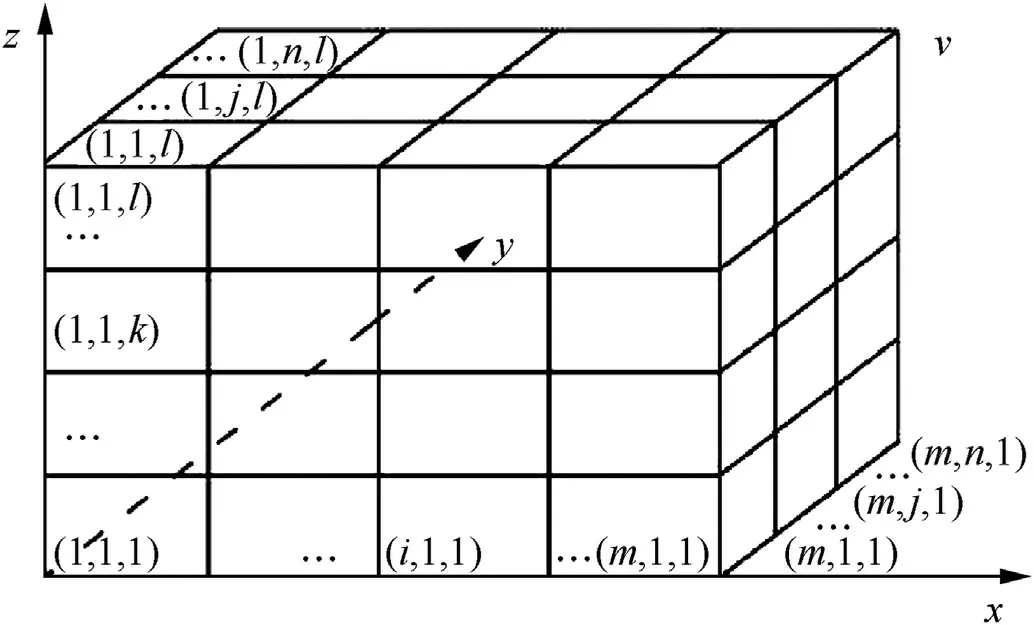
Fig.5.Three-dimensional matrix concentration distribution.
3.1.3.Clouddetonationstage
The chemical component transfer model, k-ε turbulence model and DO thermal radiation model are introduced to solve the detonation process of propylene oxide cloud.
(1) Chemical component transfer model [28].
here,Yiis the local mass fraction of each species,Riis the net rate of production by chemical reaction, andSiis the rate of creation by addition from the dispersed phase.
(2) Standard k-ε model [29].
The turbulence kinetic energy (k) and its rate of dissipation (ε)are given by
here,Gkrepresents the generation of turbulence kinetic energy due to the mean velocity gradients, andGbis the generation of turbulence kinetic energy due to buoyancy.The constant values:C1ε= 1.44, C2ε= 1.92,σk=1.0, and σε= 1.3.
(3) DO thermal radiation model [29].
DO thermal radiation model is used to solve the thermal radiation conduction process of different phase Φ at different positions.
here,σ is Stefan-Boltzmann constant(5.669×10⁻⁸W/m2-K4).is position vector.is direction vector.Ω' is solid angle.
3.2.Parameters and boundary condition
Assuming that the air in the calculation consists of 21% oxygen and 79% nitrogen (by volume), the chemical reaction of Propylene Oxide/Air mixture with stoichiometric volume fraction is as follows:
The detonation parameters of PO in oxygen-rich reaction are listed in Table 2.
In order to calculate the detonation field parameters, a cylindrical air domain with a diameter of 100 m and a height of 10 m is built.The concentration field formed by dispersal is taken as the initial condition for detonation, as shown in Fig.6.The lowerboundary of the air domain is the ground,which is set as a non-slip rigid wall surface.The other boundaries are flow-out boundaries.Eight monitoring points are set in 0°,90°,135°and 180°directions,and the distance from the charge center is 5 m, 8 m,10 m,15 m,20 m, 30 m, 40 m and 50 m, respectively.

Table 2Detonation parameters of PO [30].
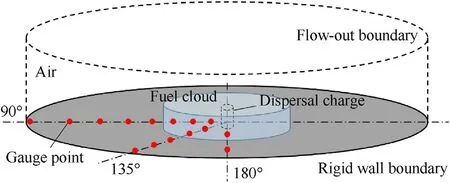
Fig.6.Geometric model of fuel concentration field.
3.3.Verification and grid independence
In order to verify the reliability of the numerical model and calculation method,the experiment of 85 kg cylindrical charge fuel dispersal and detonation is carried out.The cloud shape and detonation parameters are compared between experimental and numerical results.The grid independence is also verified.Fig.7 shows the cloud development of cylindrical fuel dispersal, and the cloud shape is compared with the numerical simulation.
The main part of the cloud is regarded as cylindrical.The radius,height, concentration and velocity of the cloud are compared between the experimental group and simulation group.Fig.8(a)shows the cloud radius at different times.At 75 ms, the experimental cloud radius is 12.92 m, and the simulated cloud radius is 13.85 m.The relative error is 7.20%.Fig.8(b) shows the average cloud height at different times.After 75 ms,the cloud height error is stable within 5%.Fig.8(c)shows the average cloud concentration at different times.The error is less than 0.005 kg/m3.Fig.8(d)compares the cloud diffusion velocity between 2-16 ms.The maximum error is -6.93% at 2 ms.
The fuel cloud stabilized after 200 ms of dispersal.At 220 ms,the fuel cloud is detonated.Fig.9 shows the detonation process of cylindrical fuel cloud.0 ms is the time point for the secondary detonation.The cloud detonation overpressure in the same concentration field is calculated by numerical simulation.The calculations are repeated using 400 mm, 200 mm and 100 mm mesh,respectively.The mesh numbers are 0.6 million,4.9 million and 39 million, respectively.
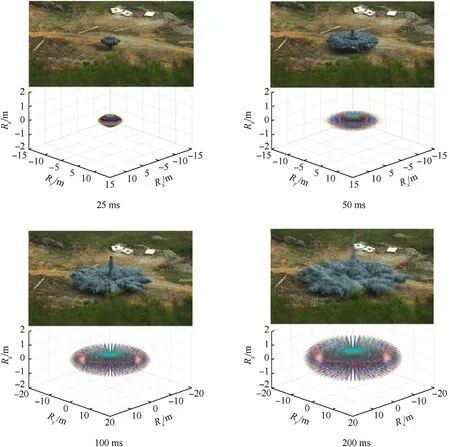
Fig.7.Cloud development of cylindrical fuel dispersal.
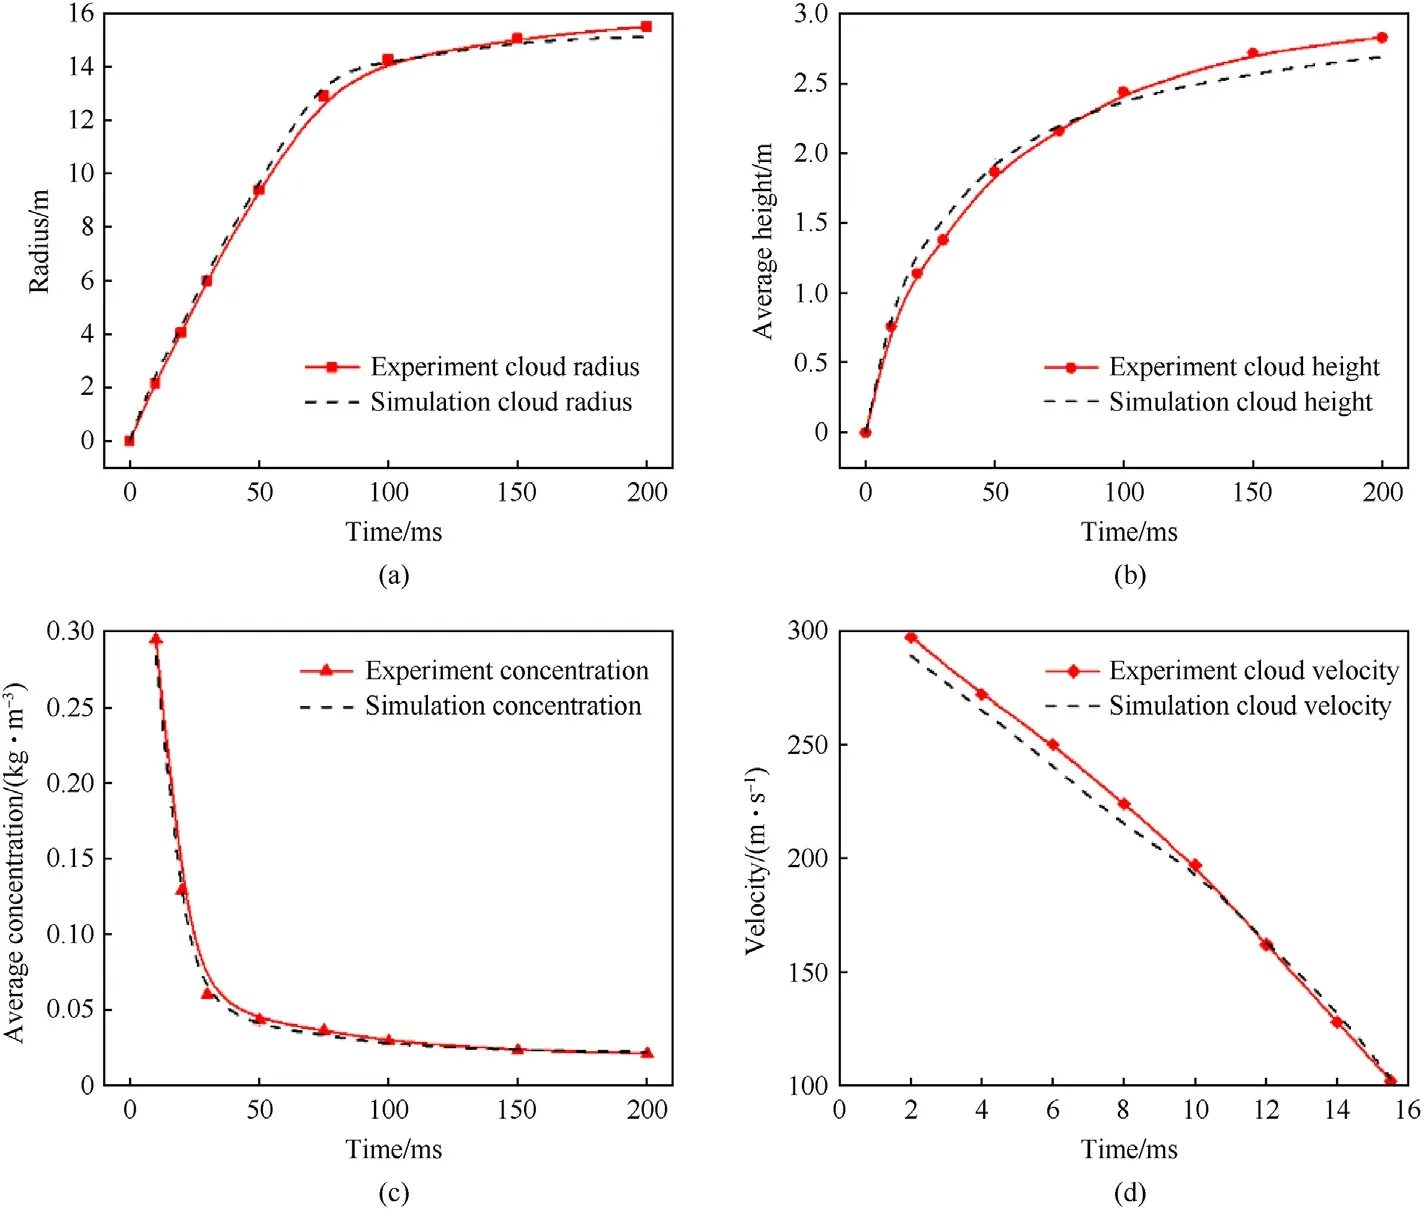
Fig.8.Comparison of cloud parameters between experimental group and simulation group: (a) Cloud radius; (b) Cloud height; (c) Cloud concentration; (d) Cloud velocity.
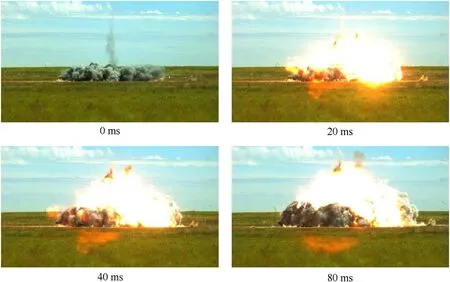
Fig.9.Detonation process of cylindrical fuel cloud.
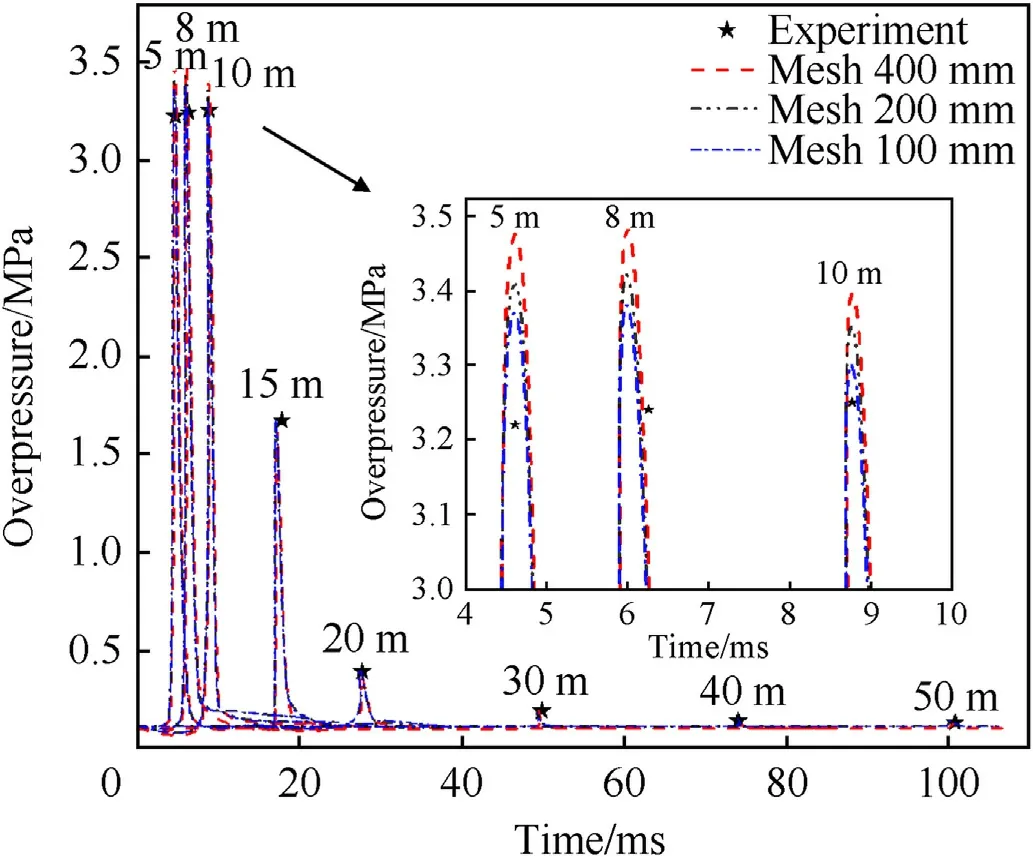
Fig.10.Comparison of overpressure and grid independence verification.
Fig.10 shows the comparison of experimental and simulated overpressure.The overpressure with different mesh sizes has the same downward trend as the experimental results.Beyond 15 m,the peak overpressure of each group is basically the same,and the error is less than 5%.The difference of different mesh is mainly reflected in the cloud area.The maximum error of 400 mm mesh is at 5 m, and the peak overpressure is 3.48 MPa, which is 8.07%different from the experimental value of 3.22 MPa.The maximum error of 200 mm mesh is 5.77%.The maximum error of 100 mm mesh is 4.67%.When the mesh is reduced to 200 mm, the peak overpressure has obvious convergence.Therefore, considering the calculation accuracy and efficiency,100 mm mesh is adopted in the cloud area.The mesh is expanded outward according to 1.15 expansion ratio outside the cloud area, and the maximum size of the distal end is 400 mm.In summary, the numerical model and mesh size meet the accuracy requirements of the calculation, and the error is within the acceptable range.
4.Results and discussion
4.1.Fan-shaped fuel dispersal
After dispersal of 85 kg fan-shaped fuel,the cloud is four-prism and trapezoidal in cross section.Fig.11 shows the top view of the cloud at 200 ms.The narrow sidel1is 15.3 m.The wide sidel2is 29.2 m.The distance between the two sides is 27.1 m.The simulated shape is consistent with the experimental shape.The dispersal radii of fuel in different directions are obviously different.It is axisymmetric with the 0°and 180°directions as the axis.

Fig.11.Top view of fan-shaped charge cloud at 200 ms: (a) simulated shape; (b) experimental shape.

Fig.12.Top view of fan-shaped charge cloud development process.
Fig.12 shows the development of 85 kg fan-shaped fuel cloud.The shape of the cloud gradually develops from the initial fanshape with broad upper and narrow lower to trapezoid with narrow upper and broad lower.The cloud gradually becomes stable after 200 ms.The radius, velocity and concentration of cloud are analyzed by taking 0°, 90°, 135°and 180°as four characteristic directions.
Fig.13 shows the curve of cloud radius and cloud velocity of fanshaped fuel in different directions with time.Cloud diffusion shows three stages.The first stage is the first 30 ms of fuel dispersal.There is little difference of cloud radius in each direction.The fuel diffuses outward according to the initial fan-shaped charge structure.At this stage, the maximum cloud radius is 5.72 m in 0°, while the minimum is 3.41 m in 180°.After initiation, the initial velocity of fuel in 0°is the maximum,which is 290 m/s.The initial velocity of 90°and 180°is relatively small, which are 128 m/s and 116 m/s,respectively.This is because the distance between the central charge and each wall of the fan shell is different.The time of the shock wave reaching each wall and the time of shell rupture are different.The second stage is the transition stage of 30-50 ms.The cloud velocity decreases significantly in 0°and 135°.The cloud velocities in all directions are relatively close.The cloud radius increases synchronously and evenly.The cloud is circular in cross section.The third stage is after 50 ms.The cloud radius of 135°increases faster than other directions.The fuel boundary of 135°clearly protrudes outward.At 143 ms, the radius of 180°starts to exceed the radius of 0°.After 200 ms, the cloud is basically stable,and the cloud speed in all directions tends to zero.Finally, the maximum cloud radius is 20.94 m in 135°.The radii of 90°and 180°are 14.94 m and 13.99 m,respectively.The minimum cloud radius is 12.04 m in 0°.The initial velocity of 180°is less than 0°,but the final cloud radius is larger.This is due to the fact that fan-shaped structure has more fuel distributed in 0°, and its droplets are subjected to more resistance at higher initial velocities.However,the fuel in 180°has less mass.The particle fragmentation is more uniform.The particle size is smaller,and its flight distance is longer.
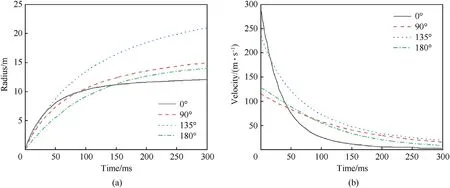
Fig.13.Characteristic curves of fan-shaped charge cloud: (a) Cloud radius; (b) Cloud velocity.
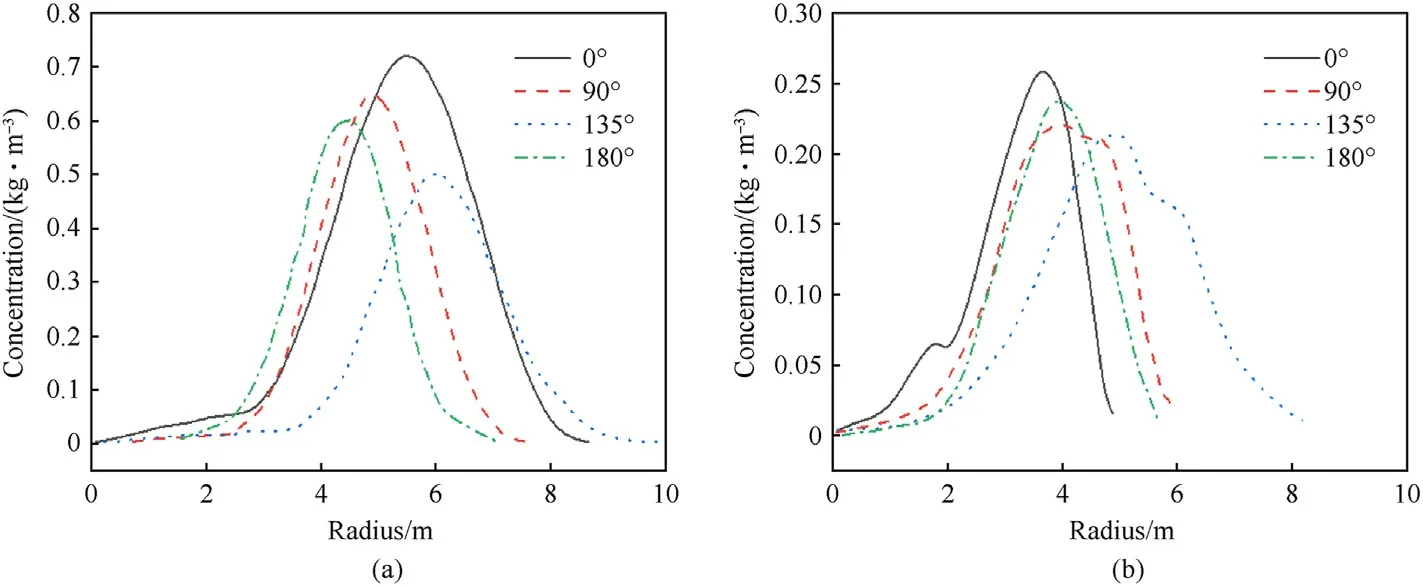
Fig.14.Concentration curves of fan-shaped fuel: (a) Early stage (50 ms); (b) Late stage (200 ms).

Fig.15.Contours of fan-shaped fuel cloud concentration.

Fig.16.Detonation process of fan-shaped fuel cloud at view from 90°: (a) Temperature contours; (b) Pressure contours; (c) Experiment.
Fig.14 shows the concentration curves of fan-shaped fuel cloud at different positions.Fig.15 shows the contours of fuel concentration distribution in 0°and 180°.At 50 ms after fuel dispersal, the cloud radius in all directions is still small.The cross section of the cloud is transformed from trapezoidal to circular.The concentration distribution is concentrated.Most of them are within 4-7 m from the center.The concentration curve shows a unimodal trend,and the highest peak concentration is 0.72 kg/m3in 0°.The lowest peak concentration is 0.50 kg/m3in 135°.After 200 ms,the difference of cloud concentration in each direction is obvious.In 0°,the peak concentration of 0.26 kg/m3is the highest.It is due to the large distribution of fuel mass and the short dispersal radius.The concentration is concentrated in the range of 6-10 m.In 180°,the cloud is concentrated in the range of 7-13 m, and the peak concentration is 0.24 kg/m3.The cloud is widely distributed in 90°,and the peak concentration is 0.22 kg/m3.It is kept in high concentration within the range of 8-12 m.The lowest peak concentration is 0.20 kg/m3in 135°.However,it is the most widely distributed,and there is a certain concentration distribution between 6-20 m.The results show that the fuel particles with a smaller initial velocity have a better cloud uniformity, a larger distribution range and a higher effective fuel utilization rate.
4.2.Fan-shaped fuel detonation
Secondary detonation is performed at 220 ms after fuel dispersal.Fig.16(a) shows the temperature fields in 0°and 180°obtained by numerical simulation.The diameter of high temperature region is 53.6 m,which is consistent with experimental fireball diameter of 56.2 m.Fig.16(b) shows the shock wave propagation process obtained by numerical simulation.At 10 ms, the shock wave propagation distances obtained by numerical simulation and experiment are 11.5 m and 15.2 m,respectively.At 20 ms,they are 22.0 m and 23.7 m, respectively.At 50 ms, they are 30.8 m and 30.5 m,respectively.Fig.16(c)shows the detonation process of fuel cloud recorded by the high-speed camera system at the view of 90°.In the experiment,the wavefront track is colorless,but the location of the wavefront can be judged according to the difference of the refractive index of the air.The air in the wavefront is compressed and differs from the surrounding medium.So the refractive index is different.A white dashed line is added to the actual position of the shockwave track in Fig.16(c).
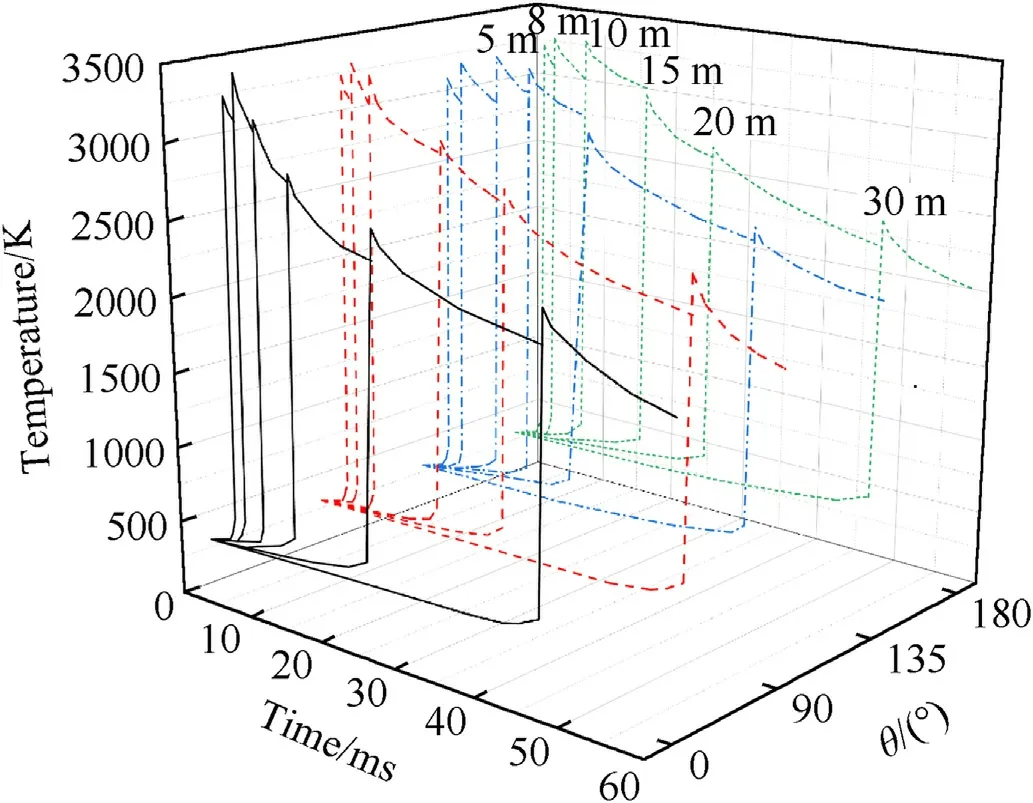
Fig.17.Temperature time history curves at different positions.
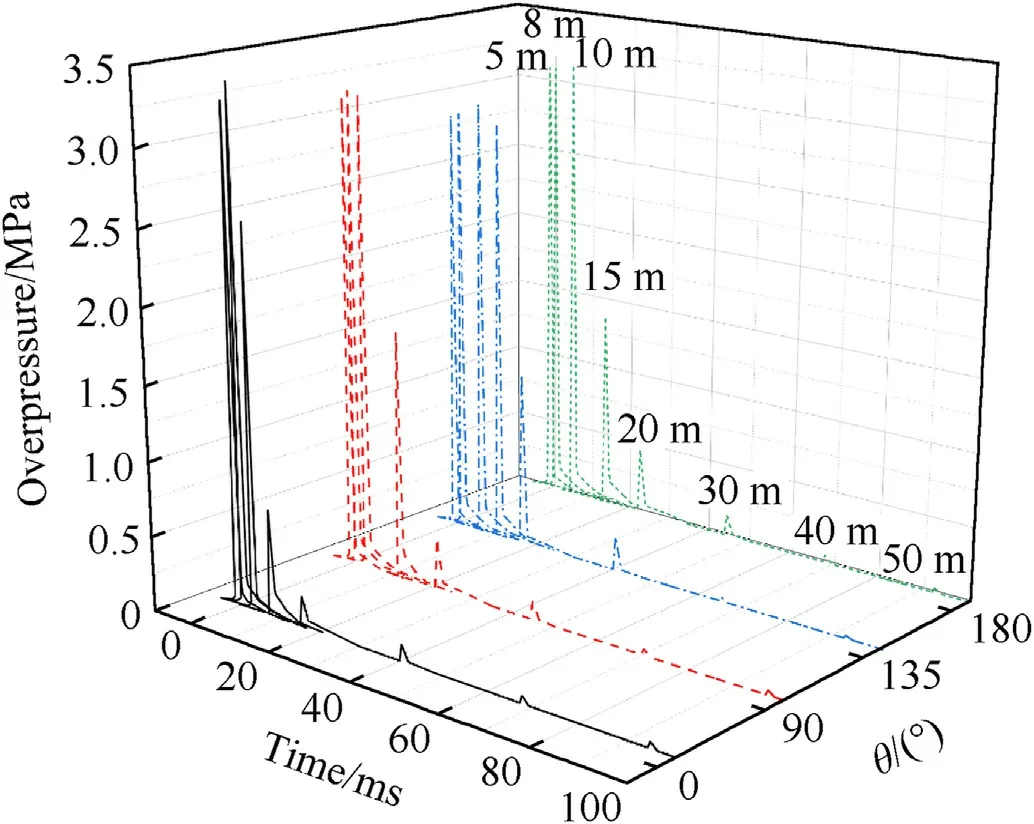
Fig.18.Pressure time history curves at different positions.
Fig.17 shows the curve of temperature variation with time at each monitoring point.The detonation temperature in the cloud area is very high, and the peak temperature within 10 m range is above 3100 K.The temperature in 0°is the highest, and it reaches 3455 K at 5 m.The temperature in 135°is slightly lower, and it is between 3100 and 3300 K.At 15 m position, the temperature decreases significantly in all directions, but the peak temperature in 135°is still 3280 K.The radius of detonation fireball in all directions is between 26 m and 28 m.Fig.18 shows the curve of pressure variation with time at each monitoring point.The peak overpressure is maintained at 3.05-3.44 MPa in all directions within 10 m.At 15 m,the peak overpressure in 135°is the highest,which can still reach 2.93 MPa.The values of 90°and 180°are 1.75 MPa and 1.44 MPa, respectively.The peak overpressure in 0°is the lowest, which is 0.8 MPa.At 20-50 m, the overpressure decays continuously.It drops to 0.13 MPa in all directions at 50 m.
4.3.Comparison of fan-shaped and cylindrical fuel
The peak overpressure of cylindrical and fan-shaped charge in different directions are summarized in Fig.19.The peak overpressure of fan-shaped charge in 0°is the highest,and it can reach 3.44 MPa at 8 m.The peak overpressure of 90°,180°and cylindrical charge is the next, which is 3.24 MPa, 3.18 MPa and 3.25 MPa,respectively.The peak overpressure of 2.97 MPa in 135°is the lowest, which is 15.82% lower than the value in 0°.The peak overpressure of cylindrical charge and fan-shaped charge in 90°is very close.The reason is that the fuel distribution in 90°is closer to cylindrical charge.The peak overpressure of fan-shaped charge in 135°can still reach 2.93 MPa at 15 m, while the values of other directions are lower than 1.0 MPa.
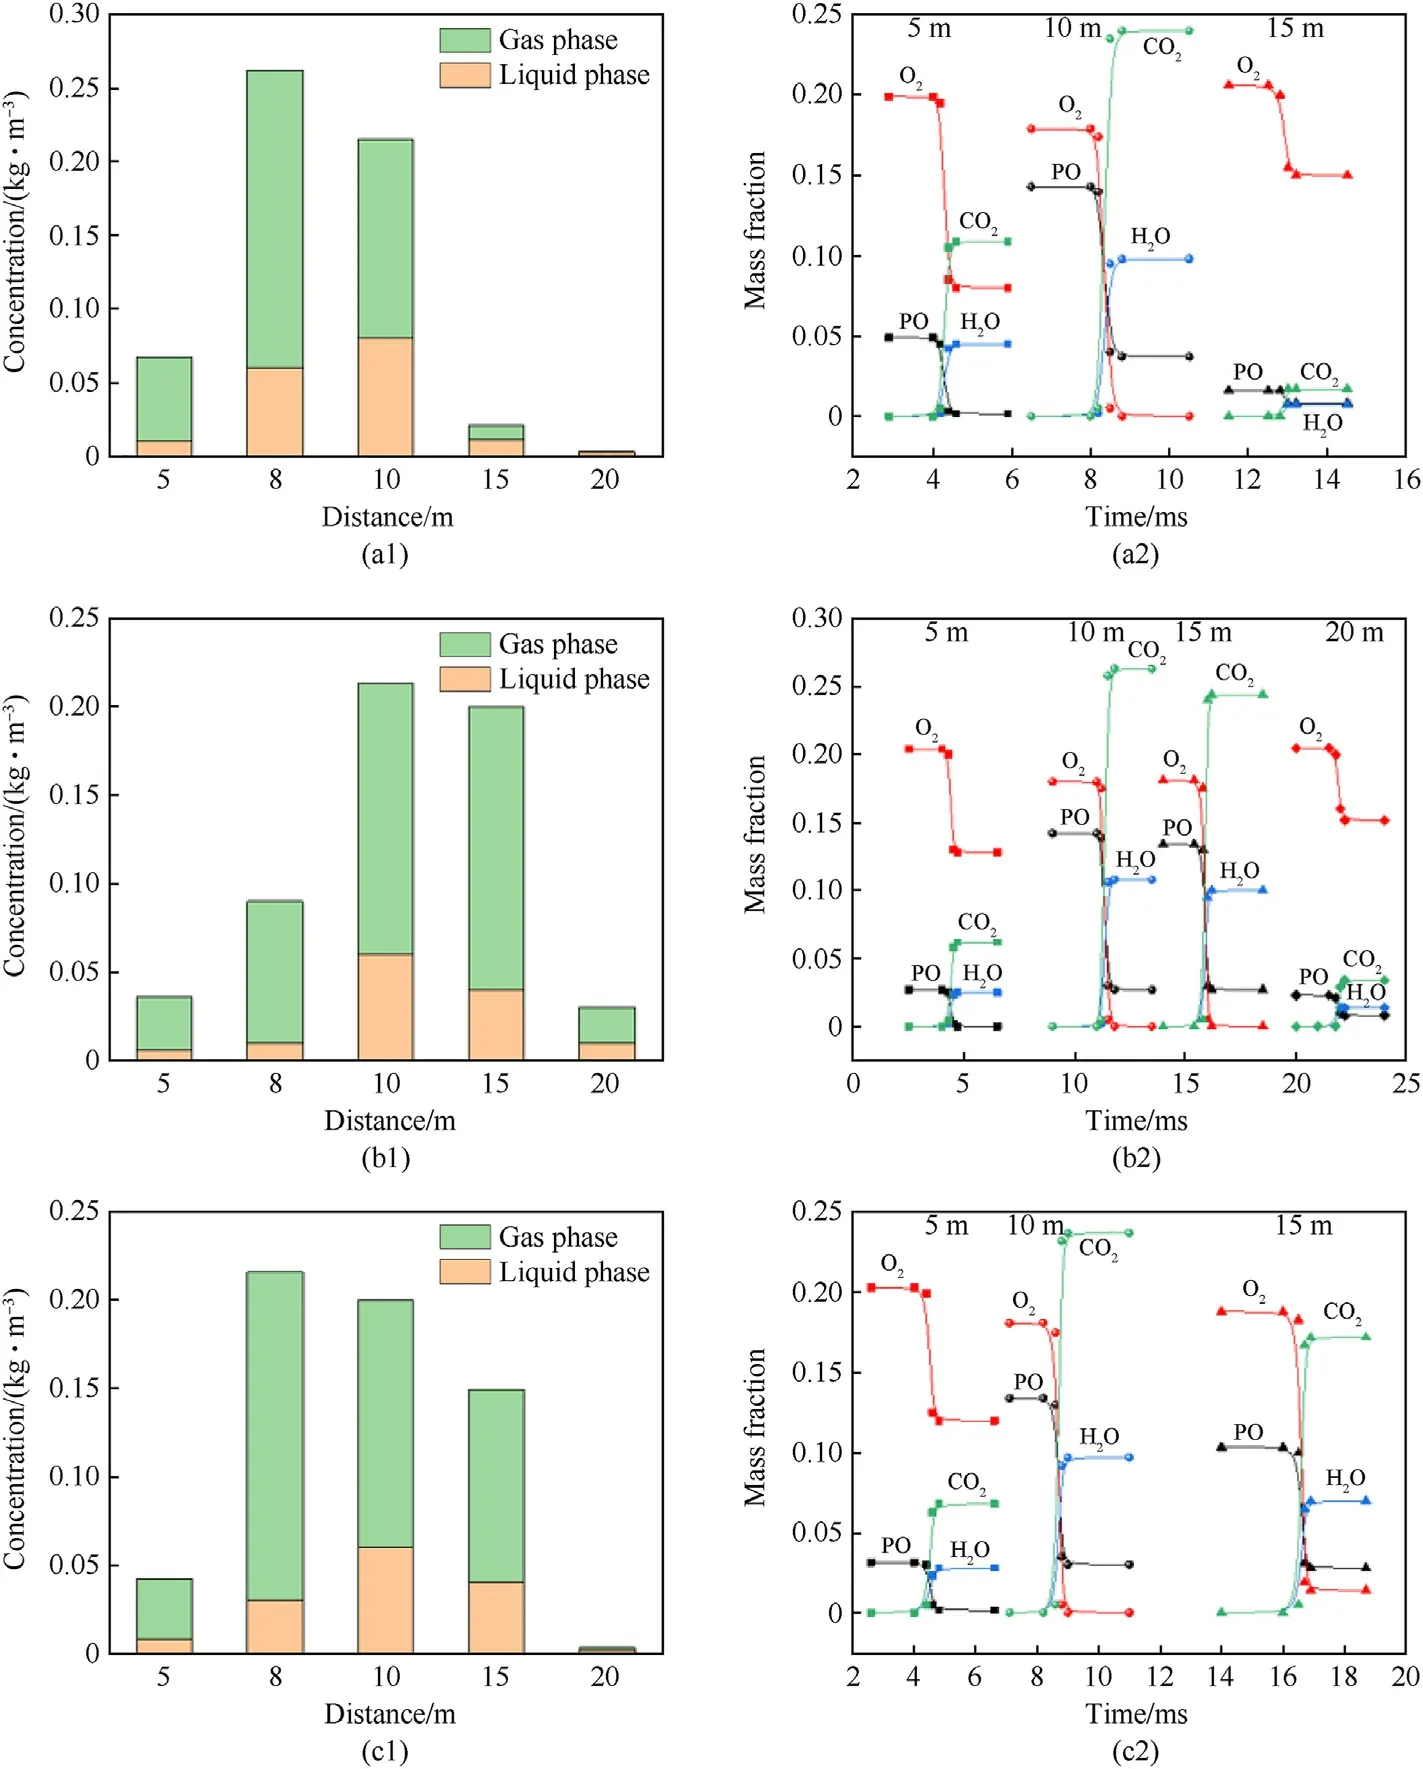
Fig.20.Phase distribution and component reaction of fan-shaped and cylindrical charge:(a1)Phase distribution of 0° fan-shaped charge;(a2)Component change of 0° fan-shaped charge;(b1)Phase distribution of 135° fan-shaped charge;(b2)Component change of 135° fan-shaped charge;(c1)Phase distribution of cylindrical charge;(c2)Component change of cylindrical charge.
The peak overpressure in 0°and 135°of the fan-shaped charge is significantly different.Therefore, component reactions of fanshaped 0°, 135°and cylindrical charge are selected for comparison,as shown in Fig.20.At 5 m,the proportion of liquid phase in all directions is close, between 15%-17%.At 10 m, the proportion of liquid phase in 0°is 37.16%.The value is 28.09%in 135°and 29.96%for cylindrical charge.At 15 m, the proportion of liquid phase in 0°is as high as 52.38%.The value of 135°and cylindrical charge is 20.15% and 16.83%, respectively.The gas phase fuel is more in contact with the air than the condensed phase fuel.Therefore,the burnout rate of the liquid fuel in the cloud is low in the process of detonation.The reaction in all directions is oxygen-rich at 5 m.The gas phase in the fuel cloud accounts for more than 80%.The fuel concentration will directly determine its detonation parameters.Therefore,at 5 m,the concentration in 0°of fan-shaped fuel is the highest, and the peak overpressure is also the highest.Cylindrical charge is the next.The 135°fan-shaped fuel has the lowest concentration and the lowest peak overpressure.At 10 m,the reaction in all directions is oxygen-poor, and the peak overpressure is similar.Although the concentration in 0°is higher than 135°, the proportion of liquid phase in 0°is relatively high.Therefore,for the 0°direction, more fuel is wasted, and the fuel actually involved in the detonation reaction is similar to the fuel of 135°and cylindrical charge.
5.Conclusions
The concentration and detonation fields of 85 kg cylindrical and fan-shaped fuel are investigated by experiments and numerical simulations.It provides reference for the prevention of industrial cloud explosion accidents and the design of FAE weapons.
(1) The whole process dynamic model of fuel dispersal, concentration distribution and cloud detonation is built.The error of fuel dispersal radius is less than 7.20%.
(2) The maximum cloud radius is 20.94 m in 135°.The minimum cloud radius is 12.04 m in 0°, which is 73.92% lower than 135°.After secondary initiation, the peak overpressure in 0°is the highest, which is 3.44 MPa.The lowest peak overpressure of 2.97 MPa is in 135°, which is 15.82% lower than 0°.
(3) The proportion of liquid phase in 0°fan-shaped fuel is 22.90%.The fuel loss rate reaches 25.87%, which is higher than the 135°fan-shaped charge and the cylindrical charge by 11.8%and 9%,respectively.The concentration in 0°is 57%higher than 135°, but the peak overpressure is only 15.82%higher.The stable propagation distance of fan-shaped 135°is 42.50% and 28.37% longer than fan-shaped 0°and the cylindrical charge, respectively.
Declaration of competing interest
The authors declare that they have no known competing financial interests or personal relationships that could have appeared to influence the work reported in this paper.
Acknowledgement
The research presented in this paper was supported by the National Key Research and Development Program of China (Grant No.2021YFC3001204).
- Defence Technology的其它文章
- The interaction between a shaped charge jet and a single moving plate
- Machine learning for predicting the outcome of terminal ballistics events
- Fabrication and characterization of multi-scale coated boron powders with improved combustion performance: A brief review
- Experimental research on the launching system of auxiliary charge with filter cartridge structure
- Dependence of impact regime boundaries on the initial temperatures of projectiles and targets
- Experimental and numerical study of hypervelocity impact damage on composite overwrapped pressure vessels

