
Allergen degradation of bee pollen by lactic acid bacteria fermentation and its alleviatory effects on allergic reactions in BALB/c mice
2024-02-16 07:14:42ShutingYinQingqingLiYuxioToEnningZhouKunWngWnwenChenXingxinLiLimingWu
食品科学与人类健康(英文) 2024年1期
Shuting Yin,Qingqing Li,*,Yuxio To,Enning Zhou,Kun Wng,Wnwen Chen,Xingxin Li,Liming Wu,*
a Institute of Apicultural Research,Chinese Academy of Agricultural Sciences,Beijing 100093,China
b Department of Animal Science,McGill University,Quebec H9X 3V9,Canada
c State Key Laboratory of Food Science and Technology,School of Food Science and Technology,Jiangnan University,Wuxi 214122,China
Keywords:Alleviatory effects Lactic acid bacteria fermentation Bee pollen allergen Gut microbiota Host metabolism
ABSTRACT Food allergy as a global health problem threatens food industry.Bee pollen (BP) is a typical food with allergenic potentials,although it performs various nutritional/pharmacological functions to humans.In this study,lactic acid bacteria (LAB) were used to ferment Brassica napus BP for alleviating its allergenicity.Four novel allergens (glutaredoxin,oleosin-B2,catalase and lipase) were identified with significant decreases in LAB-fermented BP (FBP) than natural BP by proteomics.Meanwhile,metabolomics analysis showed significant increases of 28 characteristic oligopeptides and amino acids in FBP versus BP,indicating the degradation of LAB on allergens.Moreover,FBP showed alleviatory effects in BALB/c mice,which relieved pathological symptoms and lowered production of allergic mediators.Microbial high-throughput sequencing analysis showed that FBP could regulate gut microbiota and metabolism to strengthen immunity,which were closely correlated with the alleviation of allergic reactivity.These findings could contribute to the development and utilization of hypoallergenic BP products.
1. Introduction
Food allergy has become a global concern to food safety that threatens human health.A diverse of foods such as milk,egg,seafoods,nuts,etc.,have been proved with potential allergenicity to susceptible populations[1].Bee pollen (BP),as a plant-derived food collected by honeybees,has been utilized as a natural dietary supplement,but can induce allergic reactions after human consumption,though it is abundant in more than 200 kinds of nutrients and bioactive ingredients[2].Previous researches believed that the occurrence of allergy was attributed to the introduce of some allergenic anemophilous pollen (e.g.,Asteraceaepollen)during BP collection,or it might occur cross-reactivity between BP and other sensitized foods after ingestion[3].And moreover,some plant-derived allergens in monofloral BP,such as polcalcin,glutaredoxin,and oleosin-B2 fromBrassicanapuspollen,also play significant roles in the allergic reaction[4,5].However,allergen identification of monof loral BP is still insufficient,limiting the safety control and further development and utilization of BP.
Reducing the food antigenicity and meanwhile preventing the loss of other nutrients by food processing is a great challenge to food industry.Fermentation,as a non-thermal processing technology,could keep processing foods from nutrients loss,and have great potential to alleviate food allergenicity by hydrolyzing allergenic proteins or changing their allergenic epitopes[6].Our previous study proved that fermentation by yeast is conducive to improving the nutritional properties of BP and reducing the allergenicity by degrading its allergenic proteins into small molecule peptides and free amino acids[5,7].Additionally,lactic acid bacteria (LAB) as a kind of probiotics have been widely applied in the production of hypoallergenic foods.As reported,the IgE-binding capacity of soy protein was reduced significantly and the main soy allergen-β-conglycinin was degraded into small molecular peptides byLactobacillus plantarumfermentation.In addition,the secondary and tertiary structures were changed significantly in fermented soy protein,which indicated that the linear and conformational epitopes of allergens were destroyed,thereby reducing the allergenicity of soy protein after fermentation[8].Another study by Lu et al.[9]also proved thatLactobacillus brevisfermentation destroyed 5 IgE-binding epitopes of soy protein and degraded soy allergens into small molecular peptides,as well as reduced the mast cells degranulation and histamine (HIS) release to alleviate allergic reactionin vivo.Fu et al.[10]isolated 12 strains of LAB from traditional sour dough,and found that the LAB strains could produce proteolytic enzymes and exert high proteolytic activity on wheat protein substrate to reduce wheat allergenicity.Therefore,LAB-involved fermentation is an efficient way to produce hypoallergenic foods.
Furthermore,LAB as a kind of probiotics exert protective effects on regulating intestinal flora.Intestinal flora is a complex ecological community composed of various microorganisms,which is necessary for the host immune system.Previous studies have demonstrated that an imbalance in the composition and structure of intestinal microbial community could lead to host immune disorders and diseases[11].Probiotics such as LAB can regulate the balance of intestinal flora and strengthen the host immunity.For instance,the intake ofLactobacillusacidophilus KLDS 1.0738 could inhibit the sensitization ofβ-lactoglobulin in mice significantly by improving the intestinal microbiota structure and diversity,as well as upregulating the production of short-chain fatty acids and their receptors[12].A clinical trial proved that the presence ofLactobacillales,Bifidobacteriales,andBacteroidalesin the gut microbiota was beneficial for alleviating allergic reactions[13].Prospectively,active LAB can reduce the food allergenicity by fermentation,and moreover can participate in regulating intestinal flora,enhancing human immunity,and exerting anti-allergic activity.
In this study,we purposed to clarify the desensitization mechanism of LAB-involved fermentation inB.napusBP,by identifying the changes of BP allergens and its degradation products through proteomics and metabolomics analysis;and furthermore,to explore protective effects of LAB-fermented BP (FBP) on intestinal microbiota composition and structure in correlation with the alleviation of allergic reactivity based on a sensitized mice model.
2. Materials and methods
2.1 Reagents
HPLC-grade methanol,acetonitrile,and formic acid were purchased from Fisher Scientific Inc.(USA).Imject™ Alum Adjuvant(No.77161) was obtained from Thermo Fisher Inc.(USA).Human native IgE antibody,anti-human IgE mouse monoclonal antibody labeled with HRP,goat anti-mouse IgE antibody,and donkey antigoat IgG conjugated with HRP antibody were acquired from Abcam Inc.(UK).Millipore Milli-Q system was used for collecting ultrapure water (Millipore Inc.,USA).Other chemical reagents were obtained from Sigma-Aldrich Inc.(USA) except for modified sequencing-grade trypsin (Promega Inc.,USA).
2.2 Sample preparation
The BP samples were obtained from the beekeeping base of Institute of Apicultural Research,Chinese Academy of Agricultural Sciences (IAR,CAAS).Lyophilize and ground the sample into powder,and sterilize it through irradiation ion (IS,7 kGy).Prepare the FBP samples based on our previously published method[7].Briefly,5 g of sterilized BP powder was added to 10 mL of Millipore water,vortexed for 10 min,and then mixed with 150 mg dry activeLactobacillus bulgaricusandStreptococcus thermophilus(dosage ratio of two strains=1:1) (Angel Yeast Co.,Ltd.,China).Incubate the mixture at 40 °C for 48 h.After fermentation,samples were lyophilized and ground into powder,and then stored at −80 °C before analysis.
2.3 Scanning electron microscopy (SEM) examination on B.napus pollens
Prior to SEM analysis,5 mg of natural or FBP powder was suspended in 1 mL glutaraldehyde solution (4%),and then 20 μL was drawn and spreaded on tinfoil evenly.The tinfoil with pollen grains attached were freeze-dried before fixing on metal stubs and coating with a thin layer of gold.Palynological morphology imaging were performed by a Hitachi S-750 SEM system (Hitachi Company,Japan).
2.4 BP protein pretreatment
A total of 100 mg of lyophilized natural or FBP powder was used for protein collection.The procedures of protein extraction,enzymatic hydrolysis,and desalination refer to the methods we previously reported[5].The concentration of collected peptide solution was assayed by Nanodrop2000 detector,and normalized to 0.25 μg/μL before proteomics analysis.
2.5 Proteomics-based BP allergen identification
The Easy-nLC1000-LTQ-Orbitrap Elite mass spectrometer equipped with ESI detector (Thermo Fisher Scientific,USA) was used for peptide sample analysis.The trap column (with Aqua C18beads;100 μm × 2 cm,5 μm) and analysis column (with 100 Å,Aqua C18beads;75 μm × 15 cm,3 μm) were both purchased from Thermo Fisher Scientific (USA) applied to separating samples.Mobile phases and gradient conditions,as well as the instrument acquisition parameters were set as described[5].
The Xcalibur software (version 2.2,Thermo Fisher Scientific)was used for raw data collection,and the Peaks DB 7.5 software(Bioinformatics Solutions Inc.,Waterloo,Canada) was applied to qualitative and quantitative analysis.The identification of protein sequences was based on the NCBI and Uniprot ‘Brassica’ protein databases.The parameters for database searching and matching were identical to those of our previous publication[5].The relative protein abundance was quantified using a label-free quantification (LFQ)method by Peaks Q module with the same quantitative parameters as reported in our previous publication[5].NCBI BLAST tools were used for the alignment of homologous protein sequences.DNAStar version 8.1.3 software (DNASTAR,Inc.,USA) was used for antigenic epitope analysis of the potential allergens.
2.6 Metabolomics-based BP oligopeptides and amino acids detection
A total of 100 mg of lyophilized natural or FBP powder was used for metabolites extraction according to our previous publication[5].The collected samples were separated by an Agilent 1290 Infinity II series UPLC system with an Agilent Eclipse Plus C18Rapid Resolution HD column (2.1 mm × 100 mm,1.8 μm).The Agilent 6545 ESI-Q-TOF system was used for MS acquisition.Mobile phases and gradient conditions,as well as the instrument acquisition parameters were identical to those of our previous study[5].Reference ions were set as described for mass accuracy calibration.Metabolite identification was conducted by the Agilent Mass Profiler Professional (MPP) software based on METLIN Database with a data screening threshold of database scores ≥ 80 and mass error ≤ 5 ppm (0.000 5%).
2.7 Animal experiments
The animal experiments were conducted in Beijing Animal Experimental Center.All animal experimental procedures were approved by the Animal Ethics Committee at IAR,CAAS (Beijing,China).Female BALB/c mice (6 weeks old,16−20 g) were supplied with controlled lighting (12 h light/dark cycle),filtered pathogen-free air,20−24 °C temperature,and 50% humidity.A standard AIN-93 laboratory diet (Xietong Organism Co.,Ltd.,China),and filtered pathogen-free water were provided to the mice.
For sample preparation,1 g of natural or FBP samples were added to 10 mL ultrapure water and ultrasonically treated for 45 min,followed by a centrifugation at 3 500 ×gfor 15 min.The supernatant was collected for ultrafiltration by a Millipore ultrafiltration tube(15 mL,10 kDa).The determination of protein concentration in the interception was conducted as described[5].Dilute the interception with a saline to reach the protein concentration of 0.5 and 2.5 mg/mL for base dose and excitation dose injections,respectively.Ovalbumin(OVA) was prepared to the protein concentration of 0.1 and 0.5 mg/mL for base dose and excitation dose injections,respectively.The OVA injection concentration was designated according to Boroujerdnia et al.[14]reported,and the injection concentration of BP and FBP were designated based on our preliminary experimental results which demonstrated that this combination of base and excitation doses can cause allergic reactions without causing mice poisoning and death.
After 1 week of acclimation,the mice were divided into 4 groups randomly (n=7 each).The control group was given with a standard diet and drinking water ad libitum;the OVA group was also given the standard diet and water,while injected intraperitoneally with 0.2 mL of 0.1 mg/mL OVA solution (containing 1% aluminum hydroxide adjuvant) every seven days for 21 days,and finally injected with 0.2 mL of 0.5 mg/mL OVA solution (containing 1% aluminum hydroxide adjuvant) on the 28thday;the BP group was also given the standard diet and water,while injected intraperitoneally with 0.2 mL of 0.5 mg/mL BP solution (containing 1% aluminum hydroxide adjuvant) every seven days for 21 days,and finally injected with 0.2 mL of 2.5 mg/mL BP solution (containing 1% aluminum hydroxide adjuvant) on the 28thday;the FBP group was also given the standard diet and water,while injected intraperitoneally with 0.2 mL of 0.5 mg/mL FBP solution (containing 1% aluminum hydroxide adjuvant) every seven days for 21 days,and finally injected with 0.2 mL of 2.5 mg/mL FBP solution (containing 1% aluminum hydroxide adjuvant) on the 28thday.The mice were observed for 30 min after the excitation dose injection,and then sacrificed for subsequent analysis.
2.8 Histopathology analysis
The spleen and thymus tissues were washed in PBS after culling and then fixed in 4% paraformaldehyde overnight for histopathology examination.The fixed tissues were embedded in paraffin.Some were stained with hematoxylin-eosin (HE),and some were stained with toluidine blue (TB) as described[15].The stained slides were visualized by an optical microscope (Nikon Eclipse Ci,Japan).
2.9 Immunoblot analysis
2.9.1 Determination of IgE-binding ability of BP protein
The procedures of BP protein extraction and the protein concentration detection were according to our previous study[5].A total of 50 μg of protein was loaded onto a nitrocellulose membrane(5 cm × 5 cm).The membrane incubation and immunoblot procedures were conducted as described[5].The primary antibody was human native IgE antibody diluted to 1:1 000 and the secondary antibody was anti-human IgE mouse monoclonal antibody labeled with HRP diluted to 1:1 500.The brown spots on the membrane were displayed by a DAB color developing kit.After drying,the developed membrane was imaged by an HP Color LaserJet Pro MFP M277dw scanner(USA).The protein binding capacity with human IgE was evaluated through the grayscale processing and determination of the relative quantification of dot intensity by Image J version 1.53 software.
2.9.2 Determination of serum IgE level in mice
The protein concentration of mice serum was detected using a BCA protein assay kit (Beyotime Biotechnology,China).The serum with 40 μg of protein was loaded onto a nitrocellulose membrane(5 cm × 5 cm).The subsequent procedure was identical to section 2.9.1,except that the primary antibody was goat anti-mouse IgE antibody at a dilution of 1:2 000 and the secondary antibody was donkey anti-goat IgG conjugated with HRP antibody at a dilution of 1:2 000.After developing,drying,and capturing the immunoblotted membrane,the relative quantification of mice serum IgE was evaluated through the grayscale processing of dot intensity by Image J version 1.53 software.
2.10 UPLC-QQQ-MS/MS-based bioamines detection in mice serum
For serum bioamines detection,50 μL mice serum was mixed with 200 μL methanol,followed by a centrifugation at 13 000 ×gfor 15 min kept at 4 °C.The collected supernatant was then filtered with a nylon filter (0.22 μm,Agilent),and prepared for UPLC-QQQ-MS/MS analysis.
The Agilent 1290 Infinity II series UPLC system equipped with an Agilent Zobax Eclipse C18column (2.1 mm × 50 mm,1.8 μm) was applied to separating samples.Mobile phase A was ultrapure water(containing 0.1% formic acid and 2 mmol/L ammonium formate),and mobile phase B was methanol.The gradient was set as follows: 1 min,2% B;4 min,15% B;4.5 min,98% B;6 min,98% B;6.1 min,2% B;post time,3 min.Flow rate,0.3 mL/min;column temperature,40 °C;injection volume,1 μL.
The Agilent 6470 ESI-QQQ system was used for MS acquisition.The MS parameters were set as follows: gas temperature,250 °C;drying gas flow rate,7 L/min;nebulizer pressure,30 psi;sheath gas temperature,325 °C;sheath gas flow rate,11 L/min.Seven kinds of bioamines including HIS,spermidine (SPD),spermine (SP),5-hydroxymethyltryptamine (5-HT),tryptamine (TRP),octopamine(OCT),β-phenylalanine (β-PHE) were acquired in positive ionization with a multiple reaction monitoring (MRM) mode according to the optimized percussor/product ions,fragmentation voltage,and collision energy conditions listed in Table 1.
2.11 Microbiota analysis
Microbial DNA from colonic digesta of mice was extracted by a commercial E.Z.N.A.®Soil DNA Kit (Omega Bio-Tek,USA).The determination of DNA concentration and purity was conducted by NanoDrop 2000 (Thermo Fisher Scientific Inc.,USA).The 1%agarose gel electrophoresis was used for DNA quality assay.The V3-V4 hypervariable region of 16S rRNA gene was amplified with the primer pairs 338F (5’-ACTCCTACGGGAGGCAGCAG-3’) and 806R(5’-GGACTACHVGGGTWTCTAAT-3’) by a thermocycler PCR system (ABI GeneAmp®9700,USA).The purification of amplified products was performed with an AxyPrep DNA Gel Extraction Kit(Axygen Inc.,USA),and then quantified by Quantus™ Fluorometer(Promega Inc.,USA).Amplicons were subjected to paired-end sequencing on an Illumina MiSeq System (Illumina Inc.,USA).The raw Illumina data was quality-filtered by a FASTQ (version 0.20.0) software,and then merged using FLASH (version 1.2.7)software.Sequences with over 97% similarity were clustered as the same amplicon sequence variants (ASVs) by DADA2 plugin in the Qiime2 (version 2020.2) software.The ASVs taxonomic assignment was conducted by Naive bayes consensus taxonomy classifier on a basis of SILVA 16S rRNA database (v 138).16S rRNA microbiome sequencing data analysis was performed by bioinformatic tools on the free online Majorbio i-Sanger cloud platform (http://en.majorbio.com).
2.12 Statistics
Variancet-test and ANOVA analysis were conducted at 95%probability level by SPSS 21.0 statistical software.Heat-map analysis was conducted by multi-experiment viewer (MEV).The alpha-and beta-diversity analysis,Kruskal-WallisH-test,and PICRUSt function prediction were performed by bioinformatic tools on the free online Majorbio i-Sanger cloud platform (http://en.majorbio.com).
3. Results and discussion
3.1 Allergen identification and epitope prediction of B.napus BP
In order to identify potential allergens inB.napusBP,label-free proteomics analysis was performed based on ‘Brassica’protein database from NCBI and Uniprot.Table 2 shows the assignment of peptide fragments of 4 allergenic proteins identified by proteomics.Allergen glutaredoxin (Accession No.: A0A0D3C059,molecular weight (mw)=11 754 Da) and oleosin-B2 (Accession No.: P29526,mw=18 149 Da) have been confirmed in our previous publication[5],while catalase (Accession No.: A0A078GY74,mw=56 676 Da)and lipase (Accession No.: A0A397ZHM4,mw=37 547 Da) are newly identified in this study.It shows that the identified peptide fragments of catalase account for 68% coverage of the total sequence and contain 10 unique peptides;the identified peptide fragments of lipase account for 29% coverage of the total sequence and contain two unique peptides.Catalase,as a kind of antioxidant enzyme,contains immune responsive domains at both N-and C-termini that carry immunoreactive amphipathic motifs and can be recognized by T cells[16].Catalase is a member of the allergen family.It is oneof the main allergens in bananas identified by mass spectrometry,and its recombinant protein shows IgE-mediated allergic reaction in banana allergic patients[17].Catalase also exists in mold and might induce skin allergy when exposed to allergic patients[18].We also found 86% similarity inB.napuscatalase compared withMacleaya cordataallergenic catalase sequence based on BLAST alignment(Fig.1A).Lipase has been found in various plants,animals,and microorganisms.Generally,there is a Gly-Asp-Ser (GDS) active site in lipase that can be considered as one of the characteristic features of the allergen family—lipase_GDSL[19].Here,we also found a GDS active site existing inB.napuslipase (Fig.1B).With reference to FAO/WHO allergen matching rules,we recognized catalase and lipase as the novel potential allergens inB.napusBP.

Fig.1 Alignment of homologous protein sequences performed by NCBI BLAST tools and antigenic epitopes prediction of catalase (A).The active center and antigenic epitopes prediction of lipase (B).

Table 2 Assignment of peptide fragments of four allergenic proteins identified by proteomics.
In order to analyze the potential epitopes of catalase and lipase reactive to B cells and T cells,the Protean panel of DNAstar software on a basis of bioinformatics was used.B cell epitopes prediction was conducted by Jameson-Wolf method[20],and T cell epitopes prediction was by Rothbard-Taylor and AMPHI methods[21,22].As shown in Fig.1A,the B cell epitopes of catalase were distributed at 1-28,35-44,50-73,76-95,108-122,128-140,146-173,178-183,192-206,214-222,225-264,274-290,292-302,303-323,335-343,347-362,367-379,385-411,415-465,and 469-485 residues sites;and its T cell epitopes were distributed at 44-55,71-92,98-103,111-130,147-158,168-184,195-206,252-273,288-294,300-318,376-383,398-408,and 429-476 residues sites.As shown in Fig.1B,the B cell epitopes of lipase were located at residue sites 3-10,37-47,59-78,86-106,113-126,130-144,165-171,198-215,245-268,280-296,and 318-342;and its T cell epitopes were located at residue sites 30-40,75-85,120-143,185-212,226 -245,252-257,268-287,and 310-320.Notably,B cell antigenic sites on the peptide chains overlapped highly with the flexible regions,suggesting that these regions have higher plasticity and flexibility prone to combine with corresponding antibodies;and T cell antigenic regions covered their active sites.Moreover,catalase in mammals and microorganisms has common autoantigenic epitopes (AE)-1 and AE-2,which are located on the surface of its 3D structure[23].In the catalase ofB.napusbee pollen,the AE-1 and AE-2 regions also exist,which has conserved sequences around the amino acid sites 160 and 315,respectively,corresponding with the predicted epitopic sites.All the predicted antigenic epitopes of catalase and lipase account for far more than 50% of the total sequence,indicating their high antigenic activity to induce food allergy.
3.2 Degradation of allergens in LAB-fermented B.napus BP
SEM analysis showed that the spore morphology ofB.napusBP changed significantly after LAB fermentation.The natural pollen grains are oblong spheres with a reticulated porous outer wall covering the surface,three depressions called germination grooves,and closed pore-like sunken germination pores (Fig.2A).But the fermented pollen grains are spherical in shape,with the outer wall splitting along the germination groove to expose the inner core contents (Fig.2B).Some spores are severely fragmented and dissolved into fragments and unidentified polymers during fermentation.The outer wall of spore pollen is chemically,thermally,and tolerably resistant,and cannot be completely decomposed by the human digestive system,which limited the bioavailability of nutrients and bioactive compounds in BP[24].Microbial fermentation can help to crack the pollen wall and release the contents,that enhances the flavor and nutritional properties of BP and promotes better absorption and utilization of the active substances in BP[7].
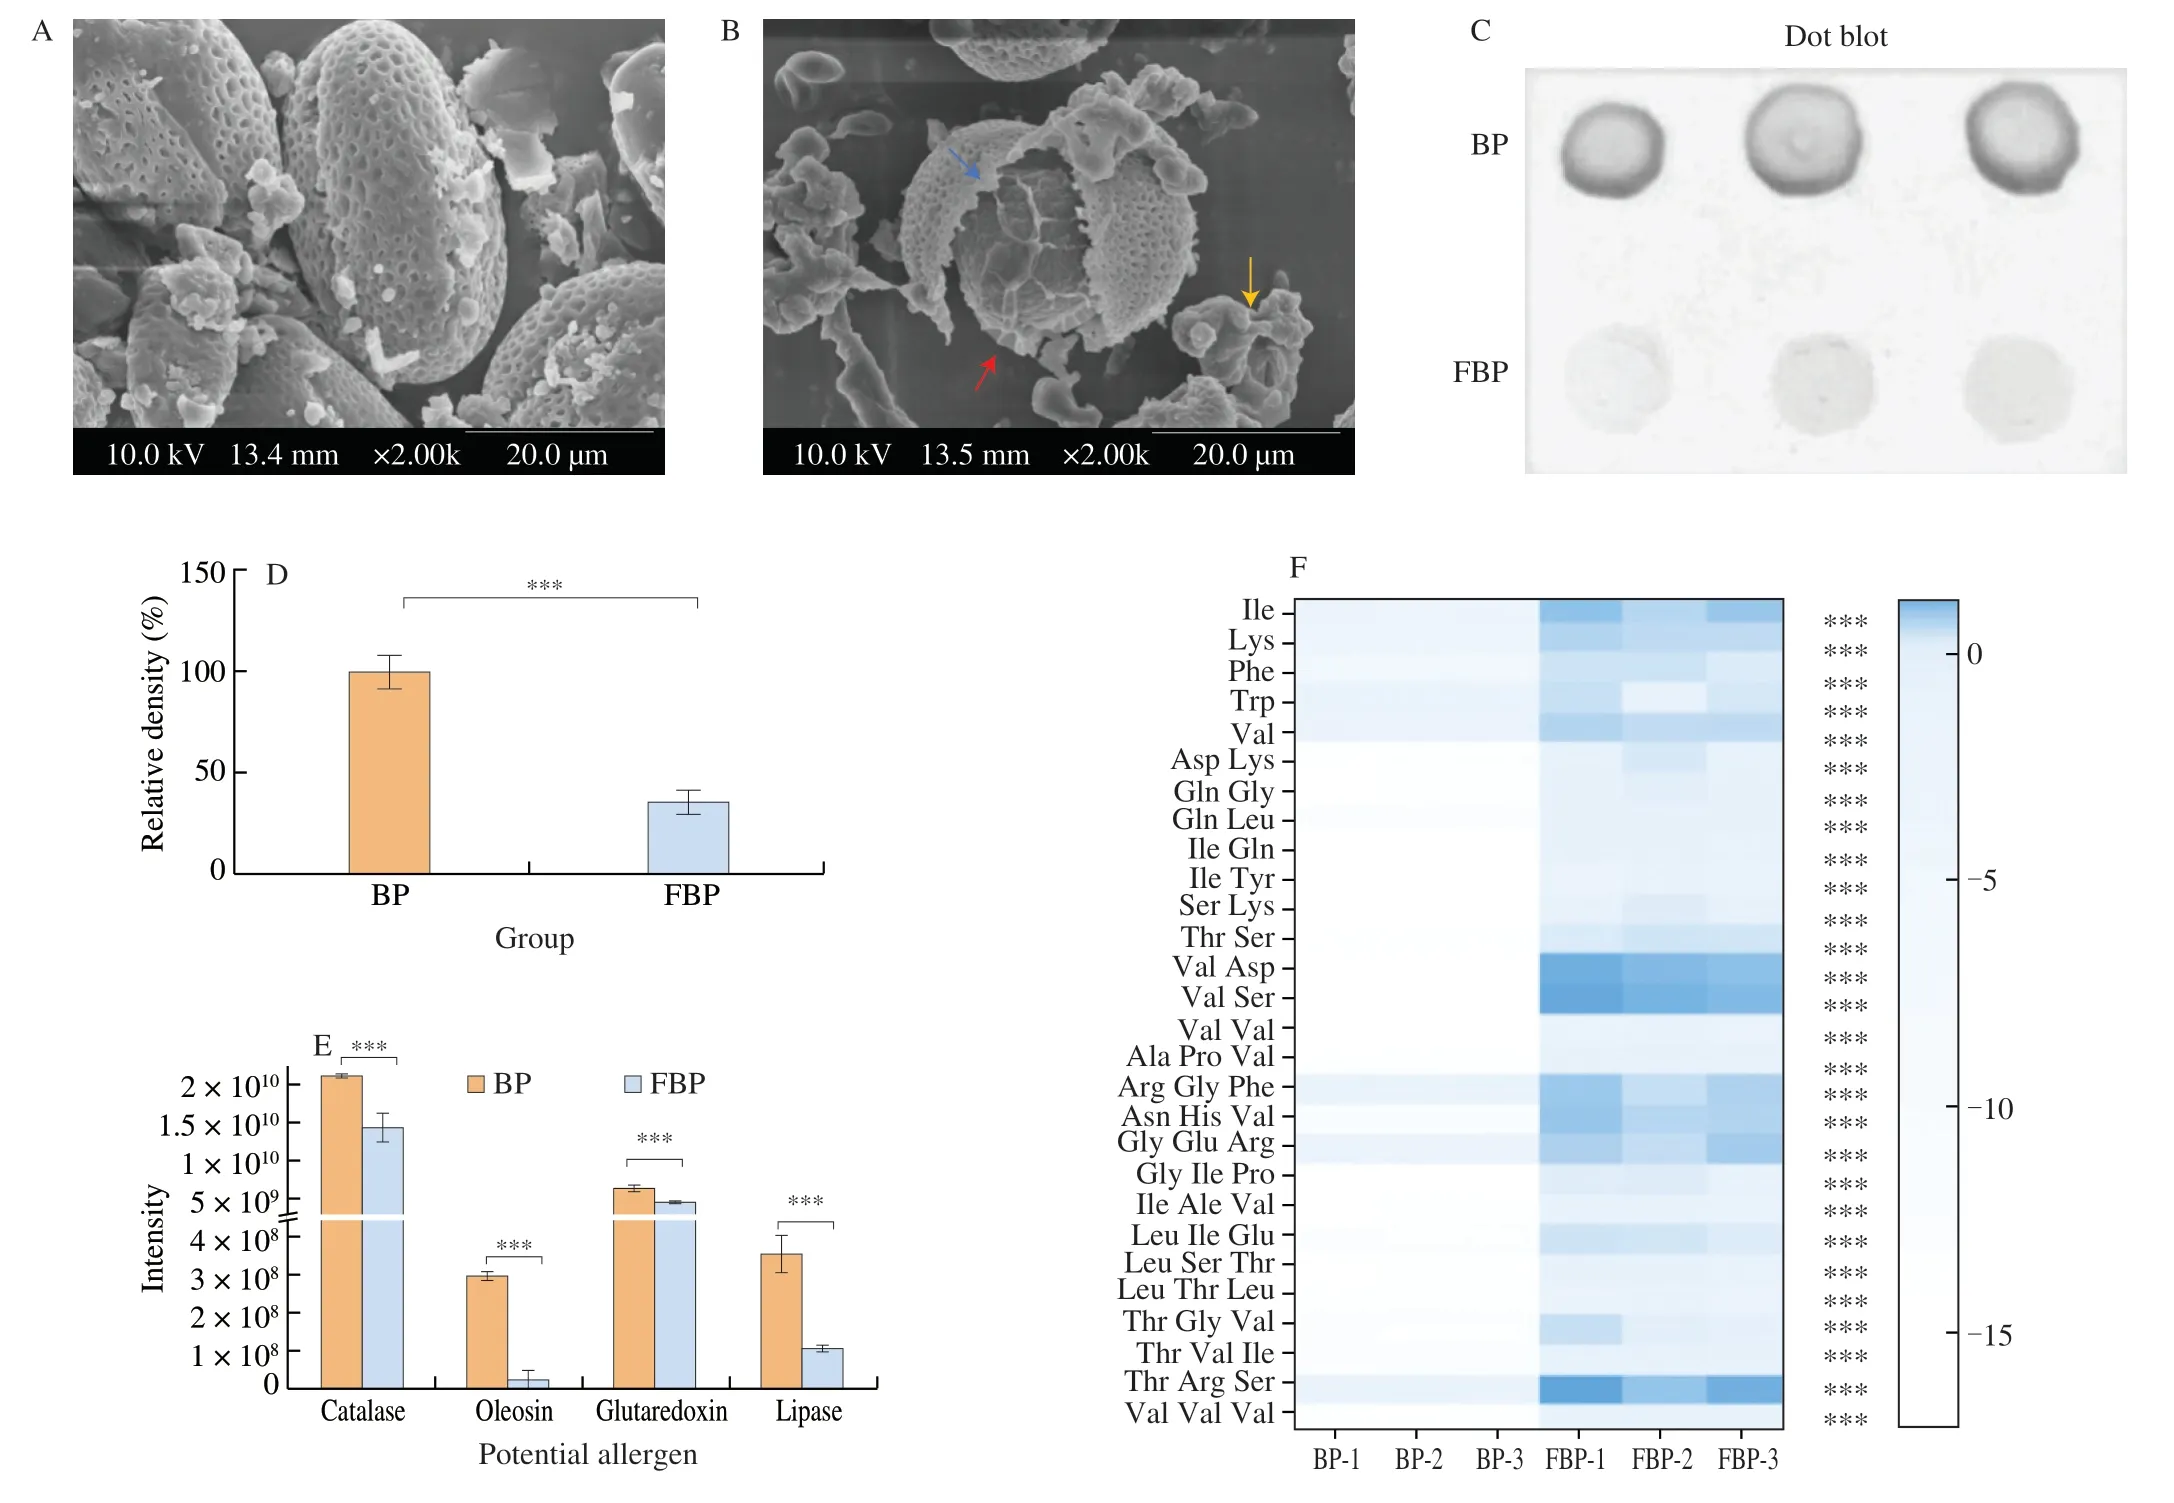
Fig.2 Degradation of allergens in LAB-fermented B.napus BP.Scanning electron microscopy (SEM) analysis of natural and LAB-fermented B.napus BP (A and B).The blue arrow shows a split on pollen outer wall along germination groove.The red arrow shows the core of pollen grain exposed.The yellow arrow points out the aggregation of pollen fragments;IgE-binding affinity of natural and LAB-fermented B.napus BP protein (C and D);Allergen detection in natural and LAB-fermented B.napus BP based on proteomics (E);oligopeptides and amino acids analysis in natural and LAB-fermented B.napus BP based on metabolomics (F).The label of *** means P <0.001.
Human immunoglobulin E (IgE) antibody binding affinity is a vital indicator to evaluate food allergenicity[25].Immunological analysis proved that the IgE-binding capacity of LAB-FBP protein was decreased significantly than those of control group (P<0.001)(Figs.2C and D).Moreover,proteomic analysis revealed that the contents of allergenic proteins (glutaredoxin,oleosin-B2,catalase,and lipase) inB.napusBP were reduced significantly after LAB fermentation in comparison with the control group (P<0.001)(Fig.2E).Meanwhile,the levels of 28 kinds of oligopeptides and amino acids in LAB-FBP were increased significantly than those in the control group (P<0.001) (Fig.2F).These oligopeptides and amino acids are the major constitutes of glutaredoxin,oleosin-B2,catalase,and lipase.Microbial fermentation could produce proteases and other enzymes to decompose pollen wall,release the contents,and degrade allergenic proteins into small molecule peptides and amino acids[26,27].Overall,it demonstrated that LAB fermentation could reduce the allergenicity of BP by degrading allergens (i.e.,glutaredoxin,oleosin-B2,catalase,and lipase) into small molecular peptides and amino acids.
3.3 LAB fermentation alleviates the allergic reaction of BP on mice
3.3.1 Histopathological changes
HE staining results showed histopathological changes in the spleen of mice (Figs.3A1-D1).Splenocytes were intact and clear in the control group (Fig.3A1),but were swollen and piled up after allergen stimulation in OVA and BP groups,and moreover,the spleens in OVA and BP groups were with unclear boundaries and the presence of inflammatory cells infiltration and interstitial congestion (Figs.3B1,C1).Splenocytes in FBP group possessed clearer boundaries and less inflammatory cells infiltration compared to BP group (Fig.3D1).The thymus cells in the control group were arranged uniformly,and the thymus tissues were with clear boundaries between the thymic lobules and the medulla (Fig.3E1),while it showed disorganized cellular arrangements,with a ‘cord-like’ accumulation,narrowed interstitial spaces,and inflammatory cells infiltration in OVA and BP groups(Figs.3F1,G1).The nuclear staining of thymus in OVA and BP groups was darkened,indicating an increase of nuclear condensation,nuclear division,cell lysis,or cell apoptosis.But it was alleviated effectively in the FBP group (Fig.3H1).TB staining showed an increased production of mast cells in the spleen and thymus tissues of OVA and BP groups (Figs.3B2,C2,F2,G2),but there’s no significant increase in the production of mast cells in the spleen and thymus tissues of FBP group (Figs.3D2,H2),compared to the control group (Figs.3A2,E2).Mast cells express IgE Fc receptors and release allergic mediators that can cause tachyphylactic allergic reactions in the tissues.Therefore,the number of mast cells in tissues can reflect the body allergic status[28].The results of HE and TB staining showed that BP can cause allergic reactions while FBP can alleviate the allergic reactions.

Fig.4 Changes of allergic mediators including histamine (A),spermidine (B),spermine (C),5-hydroxymethyltryptamine (D),tryptamine (E),octopamine (F),β-phenylalanine (G),and IgE antibody (H) in mice serum of different treatment groups.Different lowercase letters represent significant differences among groups (P <0.05).

Fig.4 (Continued)
3.3.2 Changes of mice allergic mediators
The levels of mice allergic mediators such as HIS and IgE antibody can be used to evaluate allergic status[29].Based on UPLC-QQQ-MS/MS and immunological analysis,the content of serum HIS and IgE antibody in OVA and BP groups increased significantly compared to the control group (P<0.05) (Figs.4A,H),while there were no significant differences between FBP group and control group.It indicated that BP induced allergic reaction in mice but LAB-FBP reduced the mice allergy.
Mast cells can release 5-HT when allergens induce antibodies to bind with Fc receptors,which aggravates allergic reactions[30].The production of 5-HT could modulate the immune response through tryptophan metabolic pathway,and the concentrations of tryptophan,tyrosine and phenylalanine were found with significant increases in the serum of allergic patients[31].Tyrosine is a precursor of OCT,which might induce a production of OCT during allergic reactions.In this study,the contents of 5-HT and OCT in mice serum of BP group were increased significantly compared to the control group,while those in FBP group were reduced significantly (P<0.05)(Figs.4D,F),which also indicated the allergic reaction in BP group but an allergic alleviation in FBP group.There’s no significant increase in the content of 5-HT in OVA group compared to the control group.It is speculated that the serotonin signaling system of OVA-sensitized mice was activated,and 5-HT acted on receptors or metabolized to 5-hydroxyindoleacetic acid[32].
Additionally,SP and SPD were found with increased levels after OVA excitation in mice,and they exerted positive effects on immunity and anti-inflammation[33].SP also has been found with protective effects in some inflammatory diseases[34].Here,we found that FBP induced the increases of SP and SPD (Figs.4B,C),suggesting a potential protective effect of FBP on mice immunity.Additionally,the contents of TRP andβ-PHE were not significantly different between BP and FBP groups,but were significantly changed in those compared with CK and OVA groups (Figs.4E,G),which might be attributed to the intrinsic components of BP.
3.4 Protective effect of LAB-FBP on gut microbiota
Gut microbiota composition and structure have potential correlation with food allergy.ACE,Shannon,Chao,and Simpson indexes indicated alpha-diversity of gut microbiota among the samples with different treatments.As shown in Fig.5,ACE,Shannon,and Chao indexes were decreased while Simpson index was increased significantly in OVA-treated group compared to CK group (P<0.05).Fig.5E shows the beta-diversity of different samples at ASV level by principal co-ordinates analysis (PCoA).It visualized the differences in gut microbial composition among different groups.OVA group was located at a separate quadrant far from the CK,BP and FBP groups.The clusters of CK,BP and FBP groups were intersected.These results indicated that there’s a distinct microbic community structure in OVA group,while no significant differences in gut microbiota composition among CK,BP,and FBP groups.

Fig.5 Alpha-and beta-diversity analysis of different samples at ASV level.The changes in the alpha-diversity of gut microbiota based on ACE (A),Shannon (B),Chao (C),and Simpson (D) index analysis.(E) The changes in the beta-diversity of gut microbiota based on principal co-ordinates analysis (PCoA).The label of * means P <0.05,** means P <0.01,*** means P <0.001.
The Kruskai-WallisHtest analysis revealed 5 major families with significant differences among different groups (Fig.6A).The abundances of Lachnospiraceae,Marinifilaceae,and Helicobacteraceae were reduced significantly in OVA group compared to CK group,while these were increased significantly in BP and FBP groups compared to OVA group (P<0.05).Lactobacillaceae andBacillaceaewere increased significantly in OVA group compared with CK group,but decreased significantly in BP and FBP groups compared with OVA group (P<0.05).

Fig.6 Kruskai-Wallis H test analysis among different groups (A) and KEGG pathway analysis by phylogenetic investigation of communities by reconstruction of unobserved states (PICRUSt) (B).The label of ** means P <0.01.
As reported,the abundance of Lachnospiraceae was enriched in the gut microbiota of healthy mice with potential protective effects against food allergy[35].Lactobacillaceae levels were higher in OVA-sensitized Il4raF709 mice than in controls[36].The growth of Lactobacillaceae might be triggered to resist allergic responses,and further modulate immune function by regulating Th1/Th2 balance[37].The persistence ofBacillusactivated a durable immune responsein vivo[38].The increase of Bacillaceae in OVA group might be induced by allergic reactions.Some of Helicobacteraceae such asHelicobacterpylorimight suppress food allergy attributed to its immunomodulatory activity on the activation and polarization of T cells[39].These evidences are corresponding with our findings which demonstrated the close correlation between food allergy and gut microbiota.And the LAB-FBP alleviated allergic reactions in mice and exerted protective effects on regulating gut microbiota.
3.5 Prediction on the host metabolism regulation by LAB-FBP
Based on KEGG pathway enrichment analysis by PICRUSt,8 metabolic pathways were predicted with significant alteration,which might be involved in the process of allergic reactions.As shown in Fig.6B,OVA and BP sensitization might inhibit biosynthesis of unsaturated fatty acids,linoleic acid metabolism,α-linolenic acid metabolism,steroid hormone biosynthesis,glycosphingolipid biosynthesis,lysine degradation,and lipopolysaccharide biosynthesis,while FBP treatment alleviated these inhibitions.
Unsaturated fatty acids play an important role in regulating immune cells by acting on specific receptors,especially with anti-allergic properties[40].The biosynthesis of unsaturated fatty acids helps reducing the development of anaphylaxis.Glucocorticoids are a type of steroid hormone with strong anti-allergic,anti-inflammatory,and immunosuppressive effects.Endogenous glucocorticoids are related to the endocrine and immune systems and play protective effects in pathogen elimination and tissue repair/regeneration[41].Sphingolipids can activate natural killer T cells and regulate immune responses through rapid secretion of cytokines[42].Lysine can enhance the immune function and protect the immune system by down-regulating interleukin-1β,tumor necrosis factor-α,interferon-γ,etc.[43].Lipopolysaccharide biosynthesis facilitates the activation of dendritic cell polarization and the induction of Th1 cell differentiation,to play a protective role in immunomodulating allergic reaction[44].Our findings were corresponding to the previous evidences about the relationship between food allergy,gut microbiota,and host metabolism.And moreover,it demonstrated that the LAB-FBP exerted alleviatory effects on food allergy by regulating gut microbiota and host metabolism,in comparison with the natural BP.
4. Conclusion
In summary,based on the combined analysis of proteomics,metabolomics,and immunoblot,we demonstrated that LAB fermentation could degradeB.napusBP allergens (i.e.,glutaredoxin,oleosin-B2,catalase and lipase) into small molecular peptides and amino acids,to change their epitopes and reduce their allergenicity.Moreover,LAB-FBP could alleviate the pathological symptoms and reduce the production of mast cells and allergic mediators such as bioamines and IgE antibody in sensitized mice.It also regulated the gut microbiota and host metabolism to strengthen mice immunity and alleviate allergic reactivity.This study clarified the food allergy alleviatory mechanism of LAB-FBP and could provide a scientific support for further development of hypoallergenic,healthy,and nutritional BP products.
Conflict of interest
The authors declare no conflict of interest.
Acknowledgement
This work was supported by the National Natural Science Foundation of China (32102605),and the Agricultural Science and Technology Innovation Program under Grant (CAAS-ASTIP-2020-IAR).

- 食品科学与人类健康(英文)的其它文章
- Modifications in aroma characteristics of ‘Merlot’ dry red wines aged in American,French and Slovakian oak barrels with different toasting degrees
- Effect of different drying methods on the amino acids,α-dicarbonyls and volatile compounds of rape bee pollen
- Dynamic changes in physicochemical property,biogenic amines content and microbial diversity during the fermentation of Sanchuan ham
- A comparison study on structure-function relationship of polysaccharides obtained from sea buckthorn berries using different methods:antioxidant and bile acid-binding capacity
- Yolk free egg substitute improves the serum phospholipid profile of mice with metabolic syndrome based on lipidomic analysis
- Underlying anti-hypertensive mechanism of the Mizuhopecten yessoensis derived peptide NCW in spontaneously hypertensive rats via widely targeted kidney metabolomics