
Electric field and force characteristic of dust aerosol particles on the surface of high-voltage transmission line
2024-01-25 07:12:40YinggeLiu刘滢格XingcaiLi李兴财JuanWang王娟XinMa马鑫andWenhaiSun孙文海
Chinese Physics B 2024年1期
Yingge Liu(刘滢格), Xingcai Li(李兴财),†, Juan Wang(王娟),2,Xin Ma(马鑫), and Wenhai Sun(孙文海)
1School of Physics,Ningxia University,Yinchuan 750021,China
2Xinhua College of Ningxia University,Yinchuan 750021,China
3School of Electronic-Electrical Engineering,Ningxia University,Yinchuan 750021,China
Keywords: high-voltage current,electric field,aerosol particles,force characteristic
1.Introduction
With the advancements in solar and wind power generation technologies, high-voltage direct current (HVDC) transmission technology has gained widespread use for longdistance power transmission due to its specific advantages.[1]The development of HVDC transmission systems plays a crucial role in enabling efficient power transmission, facilitating the interconnection of diverse alternating current (AC) and direct current (DC) systems, and promoting the integration of renewable energy sources.[2,3]The construction and operation of ultra-high voltage (UHV) and extra-high voltage(EHV) DC transmission lines have brought significant attention to the environmental issues associated with corona discharge from the conductors of DC transmission lines.[4,5]Consequently, numerous scholars both domestically and internationally have undertaken extensive research on calculating the total electric field on the ground of DC transmission lines.They have proposed calculation methods based on Deutsch’s assumption,[6–9]finite element method,[10–12]finite difference method,[13]and simulated charge method,[14,15]which provide vital technical support.
The issue of atmospheric pollution resulting from economic and social development is progressively deteriorating.[16]The accumulation of substantial amounts of fine particulate matter in the air can adhere to the surface of highvoltage transmission lines,thereby significantly impacting the surface morphology of the conductors.Additionally,this phenomenon can exacerbate corona discharge of the transmission lines, leading to alterations in their surrounding electromagnetic environment[17]and resulting in increased operational and maintenance costs.[18]Chalmers[19]initially discovered that airborne particulate matter influences the ambient electric field through charged interactions.Furthermore,Li’s research[20]demonstrated that strong electric fields acting upon particles significantly affects the optical characteristics of sand particles.These findings are significant for analyzing laboratory data and remotely sensed information related to parameters of sandstorm and rain-cloud.
Qian[21]developed a formula, based on the assumptions of Deutsch and Kaptzov,[22]for calculating the total electric field on the ground under sandy and dusty conditions.Additionally, Qian conducted a comprehensive study and analysis on the impact of these conditions on the electromagnetic environment surrounding the transmission line.Wanget al.[23]investigated the impact of fouling particles on the electric field surrounding high-voltage conductor.Specifically,they examined the influence of four particle shapes (conical, cylindrical, spherical, and hemispherical) as well as their relative dielectric constants on the maximum electric field strength at the surface of the conductor.The simulation results revealed that factors such as the length(radius)and apex angle of fouling protrusion, along with the dielectric constant of the contaminant, significantly influence the electric field strength at the contaminated conductor.Lüet al.[24]employed finite element software to simulate the electric field distribution on a simulated conductor.The findings indicated that the maximum electric field strength at the apex of fouling particles exhibited an upward trend in response to higher relative dielectric constants.Conversely, the reduction occurred as the size of spherical fouling particles increased, whereas it exhibited an increase with the enlargement of conical fouling particle dimensions.Guet al.[25]examined the corona characteristics of the conductor surface by employing simulated dirt and toner particles with varying surface densities.The researchers specifically investigated the influence of dirt on the corona behavior of a±800-kV EHV DC transmission line using corona cages for experimentation.By combining experimental findings and simulation studies,a preliminary relationship was established between the corona onset voltage and the degree of surface contamination on the conductor of the±800-kV EHV DC transmission line.Maet al.[26]conducted an experiment focused on dirt coating using a compact corona cage.Their findings revealed that proximity to dirt material led to a significant increase in ion current and audible noise on the positively charged conductor of a±500-kV EHV DC transmission line due to enhanced electric field strength near its surface.Furthermore,they employed both corona images and corona pulse measurement data to elucidate the factors contributing to the changes in contaminated conductor’s observed corona characteristics.Liuet al.[27]employed a combination of eccentric dipole method and charge simulation method to determine the electric field distribution near conductor exposed to sand and dust particles.The results suggest that dust particles significantly distort the electric field surrounding the transmission line,with larger dust particles exerting a more pronounced impact on the spatial electric field at equivalent distances.Additionally,when sand particles are in close to the transmission line,the surface field strength of dust particles increases to approximately double the original field strength observed in the absence of dust.
It can be seen that the majority of existing studies primarily focus on the ground total field strength,[28,29]the electromagnetic environment characteristics surrounding high-voltage AC and DC conductors without adhering particles,[30–33]and analysis of insulator electric field.[34–36]However, there are fewer studies on the electromagnetic environment characteristics on the surface of high-voltage DC conductors with varying degrees of particles adhering.[37,38]Furthermore,it should be noted that the adhesion of particles to the conductor’s surface significantly impacts its wind deviation law.[39]Wind deviation poses an additional challenge for conductors serving in windy areas as it may result in tripping phenomena.The adsorption of complex atmospheric particles on the conductor’s surface can alter its properties and kinetic characteristics.Moreover, it has potential to corrode the protection layer of the conductor, thereby affecting its lifespan.Therefore, accurate prediction and assessment of conductor surface fouling state are crucially significant for the maintenance of transmission line.
Following this, several scholars have carried out researches on the characteristics of atmospheric particulate matter in the vicinity of high-voltage transmission line.Maet al.[40]investigated the impact of atmospheric particles on the three-dimensional total electric field beneath the UHV DC transmission line and provided a briefly analysis of particles forces and motions.The results show that these particles significantly distort the total electric field at ground level, with peak field enhancement area reaching 2–3 times their original values.Furthermore, the adsorption of particles on the transmission line is determined by their respective force.Zhanget al.[41]established a three-dimensional model to simulate the accumulation of pollutants on insulator strings under DC composite electric field.The results demonstrate that specific composite electric field result in maximum pollutant accumulation on the insulator string.When nominal electric fields near insulator string are excessively high, pollutant accumulation increases on the lower surface of insulator sheds while decreasing with weakening ion flow field.
In the arid and consistently dry region prone to desertification,particles are influenced significantly by gravity,electrostatic force,van der Waals force,and fluid force.Therefore,it is crucial to investigate the electric field distribution on the surface of HVDC conductors and the forces exerted on particles under different fouling conditions in order to achieve more accurate predictions of fouling characteristics in both UHV and UHV DC conductors.With this objective in mind, the present study systematically investigates the impact of transmission line fouling on the electric field near the transmission line as well as the forces affecting the particles.Additionally,it examines the potential occurrence of transmission line fouling at various locations.
2.HVDC transmission line model
2.1.Geometric model
This study presents a modeling approach utilizing 1:1 geometric modeling and hybrid meshing to simulate the distribution of electric field on the surface of an HVDC transmission line under fouling conditions.The computational domain is discretized and solved separately for each sub-conductor’s surface.To enhance computational efficiency, the following assumptions are applied in the calculation of the transmission line.(i) It is assumed that the split conductors are infinitely long smooth conductors with identical radii.They are arranged in parallel to each other and parallel to the Earth’s surface.(ii) Considering that the actual transmission frequency used in China falls within the range of the shallow frequency field, where the distance between observation point near the calculated field and conductor is significantly smaller than the wavelength of the electric field propagating in air, it can be considered quasi-static.Therefore,this simulation focuses on calculating the electric field strength on the surface of the highvoltage DC transmission line.(iii) This model simplifies the analysis by disregarding influence from surrounding environment and arc sag, treating them as a two-dimensional (2D)representation.Consequently, simplified calculation for electric fields is treated as a 2D field.
The distribution of the electric field on the surface of a high-voltage transmission line is addressed as an open-region problem.In this study,the finite element method is employed,and artificial boundaries are established at a certain distance from the transmission conductors.Considering the conductive nature of the Earth,we set the potential value at the artificial boundary corresponding to ground as zero.To ensure that the air domain boundary(i.e.,the computational field domain)simulates an infinite distance, a virtual domain consisting of infinite elements is introduced beyond the artificial boundary.Subsequently, we establish a transmission line model assuming clean conditions without adhering particles.The computational domain for this model is depicted in Fig.1.By introducing a layer thickness, we transform the open-region problem into a finite field, effectively resolving challenges associated with calculating electric field in infinite space.

Fig.1.Schematic diagram of the computational domain of the transmission line model.
The parameters of the HVDC transmission line model are shown in Table 1.
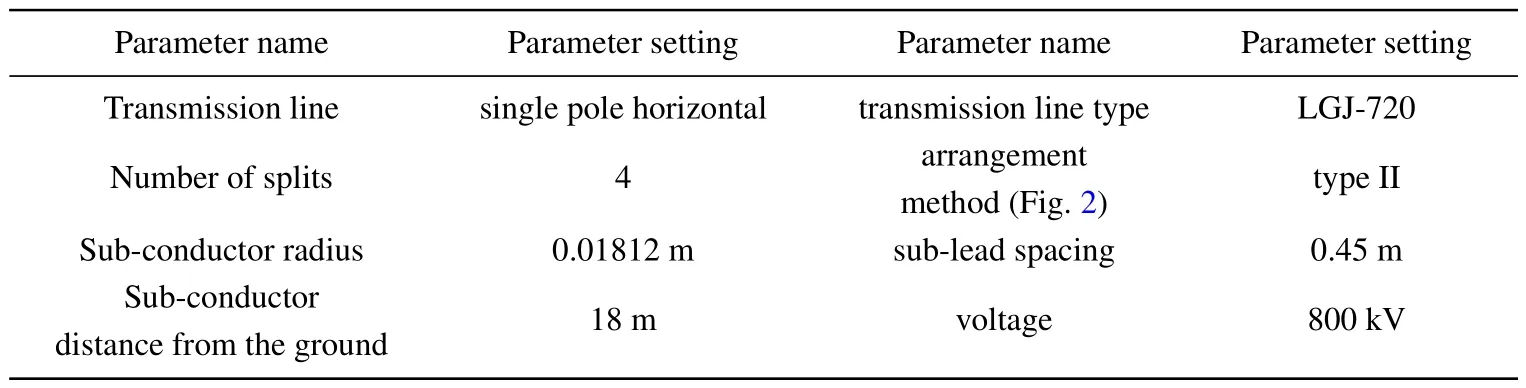
Table 1.HVDC transmission line model parameter.

Fig.2.Arrangement of monopole 4 split transmission lines:(a)the type I of arrangement,(b)the type II of arrangement.
According to the spatial domain selection method proposed by Wanget al.[42]for calculating the electric field strength of conductors,and considering the average cell mass and calculation rate of the grid, this paper finally determines the computational domain for modeling the electric field of a 4-division DC transmission line within a 210 m×136 m region.The comparative analysis diagram illustrating the selection of computational domain is shown in Fig.3.From the diagram,it can be observed that the model with the computational domain of 210 m×136 m has the highest average cell mass and minimum cell mass, while also reducing computation time and improving model efficiency due to fewer domain cells.Figure 4(a) depicts the structure of a clean transmission line, while figures 4(b)–4(d) illustrate different particle adhesion scenarios: single particles adhering,double particles adhering, and “triangular” arrangement of particles respectively.The size of the computational domain remains constant throughout subsequent calculations.
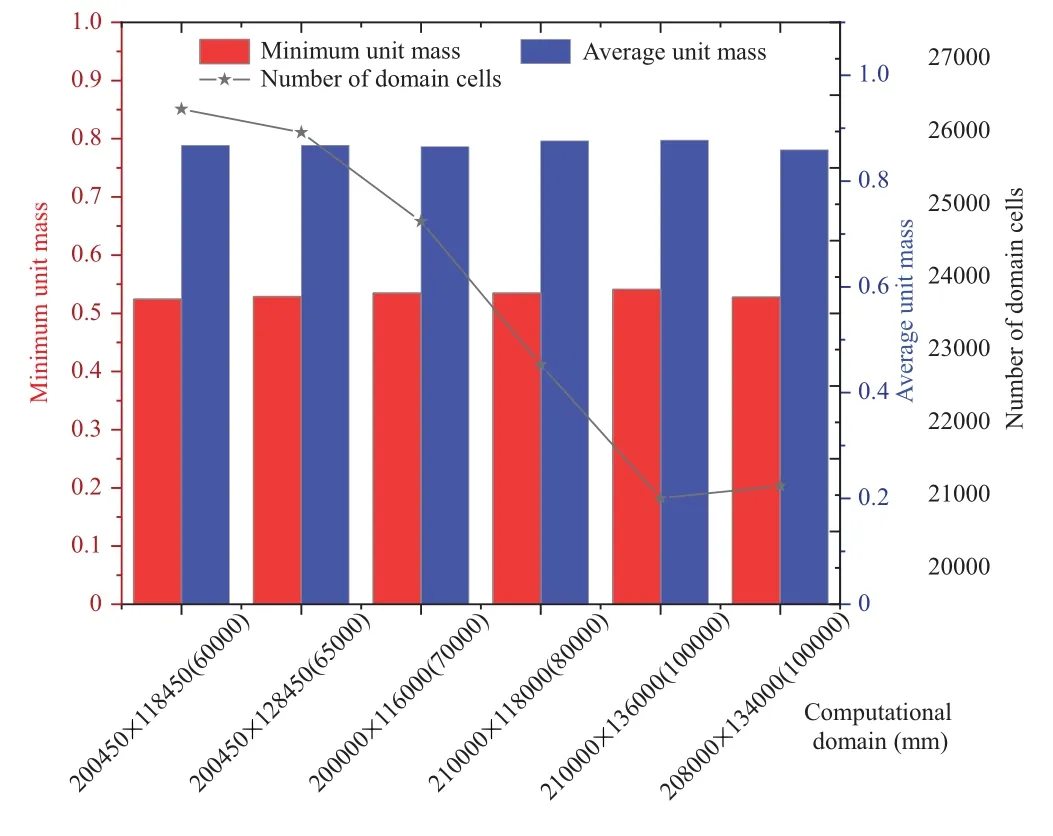
Fig.3.Comparative analysis chart of computational domain selection.

Fig.4.Schematic diagram of the geometric model of clean conductors and conductors under fouling conditions: (a) geometric model of the clean wire,(b)geometric model of single particle fouling layer with different radii,(c) geometric model of two-particle fouling layer with different spacings,(d) geometric model of the three-particle fouling layer of “triangular” arrangement.
2.2.Grid division and its quality
In the process of grid planning,a highly refined triangular grid is utilized to discretize the conductors and their surrounding areas, with a significantly smaller size compared to the radius of the split conductors.The employed grid for the infinite element domain is a structured grid that facilitates radial mapping,enabling as accurate representation of the properties at infinity within the infinite element domain.After implementing modifications to the grid, the final model comprises 21459 domain cells and 369 boundary cells,featuring a minimum cell mass of 0.5411 and an average cell mass of 0.8773.Figure 5 depicts the results of the grid discretization.
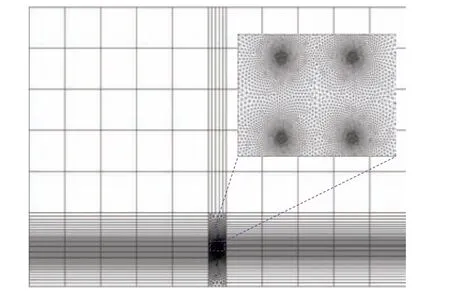
Fig.5.The grid profile of the clean transmission line electric field calculation model.
2.3.Boundary conditions and model solving
In this paper, the boundary conditions are established to fulfill the requirements of the charge conservation equation(Eq.(1))and the electric field instanton relationship(Eq.(2)):
The earth serves as the natural boundary,and a rectangular artificial boundary is implemented around the transmission line.The length of the artificial boundary is approximately 20 times the pole spacing of the transmission line, while the height of the artificial boundary measures twice the height of the transmission line’s center from the ground.Additionally, a layer thickness of 10 m is established beyond the artificial boundary of the infinite element domain, ensuring the proximity of the air domain’s boundary to an infinite distance,aligning with real-world conditions.In conclusion,within the calculation area outside of conductor,the following boundary conditions are established:(i)The potential of the earthφ=0.(ii)The potential on the surface of the conductorφequals the voltage magnitude of the transmission line.(iii) The potential magnitude at the artificial boundary is discretized using the finite element method to obtain numerical solutions for each node.Ultimately,the electric field strength in this HVDC transmission line model can be determined based on these potential values.
2.4.Electric field verification
The reliability of the computational domain settings in the numerical simulation is evaluated by constructing a transmission line model using the precise dimensions employed by Han.[43]A comparative analysis is conducted between this model and the findings reported in the reference, resulting in the verification comparison graph depicted in Fig.6.As depicted in the figure, the electric field intensity on the surface of each sub-conductor closely aligns with and conforms to the expected field intensity distribution pattern around the split conductor.

Fig.6.Comparison chart of model validation results.
3.Electric field distribution
3.1.Clean transmission line around the electric field distribution
To 4-split conductor of the second type of arrangement as an example, calculated as shown in Fig.7 to obtain the twodimensional electric field cloud atlas around the high-voltage transmission line, from the figure can be seen that the field strength along the surface of the transmission line approximately sinusoidal law changes, the maximum electric field strength on each sub-conductor appears in the direction of the geometric center of the split conductor and sub-conductor center line on the outer surface of the transmission line.In contrast, the minimum value generally appears on the inner surface.
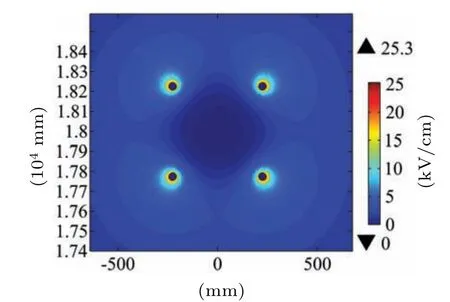
Fig.7.Electric field cloud atlas around the clean transmission line.
The 800-kV high-voltage DC transmission line is selected for this study, and its electric field mode contour distribution is shown in Fig.8.Among them, figure 8(a) shows the electric field mode contours of the monopole 4-split transmission line, and figure 8(b) shows the electric field mode contours of subconductor 1.From Fig.8(a), it can be found that the field strength value of the nominal electric field at the center of the conductor is almost zero; the electric field strength changes significantly in the range after about 200 mm from the center;the phenomenon of the surge and sudden decrease occurs in the range of 200 mm–300 mm according to the center,that is,the electric field around the conductor produces a sharp change, which is prone to corona discharge phenomenon and the corresponding total electric field effect.From Fig.8(b)we observed that the split sub-conductor,due to the electric field shielding effect,forms a closed circle around it(which is electric field mode contour),the split sub-conductor inside the field strength value is close to 0, while the split transmission line geometric center and each sub-conductor center line direction of the outer surface of the transmission line appeared the maximum value of electric field strength,through the corresponding calculation, the maximum electric field strength value of 25.67 kV/cm.
Fig.8.Electric field mode contour distribution map: (a) 4-split transmission line around the electric field contour distribution, (b) electric field contour distribution around sub-conductor 1.
3.2.Single particle fouling layer around the electric field intensity distribution
Owing to the presence of the “electrostatic dust absorption effect”in DC transmission lines,charged particles in the air experience a continuous directional electric field force,causing them to adhere to the surface of the transmission line.Additionally, the corona effect generated by the transmission line results in the accumulation of numerous charged particles in its vicinity.These particles bind with dust and other contaminants,thereby hastening the process of particulate deposition.
This section focuses on calculating and analyzing the changes in the top field strength for four distinct shapes of sand particles that are directly adhered to sub-conductor 1 based on their radii.Figure 9 illustrates the trends in top field strength variation for spherical, hemispherical, semi-ellipsoidal, and conical sand particles at various protrusion lengths.It is evident that among the different sand particle types,conical and semi-ellipsoidal particles exhibit significant electric field distortions, followed by spherical particles, while hemispherical particles demonstrate the least distortion.
For conical sand particles,when the diameter of the conical bottom remains constant, the maximum field strength at the top gradually increases with height.Similarly, for semiellipsoidal sand particles, when the short axis of the ellipsoid is fixed,the maximum field strength at the top gradually increases with the semi-major axis.Conversely, both hemispherical and spherical sand particles experience a gradual decrease in the maximum field strength at the top as their size increases, with the rate of decrease diminishing over time.Specifically,considering spherical particles as an example,the field strength at the top progressively decreases and eventually stabilizes at approximately 49.22 kV/cm,as depicted in Fig.9.

Fig.9.The variation curves of the top field strength of particles with different shapes with the protrusion length.
3.3.Electric field intensity distribution around the double particle fouling layer
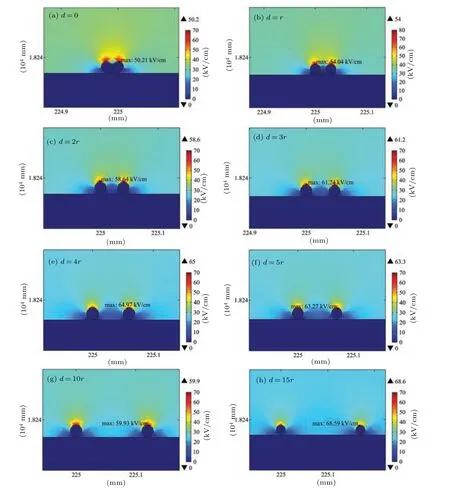
Fig.10.Electric field cloud atlas around double particles at different spacings.
This section calculates the electric field intensity on the sub-conductor’s surface under the influence of a fouling layer consisting of double particles (particle size: 0.01 mm) with varying spacings.The resulting distribution of electric field intensities is depicted in Fig.10.As observed in the figure,when the two particles are in contact (Fig.10(a)), they significantly impact the electric field strength on the transmission line’s surface, approximately doubling the surface field strength when no particles adhere.However,the effect on the surface field strength of the transmission line with adhered single particles remains relatively consistent, at approximately 1.03 times.As the distance between the two particles increases,the electric field strength around the transmission line progressively decreases.When the particle distance exceeds 15 times the particle size,the field strength becomes comparable to that of a particle-free transmission line’s surface.
3.4.The electric field intensity distribution around the three-particle fouling layer of “triangular” arrangement
This section calculates the electric field strength on the surface of the sub-conductor under the influence of a threeparticle fouling layer arranged in a triangular configuration,as illustrated in Fig.11.The figure reveals that the presence of three particles in the dirt layer surrounding the sub-conductor has a greater impact on the field strength compared to the contact between two particles in the dirt layer.Specifically, the maximum field strength at the tip of the three-particle dirt layer is approximately 1.44 times that of the double particles and about 1.5 times that of a single particle.These findings suggest that particles adhering to the transmission line surface are more prone to absorbing charged particles.

Fig.11.Electric field cloud atlas around multiple particles in contact with each other: (a)electric field around two particles with zero spacing,(b)electric field around three particles stacked in a“triangular”pattern.
4.Particle adsorption and its force analysis
4.1.Electric field intensity of single particle at different locations on the surface of the sub-conductor

Fig.12.Eight-way single particle model and its surface field intensity distribution cloud atlas:(a)particle surface field intensity distribution at orientation 7,(b)particle surface field intensity distribution at orientation 8,(c)particle surface field intensity distribution at orientation 1,(d)particle surface field intensity distribution at orientation 6,(e)particle adsorption orientation model,(f)particle surface field intensity distribution at orientation 2,(g)particle surface field intensity distribution at orientation 5, (h) particle surface field intensity distribution at orientation 4, (i) particle surface field intensity distribution at orientation 3.
By referring to Figs.7 and 8, it becomes evident that the outer surface of the transmission line experiences the highest electric field intensity (referred to as orientation 1 in Fig.12(e)).This orientation aligns with the connecting line between the split transmission line’s geometric center and the center of each sub-conductor.Conversely, the lowest electric field intensity occurs on the inner side of the split subconductor(referred to as orientation 5 in Fig.12(e)).Notably,orientations 3 and 7 in Fig.12(e)represent areas of strong and weak electric field intensity junctions, respectively.Consequently,this section establishes separate models for eight orientations (1–8) of 0.01 mm single particles on the surface of sub-conductor 1, as depicted in Fig.12(e).The calculations yield an electric field intensity cloud atlas around the single particle for each orientation(1–8),presented in panels(a)–(d)and(f)–(i).
Based on Fig.12, it is evident that the overall distribution of field intensity around the split transmission line remains consistent even after particle adsorption.Orientation 1 exhibits the maximum electric field intensity on the surface of the split conductor,measuring 61.14 kV/cm,which is approximately 2.4 times higher than the maximum electric field intensity when no particles are present.Conversely, orientation 5 represents the minimum electric field intensity on the surface of the split conductor,measuring 44.70 kV/cm,approximately 2.6 times lower than the minimum electric field intensity in the absence of adhering particles.Orientations 3 and 7 correspond to the intersections of strong and weak spatial field strengths,measuring 58.44 kV/cm and 57.29 kV/cm,respectively.Additionally,the field strengths outside the geometric center of the line exceed those on the inside.
4.2.Force on single particles at different locations on the sub-conductor surface
In deserted areas, the “electrostatic dust absorption effect” of DC transmission line is pronounced, so it is crucial to scientifically understand and analyze the force on dust particles.[44–46]In this section,the force on particles at different locations under the influence of the electrostatic field of high voltage transmission line is discussed based on theoretical analysis(Fig.13).

Fig.13.Force analysis of particles on the surface of sub-conductors.
The forces on the surface of the transmission line road conductor sand should mainly include gravity, van der Waals force, electrostatic force, and so on.The specific calculation formula is as follows.
(i)Gravity
whereGis the gravity of dust particlesN;ρis the density of dust particles(SiO2)ρ=2.2×10³kg/m3;gis the acceleration of gravity,Yinchuan is located at 38°20',and its gravitational acceleration is taken asg=9.832 N/kg.
(ii)Van der Waals force
In a dry environment, micron-sized particles are mainly affected by van der Waals forces in addition to other field forces in the collision process and adhesion behavior.[47,48]Since the radius of the particles is much smaller than the radius of the transmission line,the fouling particles and the transmission line are approximated as a model of a sphere and an infinitely thick plate,[49]and the van der Waals forces satisfied by the particles are obtained as
whereHis the Hamaker constant,which is related to the material properties.The Hamaker constant for the interaction of SiO2particles and Cu transmission lines in a vacuum(this section derives the equation treating air as a vacuum)is calculated from the Hamaker constant for the interaction of SiO2and Cu respectively in a vacuum (as in Eq.(5)).Ris the particle radius.Dis the minimum distance between the spherical particles and the contact planeD=1×10⁻⁸m.[50]
whereHSiO2=1.5×10⁻¹⁹J andHCu=2.84×10⁻¹⁹J.[49]
(iii)Electrostatic force
where the particle chargeQis given by Eq.(7)[51]and the electric field strengthEat the location of the particle is calculated through the eccentric electric dipole model.[52,53]

Fig.14.Electric field distribution around particles under non-uniform electric field.
This eccentric electric dipole model equates a particle in a nonuniform external electric field to an electric dipole off the center of the particle to calculate the actual field strength of the particle and the interparticle interaction force.[54]According to the electric dipole theory, the superposition of the applied field strength(i.e.,the spatial background field strength)and the electric field generated by the eccentric electric dipole is the actual field strength of the particle.From the engineering electromagnetic field theory, it is known that the actual field strength of a single particle under the action of an applied uniform electric fieldE0is shown in Eq.(8),while for a nonuniform external electric field (e.g., Fig.14), the actual field strength of the particle can be obtained after taking a zerolevel approximation(see Eq.(9)).
whereβ=(k −1)/(k+2),k=εp/εe,εprepresents the relative permittivity of particles,which has a value of 4.2;εeis the relative permittivity of air with a size of 1.000536.

Fig.15.Particle force variation graph: (a) variation of force on particles at various places on the transmission line surface,(b)curve of the variation of each force on the particle at azimuth 8 with radius.
In conclusion, the force analysis conducted on the single particle and the top particle of the“triangulartle”type resulted in a particle force variation diagram, as presented in Fig.15.Specifically,figure 15(a)illustrates the forces exerted on the surface of the sub-conductor by both the individual pellet and the“triangulartle”top pellet.Furthermore,figure 15(b)demonstrates the changes in forces acting on the single pellet as the radius varies at orientation 8.
The analysis of Fig.15 reveals that the primary adhesion forces between particles and the transmission line in a dry environment follow the order of electrostatic force and van der Waals force.These forces are approximately 75 and 19 times greater than the gravitational force acting on the particles at the minimum field strength,respectively.Notably,the electrostatic force greatly surpasses both gravity (0.09 µN) and van der Waals force(0.35µN).This observation suggests that, in regions with high field strength,the electrostatic force induces smaller particles to detach from the surface of the transmission line.Consequently,this leads to an uneven distribution of dust accumulation on the transmission line,exacerbating the occurrence of corona phenomena and potentially giving rise to other significant environmental issues.
4.3.Particle adsorption
The conditions of desorption[46]of the particles on the surface of the splitter conductor can be obtained by combining Fig.15 as
whereµis the coefficient of friction between the particle and the transmission line.
The desorption of particles under the electric field generated by the high voltage transmission line, as described in Eq.(10)and illustrated in Fig.15,can now be discussed.From Fig.15(a),it is evident that the particles within 200°–300°are more accessible to be adsorbed than those at 0°–100°.Among all orientations,particles at orientation 5 exhibit the highest accessibility for adsorption,while those at orientation 1 demonstrate the easiest propensity for jumping.By comparing single particles with particles situated on top of the“triangular”fouling layer, it can be concluded that single particles are more susceptible to adsorption based on variations in electrostatic and van der Waals force as well as gravity.
5.Conclusion
The accumulation of significant quantities of fine particulate matter on the surface of high-voltage transmission lines can exacerbate corona discharge,thereby altering the electromagnetic environment surrounding the transmission line.[9,55]This study investigates the variations in electric field intensity on the segmented conductor surface caused by various fouling layers and analyzes the principles governing the adhesion of dust particles to the conductor.Additionally, it develops a comprehensive force model incorporating electrostatic force,van der Waals force,and gravity acting between dust particles and subconductors.The research findings demonstrate the following points.
(i)The field strength along the surface of the high-voltage transmission line exhibits an approximately sinusoidal variation with the absence of adhered particles.The maximum field strength is observed towards the geometric center of the segmented transmission line and the centerline of the subconductors, on its outer surface.Conversely, the minimum field strength is typically observed on the inner surface.
(ii)The adhesion of individual particles modifies the electric field distribution on the surface of the transmission line.As the particle size increases, there is a gradually reduction in the peak field strength at the top of the particle, eventually reaching a constant value of approximately 49.22 kV/cm.Additionally,adhered particles exhibit a maximum field strength that is approximately 1.96 times higher than non-adhered particles under similar surface field strength conditions.
(iii)The presence of a dual particle fouling layer leads to a gradual reduction in the field strength surrounding the transmission line as the spacing between particles increases.At a particle spacing of 0, the surface field strength of the transmission line is approximately twice that of non-adhered particles.However, when the particle spacing exceeds 15 times the size of each individual particle, the surface field strength of the transmission line becomes comparable to that observed with non-adhered particles.
(iv)The field strength at the tip of a“triangular”arrangement of three particles in the fouling layer is approximately 1.44 times higher than that of a double-particle arrangement and 1.5 times higher than that of a single particle.These findings indicate that it is more prone to adhere charged particles on the surface of the wire after adhering particles.
(v)The primary forces responsible for adhesion between fouling particles and the transmission line are electrostatic force and Van der Waals force.The adhesion force ranges from approximately 10−10N to 10−9N.At the minimum field strength,these forces exceed the gravitational force acting on the particles by approximately 74.73 and 19.43 times,respectively.
These results bear significant importance in accurately predicting the extent of fouling accumulation on high-voltage conductors and assessing the corresponding safety risks.
Acknowledgements
Project supported by the National Natural Science Foundation of China (Grant No.12064034), the Leading Talents Program of Science and Technology Innovation in Ningxia Hui Autonomous Region, China (Grant No.2020GKLRLX08), the Natural Science Foundation of Ningxia Hui Auatonomous Region, China (Grant Nos.2022AAC03643,2022AAC03117, and 2018AAC03029), the Major Science and Technology Project of Ningxia Hui Autonomous Region,China (Grant No.2022BDE03006), and the Natural Science Project of the Higher Education Institutions of Ningxia Hui Autonomous Region,China(Grant No.13-1069).
猜你喜欢
延河·绿色文学(2023年2期)2023-03-20 19:09:42
延河·绿色文学(2023年2期)2023-03-20 19:09:42
学校教育研究(2022年1期)2022-03-22 02:45:06
Chinese Physics B(2021年11期)2021-11-23 07:32:26
Chinese Physics B(2021年10期)2021-10-28 07:09:36
健康之家(2021年19期)2021-05-23 09:10:44
艺术探索(2020年6期)2020-03-01 10:55:28
音乐教育与创作(2019年10期)2019-12-26 06:59:50
小天使·五年级语数英综合(2014年6期)2014-07-29 21:36:00
美术界(2014年7期)2014-04-29 00:44:03

- Chinese Physics B的其它文章
- High responsivity photodetectors based on graphene/WSe2 heterostructure by photogating effect
- Progress and realization platforms of dynamic topological photonics
- Shape and diffusion instabilities of two non-spherical gas bubbles under ultrasonic conditions
- Stacking-dependent exchange bias in two-dimensional ferromagnetic/antiferromagnetic bilayers
- Controllable high Curie temperature through 5d transition metal atom doping in CrI3
- Tunable dispersion relations manipulated by strain in skyrmion-based magnonic crystals