
Acute effect of foot strike patterns on in vivo tibiotalar and subtalar joint kinematics during barefoot running
2024-01-25 09:36:36DongqingYeLuLiShenZhngSonglinXioXioleSunShobiWngWeijieFu
Dongqing Ye,Lu Li,,Shen Zhng,Songlin Xio,Xiole Sun,Shobi Wng,Weijie Fu,b,
a Key Laboratory of Exercise and Health Sciences of Ministry of Education,Shanghai University of Sport,Shanghai 200438,China
b Shanghai Frontiers Science Research Base of Exercise and Metabolic Health,Shanghai University of Sport,Shanghai 200438,China
Abstract Background:Foot kinematics,such as excessive eversion and malalignment of the hindfoot,are believed to be associated with running-related injuries.The majority of studies to date show that different foot strike patterns influence these specific foot and ankle kinematics.However,technical deficiencies in traditional motion capture approaches limit knowledge of in vivo joint kinematics with respect to rearfoot and forefoot strike patterns(RFS and FFS,respectively).This study uses a high-speed dual fluoroscopic imaging system(DFIS)to determine the effects of different foot strike patterns on 3D in vivo tibiotalar and subtalar joints kinematics.Methods: Fifteen healthy male recreational runners underwent foot computed tomography scanning for the construction of 3-dimensional models.A high-speed DFIS (100 Hz) was used to collect 6 degrees of freedom kinematics for participants’ tibiotalar and subtalar joints when they adopted RFS and FFS in barefoot condition.Results: Compared with RFS,FFS exhibited greater internal rotation at 0%20% of the stance phase in the tibiotalar joint.The peak internal rotation angle of the tibiotalar joint under FFS was greater than under RFS (p <0.001,Cohen’s d=0.92).RFS showed more dorsiflexion at 0%20% of the stance phase in the tibiotalar joint than FFS.RFS also presented a larger anterior translation (p<0.001,Cohen’s d=1.28) in the subtalar joint at initial contact than FFS.Conclusion:Running with acute barefoot FFS increases the internal rotation of the tibiotalar joint in the early stance.The use of high-speed DFIS to quantify the movement of the tibiotalar and subtalar joint was critical to revealing the effects of RFS and FFS during running.
Keywords: Foot strike patterns;High-speed dual fluoroscopic imaging system;In vivo kinematics;Running
1.Introduction
Running has evolved from a necessary form of locomotion to a recreational and athletic pursuit.1Along with its popularity,the overall incidence of running-related musculoskeletal injuries has increased to approximately 40.2% for runners worldwide according to a very recent study.2More than onethird of these injuries are related to foot/ankle kinematics,among which the excessive joint angle of the hindfoot is one of the most common forms.2This excessive eversion at midstance may place disproportionate strain on the medial fibers of the Achilles tendon and increase the risk of Achilles tendon injury.3,4Meanwhile,excessive hindfoot eversion during the stance phase would increase strain on the flexor digitorum,tibialis posterior,and soleus muscles,thereby potentially leading to medial tibial stress syndrome.5-8
A number of recent investigations into the prevention of running injuries have focused on comparing foot strike patterns,particularly rearfoot strike pattern (RFS)vs.forefoot strike pattern (FFS).9-11Altman et al.12demonstrated that compared with RFS,FFS reduces the eversion amplitude and decreases the tendency to evert,which may potentially reduce eversion-related injuries.Moreover,the impact force of running with FFS is dissipated by a more compliant ankle joint in the sagittal plane.13However,the relationship between the foot strike patterns and injury prevention is still unclear.To clarify the effects of different foot strike patterns on injury prevention,knowledge of the precise kinematical features of the ankle joint is essential.Although previous studies have quantified joint kinematics with FFS and RFS in different planes,14,15more detailed information,including the motions of relative bones of the ankle complex in 3 dimensions,is still lacking.The main reason for this lack is the limitations of the traditional biomechanical approaches.
Conventional foot and ankle kinematic measurements(e.g.,high-speed infrared motion capture systems) can calculate joint motion from the trajectory of reflective markers attached to the surface of the human body.However,the accuracy of this method is limited by marker location and skin/soft tissue artifacts during locomotion.16Thus,in traditional motion capture systems where joint kinematics are calculated by reflective markers,the motion of talus cannot be recorded precisely,and so the motions of the tibiotalar and subtalar joints are often regarded as a single composite measure of“ankle” joint motion.17To avoid the abovementioned limitation and clarify the joint motion of ankle joint complex,researchers have performed cadaveric studies and implanted bone pins into living bodies.18,19However,both of these solutions have critical defects.The dynamic conditions of cadavers without autonomous neural control and muscle activation are different from those of living bodies.20Meanwhile,the bone pins are highly invasive and may potentially cause infection in living bodies,thereby further affecting the movement patterns of the participants.21Recently,the biplanar fluoroscopic measures have been applied to circumvent the limitations of traditional kinematic measurements when quantifyingin vivojoint movement.22In contrast to traditional means,biplanar fluoroscopy can noninvasively capture the 6 degrees of freedom (6DOF) motion of multiple bones independently.Its accuracy and repeatability in measuring the kinematics of the ankle joint complex (tibiotalar and subtalar joints) have been proven.23,24To date,however,very little is known about thein vivokinematics of the tibiotalar and subtalar joints with respect to different foot strike patterns.
The purpose of the present study was to determine the effects of different foot strike patterns on 3Din vivotibiotalar and subtalar joints kinematics by using a high-speed dual fluoroscopic imaging system (DFIS).We expected to observe significant differences between RFS and FFS in terms of joint kinematics,including range of motion (RoM) and the peak angles in translational and angular directions of the tibiotalar and subtalar joints.
2.Methods
2.1.Participants
The sample size was calculated by G-Power (Version 3.1.9.2;Heinrich Heine University,North Rhine-Westphalia,Germany) prior to the study.Paired samplettest was used.The effects size(0.8),significance level(0.05),and test power(0.8) were consistent with those obtained by Wang et al.,25who investigated the effects of 2 different shoes onin vivotibiotalar and subtalar joint kinematics during walking using the single fluoroscopic imaging system.On the basis of G-Power results,15 healthy male recreational runners(age=30.07.4 years,height=172.94.6 cm,body mass=70.3-8.3 kg,weekly running volume=44.4-24.4 km;meanSD) were recruited.Inclusion criteria were as follows:(a) had run at least 20 km per week over the past 3 months,(b)had taken no time off from running in the last 3 months due to lower extremity injuries,(c) habitually shod and rearfoot runners,and (d) right-foot dominant.All participants provided written consent.This study was approved by the Institutional Review Board of the Shanghai University of Sport (No.102772021RT034).
2.2.DFIS setup
The high-speed DFIS consisted of a series of components,including 2 X-ray sources and detector pairs,2 movable manipulators with scintillator screens and intensifiers,and 2 matching digital cameras (Phantom,Version 5.1;Vision Research,Wayne,NJ,USA) positioning around an elevated platform (Fig.1A).The cameras had built-in synchronization control devices,thereby allowing them to take images synchronously with X-ray sources to acquire real-time imaging data.The X-ray sources and movable manipulators were adjusted,thereby ensuring that the center of X-ray sources was aligned with that of the scintillator screens.The X-ray tubes of the system were operated at 60 kVp and 10 mA in continuous mode.Imaging volume was determined using an acrylic cube with numerous normal calibrators and 4 special calibrators (Fig.1B).The position of the normal calibrators can be automatically tracked by using XMAlab (Version 1.5.4;Brown University,Providence,RI,USA) to read the file about the relative position of the special calibrators in the acrylic cube.26After the identification of the positions of the normal and special calibrators,the relative positions of the 2 X-ray sources and scintillator screens in the real 3D space were calculated using the calibration module in XMAlab.Finally,the global frame of reference was defined.

Fig.1.Experimental setup of(A)the high-speed dual fluoroscopic imaging system(DFIS)and(B)the acrylic cube with 4 special calibrators used in this study.
2.3.Data acquisition
The participants warmed up on a treadmill for at least 5 min at a speed of 3 m/s.Then,regarding the FFS,participants were instructed by an elite athlete who qualified as a running coach.This coach determined the quality of the running movement during the experiment,including the foot strike pattern of the participants and the completeness of the whole running trial.Meanwhile,participants were supervised by the experimenter to ensure they were looking ahead and that their right foot landed within or slightly forward or backward(<50 mm)relative to the image volume during the test,thereby avoiding“targeting”.After completing at least 2 successful runs consecutively (as required),fluoroscopic images of the foot during the stance phase were acquired under barefoot conditions with either RFS or FFS (Fig.2A).The fluoroscopic images were used to confirm which part of the foot initially came into contact with the ground.Radiographic images were acquired at 100 Hz with a shutter speed of 1/1000 s,and participants ran at a speed of 3 m/s5% on an elevated platform.The Wittyanual grating timing system(Witty wireless training timer,Microgate,Bolzano,Italy) was used to ensure speed.An infrared-blocking grating sensor was applied to trigger the DFIS while participants ran through the platform.Only 1 trial for both RFS and FFS was acquired to reduce the total ionizing radiation.27-29
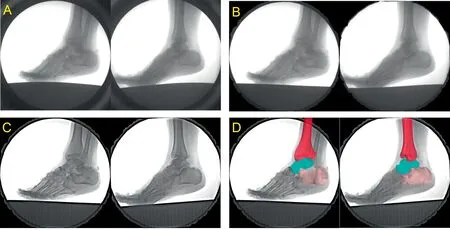
Fig.2.Images from the experiment.(A)the original image obtained by 2 digital cameras,(B)the corrected image after pincushion distortion,(C)final image after image enhancement,and(D)the example illustration of scientific rotoscoping.
2.4.Constituting model and data analysis
2.4.1.Computed tomography scanning and 3D modeling
Computed tomography(CT)scanning(Siemens Definition AS+128;Somatom,Berlin,Germany) was performed to obtain the CT images of each runners’right foot in the neutral position,held in place with a stationary barrier.The main CT scan parameters were as follows: thickness of 0.6 mm;voltage of 120 kV;current of 140 mA;image matrix of 512£512 voxels;and length,width,and height of voxel of 0.488 mm,0.488 mm,and 0.625 mm,respectively.The scanning scale ranged from 10 cm above the ankle joint to the bottom of the heel.29Then,the same operator used Mimics(Version 21.0;Materialise,Leuven,Belgium) to reconstruct 3D bone models of the tibia,talus,and calcaneus based on the CT images.
2.4.2.Anatomical coordinate systems
The anatomical coordinate systems of each bone were assigned individually at the neutral position obtained from the CT scan (Fig.3).To maintain consistency and facilitate comparison with previous studies,the definition of the coordinate systems followed those in other DFIS studies using the 3D modeling software (Rhinoceros,Version 6.0;McNeel &Associates,Seattle,WA,USA).29,30In the present study,the average interobserver difference in translation was 0.54 mm,and the average difference in rotation was 0.87˚.The average intra-observer difference in translation was 0.37 mm,and the average difference in rotation was 0.47˚.Below are the parameters of the anatomical coordinate systems.
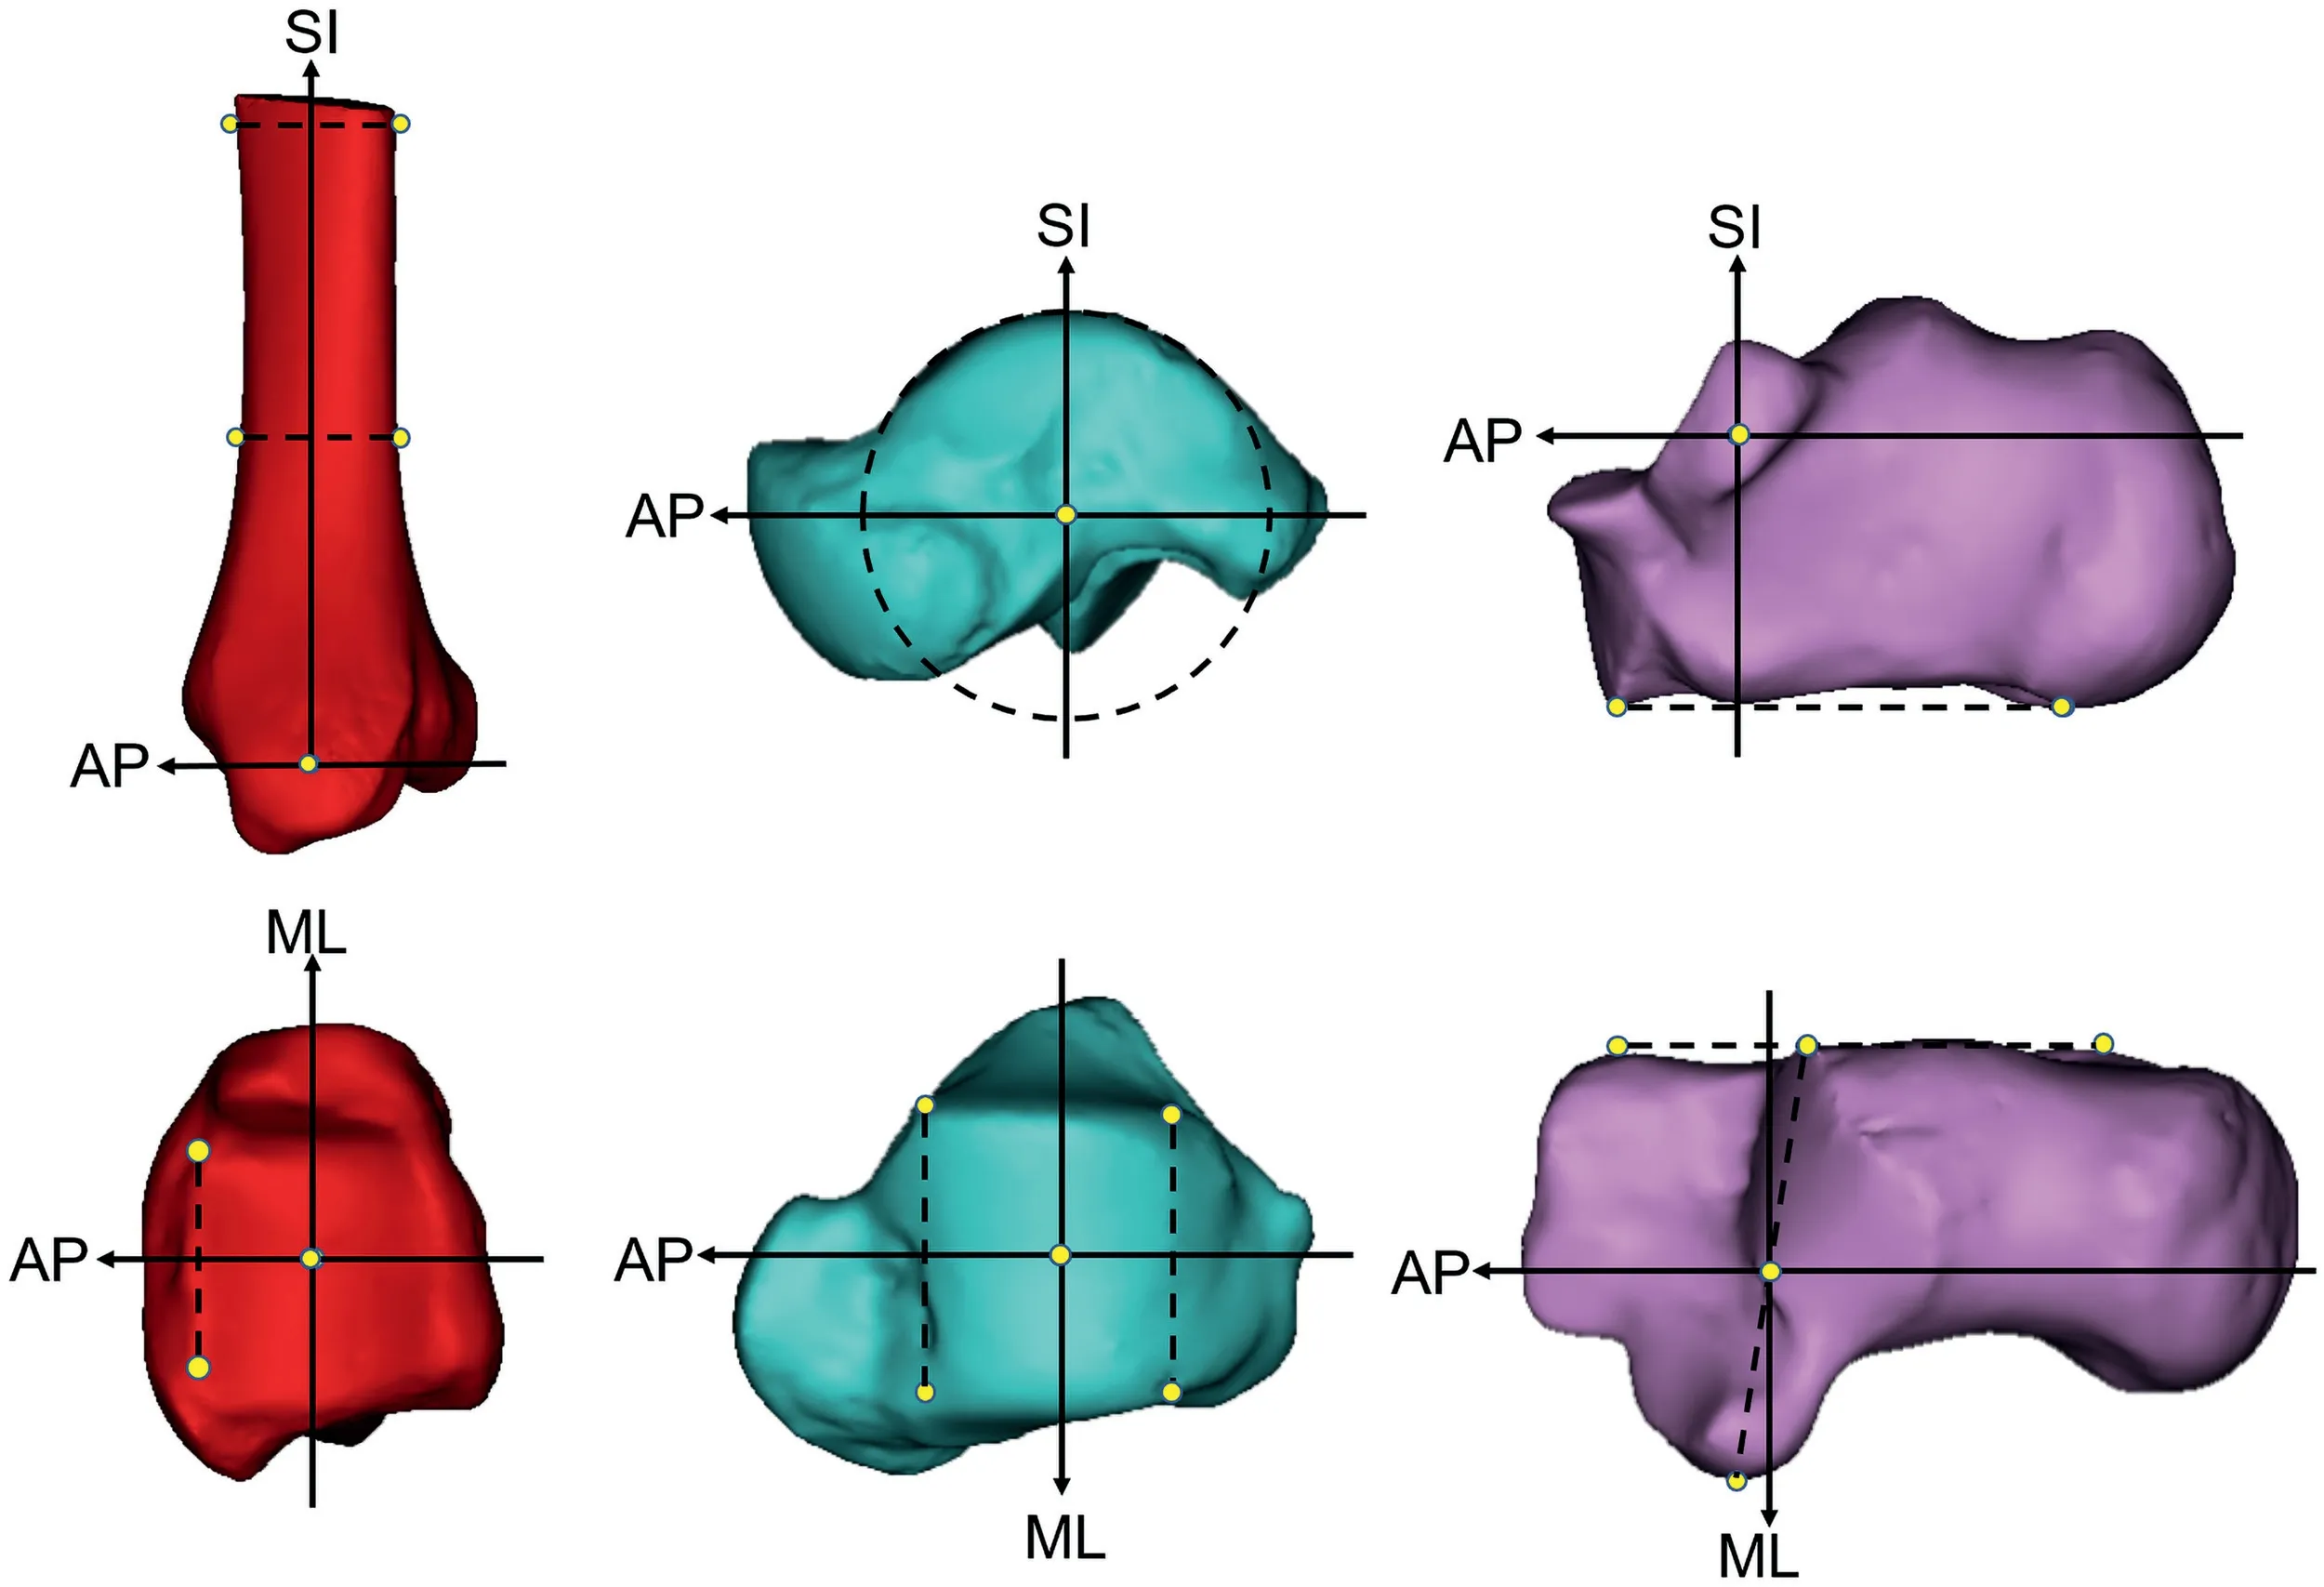
Fig.3.Anatomical coordinate system of the tibia (left),talus (center),and calcaneus (right).AP=anteroposterior axis;ML=mediolateral axis;SI=superoinferior axis.
2.4.2.1.Tibia coordinate system.Cross-sectional slices at 5 cm and 10 cm above the tibial articular surface were determined in Rhino.The line connecting the medial-lateral and anteroposterior center points of the slices was the supero-inferior axis,and the crossing point of this axis and the tibial plafond was the origin.The anteroposterior axis was the line perpendicular to the line connecting the anterolateral and anteromedial edge of the tibial plafond and the supero-inferior axis,thereby passing through the origin.The mediolateral axis was a cross product of the supero-inferior and anteroposterior axes.
2.4.2.2.Talar coordinate system.The midpoint of anteromedial and anterolateral edges and the midpoint of posteromedial and posterolateral edges of the trochlea tali were determined.We drew a circle containing the 2 points,and the arc was fitted to the trochlea.The center of the circle was the origin,and the mediolateral axis was the line perpendicular to the circle that passes through the origin.31The anteroposterior axis was the line parallel to the line connecting the anterior and posterior edge of the trochlea on the circle that passes through the origin.The supero-inferior axis was a cross product of the mediolateral and anteroposterior axes.
2.4.2.3.Calcaneal coordinate system.First,the most lateral point of the posterior articular surface and the most medial point of the middle articular surface were determined.A line connecting these points was drawn,and the center of the line was the origin.The supero-inferior axis was the line perpendicular to this line and the line tangent to the inferior surface of the calcaneus.The mediolateral axis was the line perpendicular to the supero-inferior axis and the lateral wall of the calcaneus that passes though the origin.The anteroposterior axis was the cross product of the supero-inferior and mediolateral axes.
2.4.3.Kinematic quantification
Pincushion distortion and magnetic lens distortion are both major sources of distortion in the data collection chain.32To account for this,a round aluminum plate with 406 holes was rigidly fixed to the input side of the image intensifier.After being imaged on 2 radiographic emitters,a thin plate spline algorithm was used for the imaged locations of these holes to generate a correction map that can be used to spatially correct every distorted image (Fig.2B).33After that,image enhancement was done by photoshop (Abode Photoshop CC 2018;Adobe Systems,San Jose,CA,USA) to make the contour of the bone clearer(Fig.2C).
After image enhancement,final fluoroscopic images and 3D bone models were imported into Rhino (Fig.2D).The scientific rotoscoping was done by the same operators.Our group’s previous study34and that of Cross et al.23showed that the 6DOF joint kinematics obtained by high-speed DFIS combined with scientific rotoscoping were in the sub-millimeter and sub-degree levels.Furthermore,the kinematics results from the same high-speed DFIS were highly correlated to the results obtained by gold standard based on the bone pins(r>0.917).34The position angular displacements and translations are expressed in relation to the neutral pose of the scans.The kinematic data (translational and angular) in the neutral pose needed to be subtracted from the kinematic data of a particular frame obtained by Rhino after scientific rotoscoping,because the angular displacements and translations of each runner’s right foot in the neutral pose were slightly different from one another.35In this way,the relative motion of the tibiotalar and subtalar joints can be calculated in a particular frame.The specific variable includes RoM at 6DOF,which was the difference between minimal and maximal positions(range) and the peak position (translational and angular).The execution time of the joint kinematics of the tibiotalar and subtalar joint during the stance phase was standardized in MATLAB (R2018a;MathWorks,Natick,MA,USA).Fig.4 demonstrated the data collection and process of high-speed DFIS in the current study.
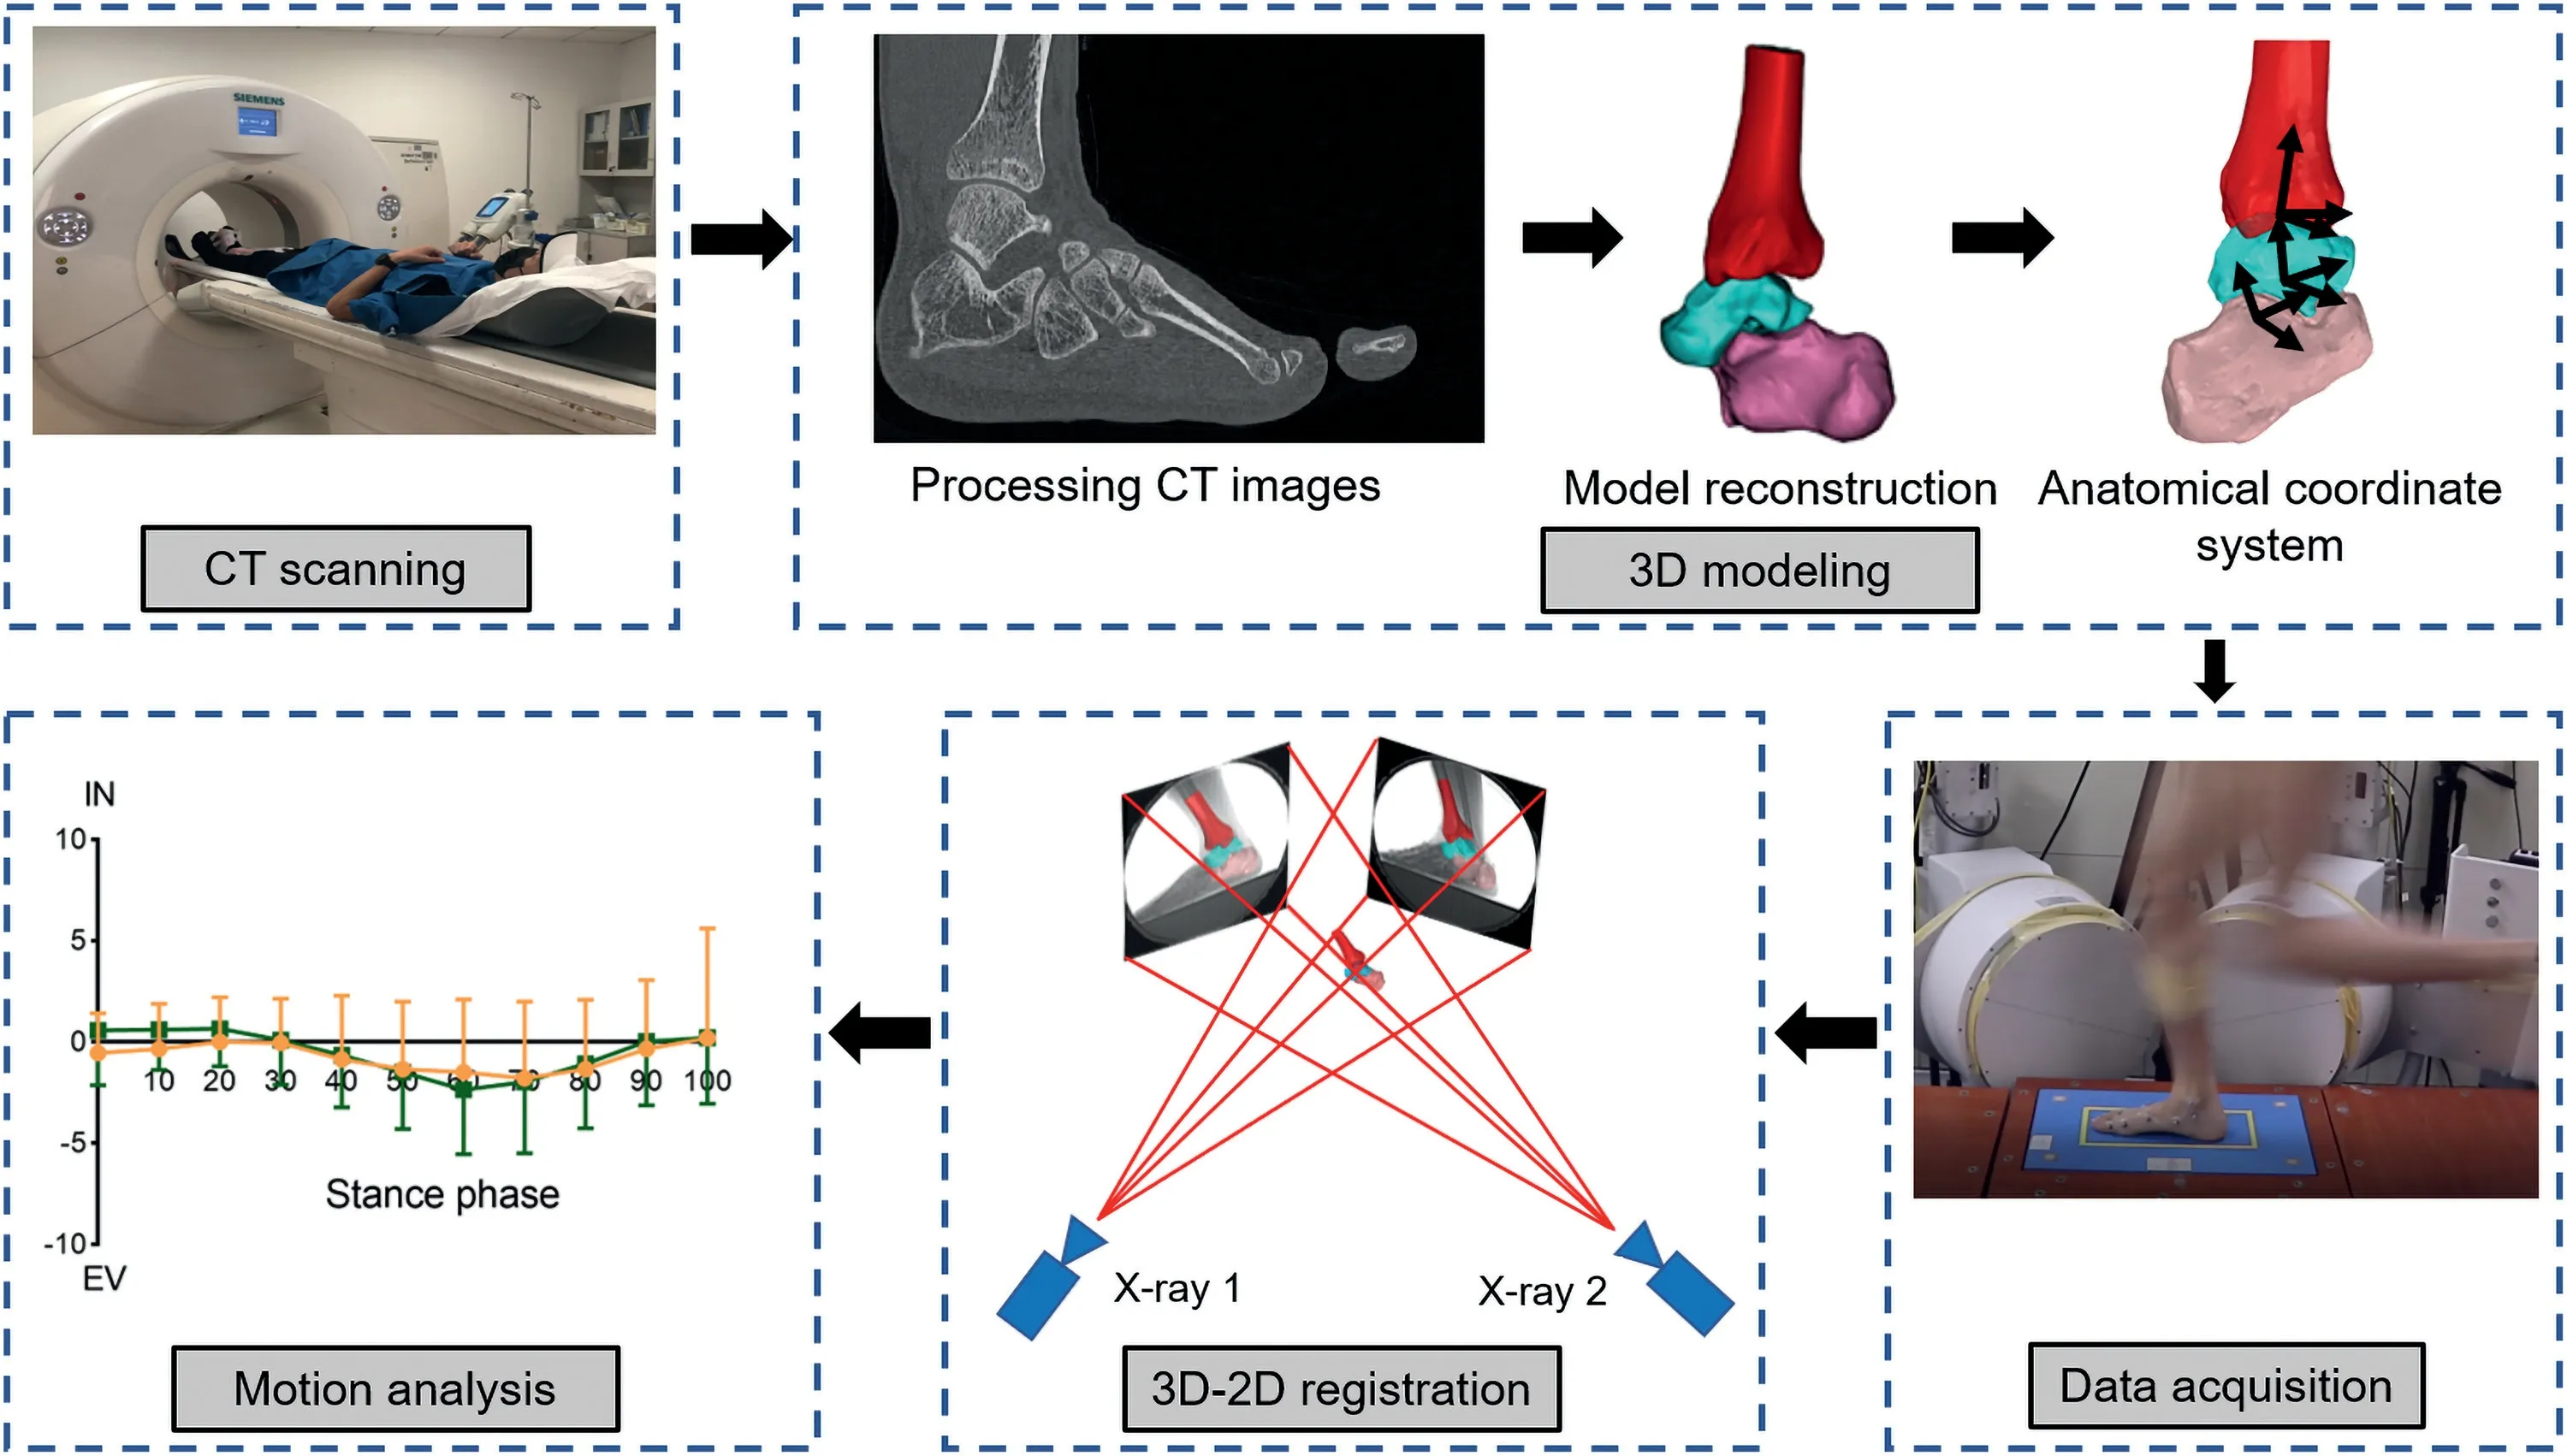
Fig.4.Data collection and process of high-speed dual fluoroscopic imaging system(DFIS)in the current study.EV=eversion;IN=inversion.
2.4.4.
The 6DOF kinematics of the tibiotalar joint were defined as the relative motions of the talus coordinate system with respect to the tibia coordinate system.The motion of the subtalar joint was defined as the calcaneus coordinate system with respect to the talus system.29Anterior/posterior,medial/lateral,and superior/inferior directions were aligned with the x,y,and z axes of the coordinate systems,respectively.31Dorsiflexion/plantarflexion,inversion/eversion,and internal rotation/external rotation were determined as rotations around the medial/lateral,anterior/posterior,and superior/inferior axes,respectively.According to the right-hand screw rule,the positive values represent anterior translation,lateral translation,superior translation,dorsiflexion,inversion,internal rotation,and the negative values correspond to the opposites.
2.5.Statistics
The mean and standard deviation for each variable were calculated.Paired samplettest was used to compare the 6DOF data (RoM,peak angle,and the data in increments of 10%stance) of the tibiotalar and subtalar joint under 2 conditions(SPSS,Version 25.0;IBM Corp.,Armonk,NY,USA).Bonferroni-Holm’s method was used to correct for significance.The effect size was determined using the Cohen’sd(small:0.20-0.49;medium: 0.50-0.79;large: >0.80).The a level was seta prioriat 0.05.
3.Results
3.1.Tibiotalar joint
3.1.1.Kinematic features
The tibiotalar joint showed subtle movement (<5 mm) in all 3 translational directions during the stance phase (Fig.5A,5B,5C).In joint rotation,a similar movement pattern was detected in the inversion/eversion of the tibiotalar joint between RFS and FFS.In the sagittal plane,the dorsiflexion of the tibiotalar joint decreased during 0%10% of the stance phase for RFS.The FFS was in a state of plantarflexion at touchdown and presented dorsiflexion of the tibiotalar joint in 10%60%of the stance phase(Fig.5D).Both patterns subsequently underwent plantarflexion,and the joint position changed from dorsiflexion to plantarflexion in the late stance(Fig.5D).In internal/external rotational movement,FFS showed greater internal rotation in 0%20% of the stance phase compared with RFS,which was in an external rotational state during 0%80% of the stance phase (Fig.5F).Both patterns changed the joint position from external to internal rotation in the late stance phase.
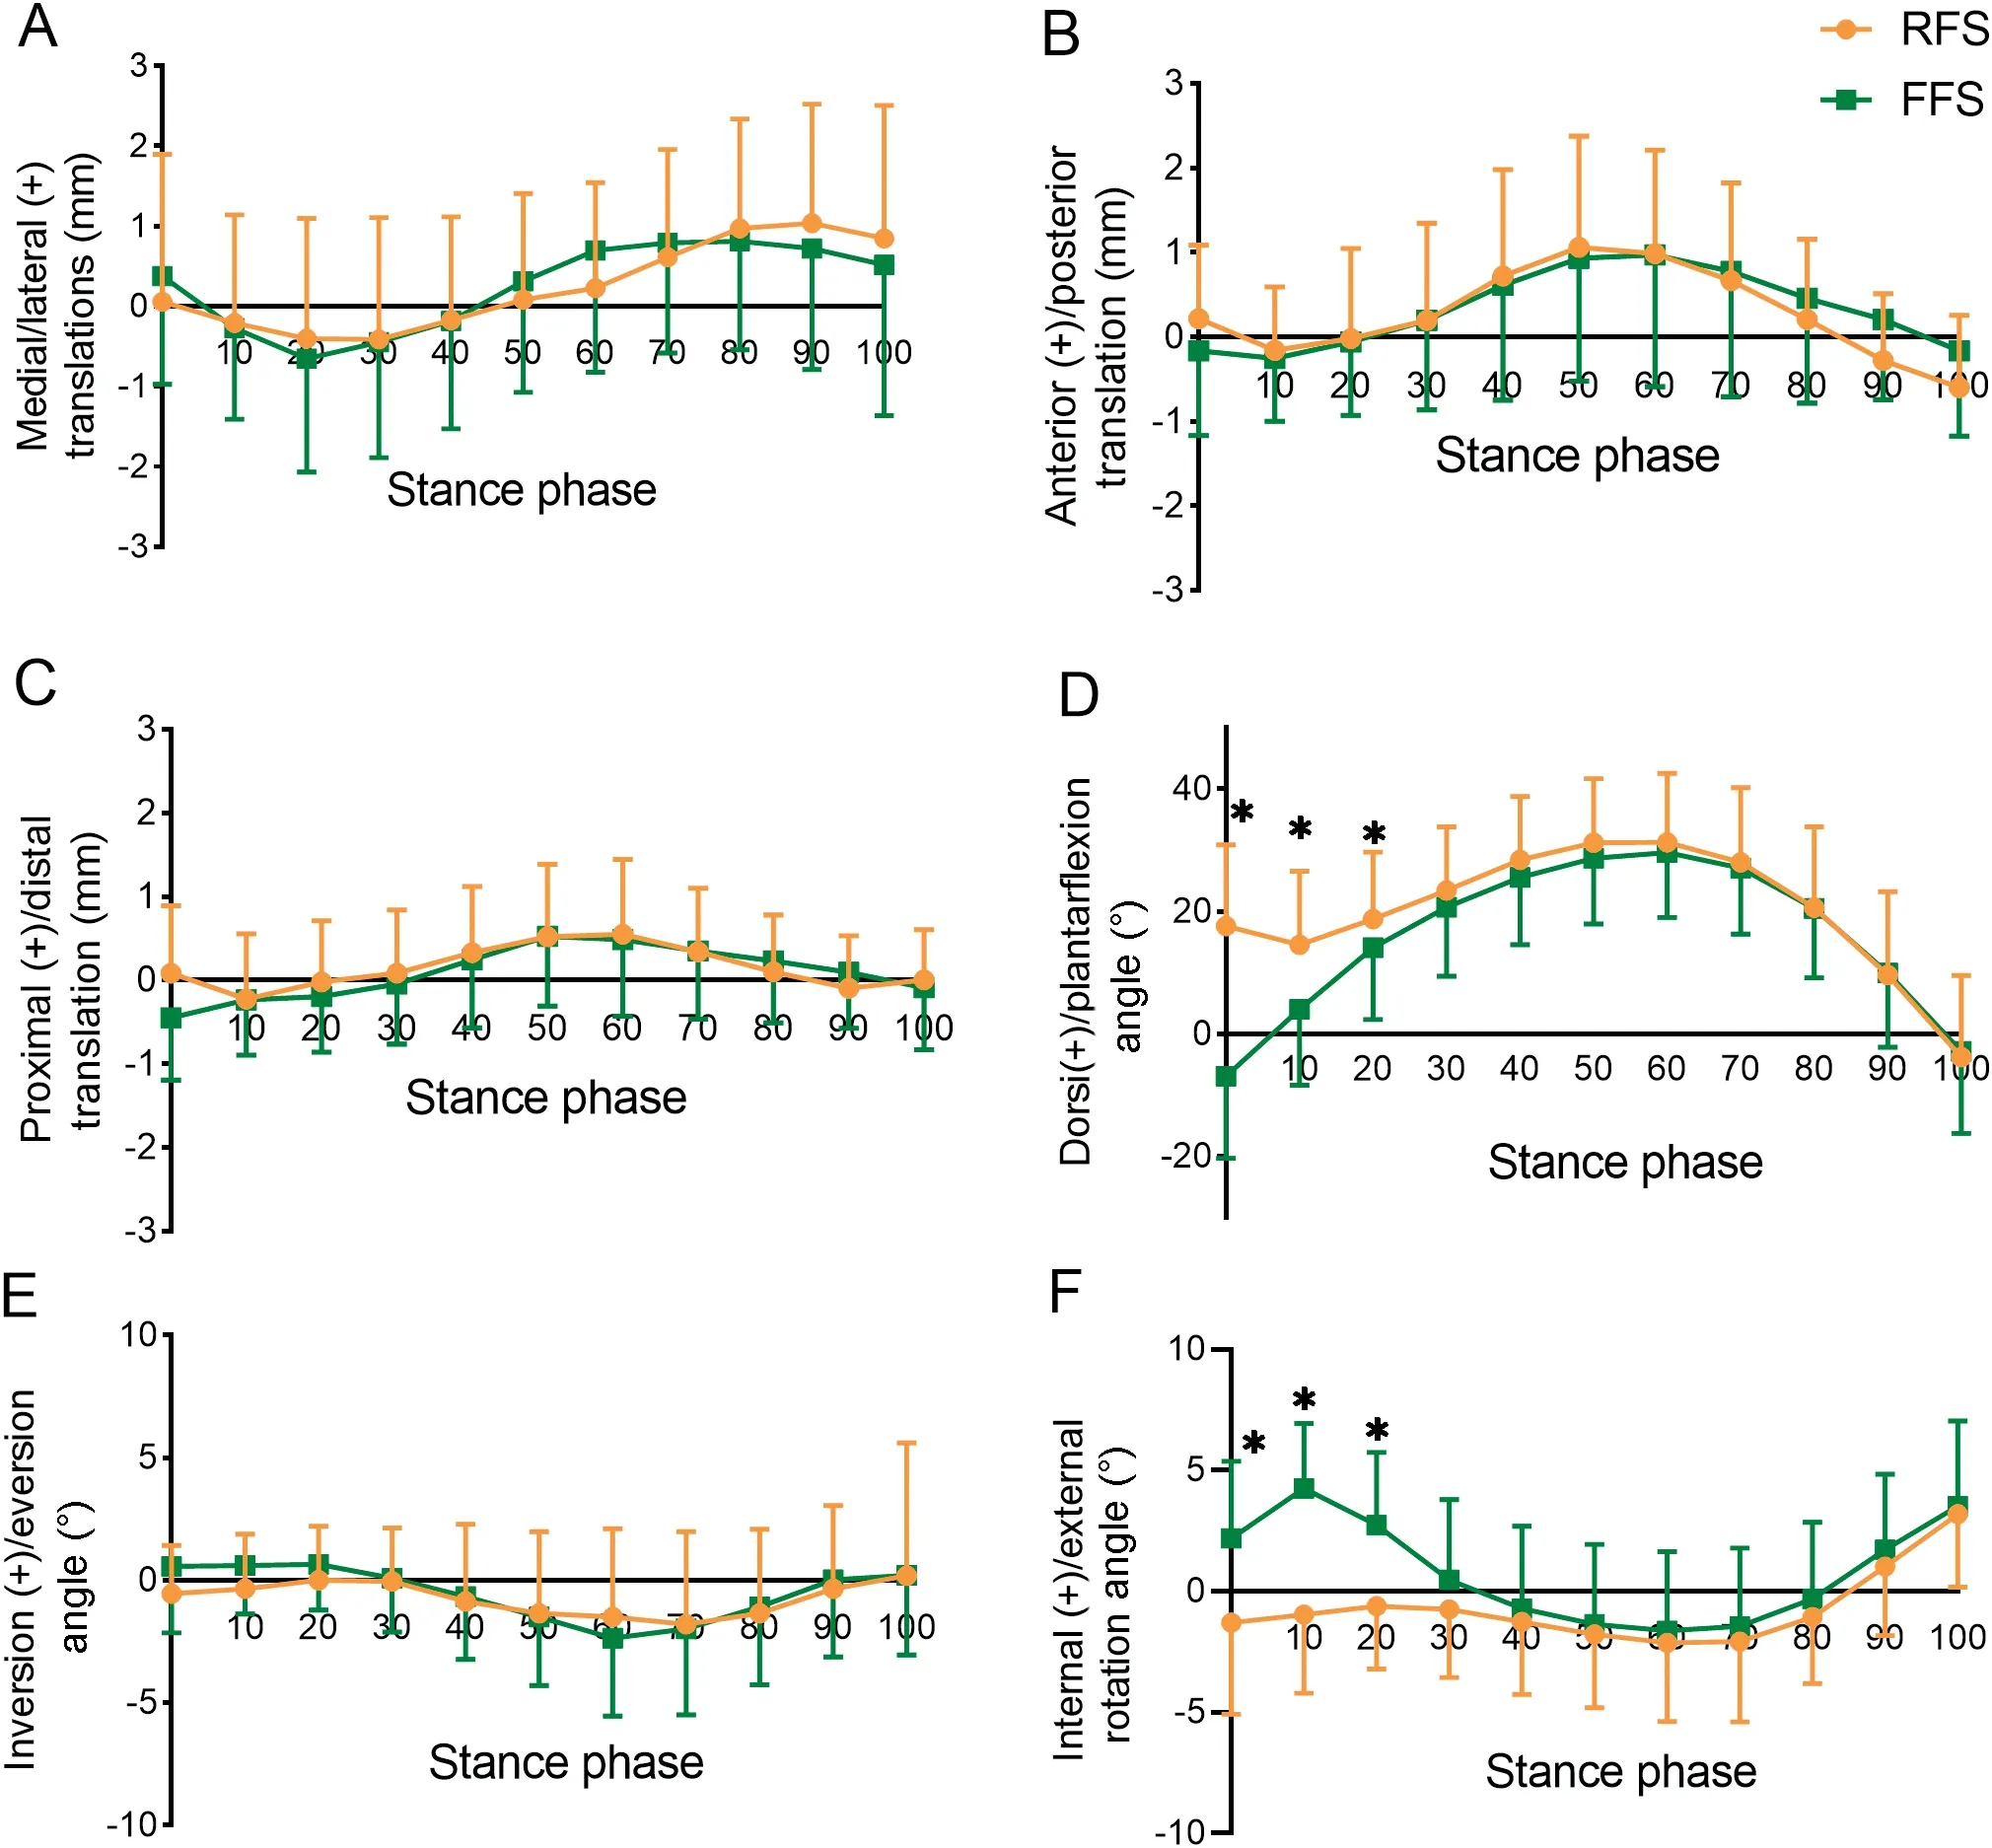
Fig.5.Six degrees of freedom kinematics of the tibiotalar joint during the stance phase.*p<0.05,compare with FFS;(+):positive value.FFS=forefoot strike pattern;RFS=rearfoot strike pattern.
3.1.2.Specific variables of joint motion
In the 6DOF RoM of the tibiotalar joint,no differences were observed between RFS and FFS (Table 1).At initial contact,RFS exhibited greater dorsiflexion(p<0.001,Cohen’sd=3.79)but less internal rotation(p=0.002,Cohen’sd=0.97)in the tibiotalar joint than FFS (Fig.5D,5F).Meanwhile,the peak internal rotation angle under FFS was greater than that under RFS(p<0.001,Cohen’sd=0.92)(Table 1).

Table 1 Peak angles and range of motion in 6 DOF of the tibiotalar and subtalar joint.
3.2.Subtalar joint
3.2.1.Kinematic features
Both patterns showed analogous movement patterns with a slight movement (<5 mm)in 3 translational directions during the stance phase(Fig.6A,6B,6C).In the sagittal plane movement of the subtalar joint,these 2 landing strategies underwent slight dorsiflexion from a near-neutral position and then returned to a near-neutral position in the late stance phase(Fig.6D).The inversion/eversion of the subtalar joint showed a similar pattern throughout the stance phase in RFS and FFS,with the subtalar joint moving toward extreme eversion and later performing inversion (Fig.6E).In internal/external rotational movement,FFS and RFS were in a state of external rotation throughout the stance phase and tended to internally rotate during 60%100% of the stance phase in the subtalar joint(Fig.6F).
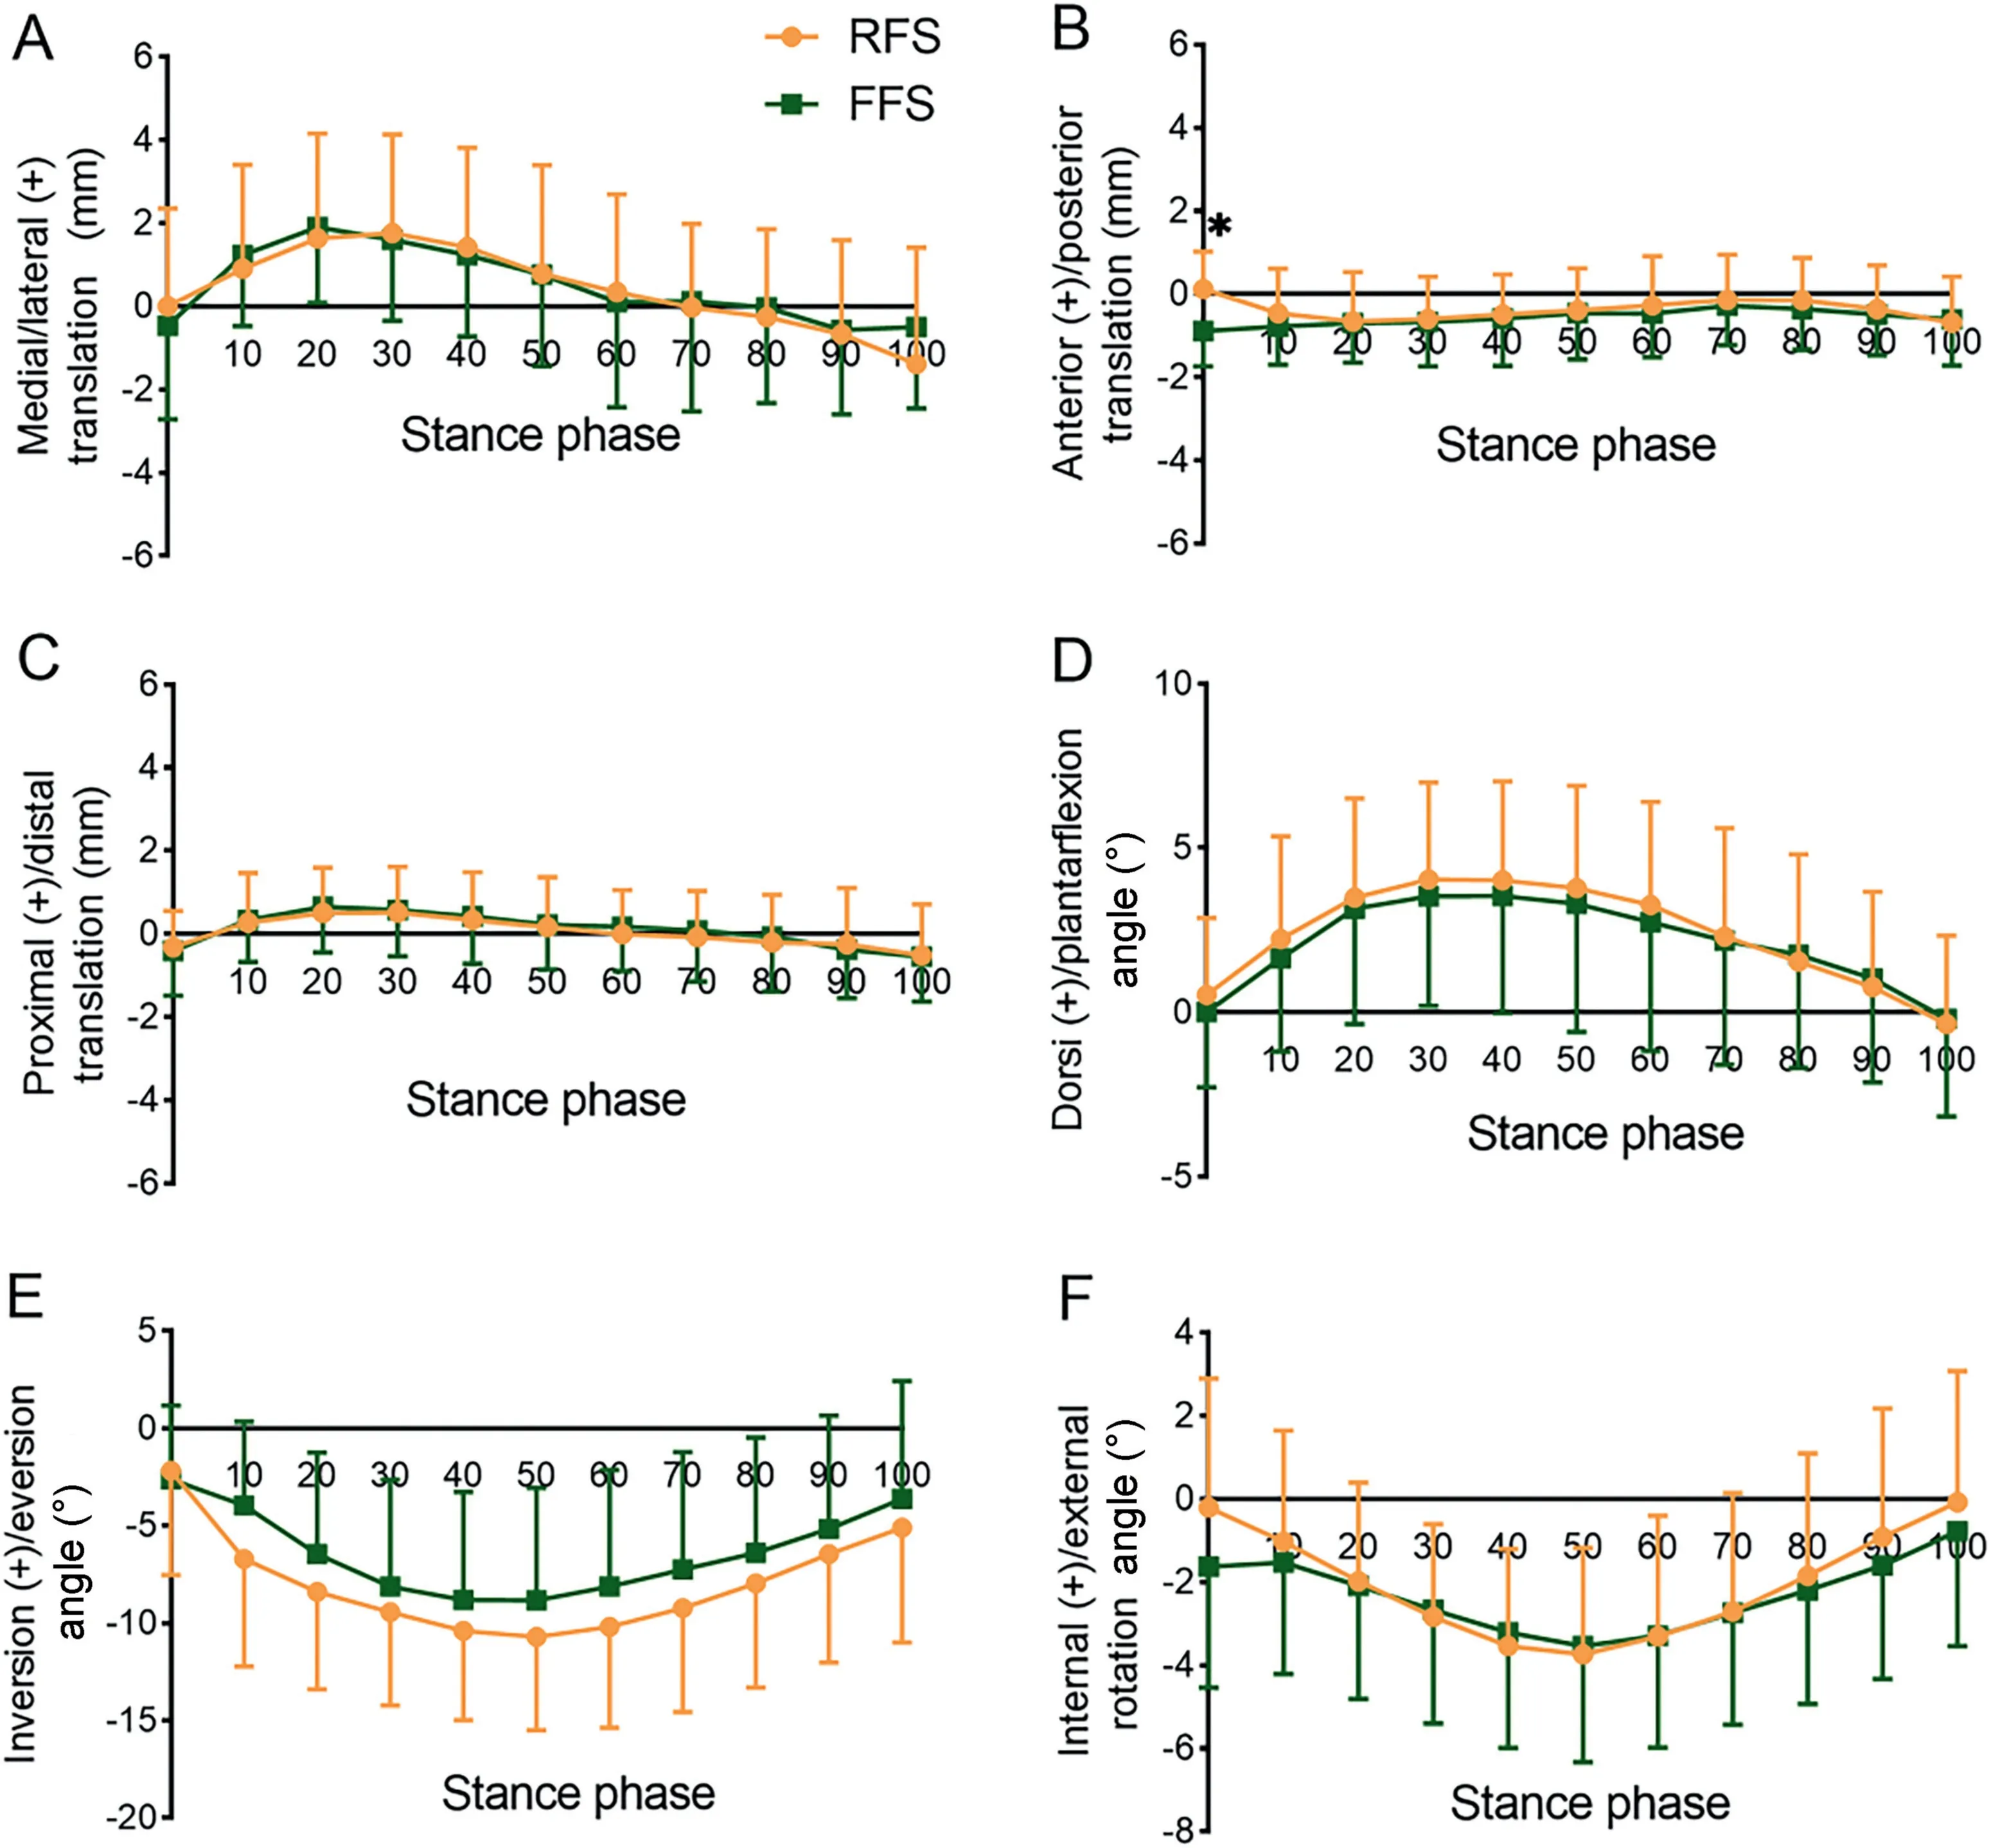
Fig.6.Six degrees of freedom kinematics of the subtalar joint during the stance phase.*p<0.05,compare with FFS;(+):positive value.FFS=forefoot strike pattern;RFS=rearfoot strike pattern.
3.2.2.Specific variables of joint motion
Table 1 shows that in the RoM and the peak angle in 6DOF of the subtalar joint,no significant differences were observed between RFS and FFS.At initial contact,however,RFS was more anteriorly translated than FFS (p<0.001,Cohen’sd=1.28)(Fig.6B).
4.Discussion
To the best of the authors’knowledge,this study is the first to use a high-speed DFIS to evaluate the effects of foot strike patterns on thein vivokinematics of the tibiotalar and subtalar joints.FFS performed greater internal rotation during 0%20% of the stance phase in the tibiotalar joint.The peak internal rotation angle of the tibiotalar joint under FFS was greater than that under RFS.Meanwhile,RFS showed more dorsiflexion at 0%20% of the stance phase than FFS.In summary,this study partially verified the hypothesis that there were significant differences in the RoM in 3 rotational directions between RFS and FFS.
4.1.Tibiotalar joint
In the kinematic features,the motion of dorsiflexion/plantarflexion obtained from the DFIS was consistent with that from the normal motion capture system.For example,the ankle was less dorsiflexed in FFS at initial contact than in RFS.12The RoMs in inversion/eversion(RFS=7.22˚2.37˚,FFS=6.74˚2.56˚)and internal/external rotation of the tibiotalar joint (RFS=7.47˚2.38˚,FFS=8.09˚3.07˚) were similar to those obtained in a bone-pin-based study(inversion/eversion=8.1˚3.8˚,internal/external rotation=7.8˚2.7˚).18In the internal/external rotational movement,the tibiotalar joint was internally rotated at the final stance;however,another DFIS research study did not observe the internal rotation at the last stance phase.17This difference can be attributed to the lower proportion of the whole stance phase recorded by 2 radiographic emitters in the previous study compared with that in the current work.As a result,the joint movement at the last stance phase was difficult to analyze.
FFS increased the internal rotation of the talus especially at 0%20%of the stance phase,and its maximal internal rotation was also greater than that of RFS.A clinical study focusing on patients with injury of the anterior talofibular ligament showed that the internal rotation of the tibiotalar joint increased by 5.7˚3.6˚in the injured ankle compared with the intact ankle.36In the current work,the internal rotation of the tibiotalar joint under FFS increased by 5.20˚2.35˚compared with RFS in 10% of the stance phase,and this finding was similar to that obtained in a previous study.36Runners with FFS may have excessive internal rotation of the tibiotalar joint in 10%of the stance phase,and the abnormal internal rotation may be associated with anterior talofibular ligament injury in runners.The acute transformation to FFS may cause the large internal rotation of the tibiotalar joint because the adaptability of the musculoskeletal and the neuromuscular system was limited in the present study.37Many running coaches have suggested that changing a runner’s foot strike pattern from RFS to FFS,whether barefoot or shod,may be a propitious way to improve performance and possibly reduce runningrelated injuries.38Nevertheless,the incidence of running injury has yet to decline.39On the basis of current findings,injuries may persist because of the sudden transformation of foot strike patterns,indicating that proper sequence and steady progress are crucial in FFS switching.40In addition,this study provides inspiration for shoe manufacturers to design minimal shoes (i.e.,to consider the excessive internal rotation of the tibiotalar joint.
4.2.Subtalar joint
No significant differences in the medial/lateral and superior/inferior translation for the subtalar joint were observed between RFS and FFS.The larger anterior translation of FFS compared with RFS at touchdown can be explained by their differences in the dorsiflexion/plantarflexion of the tibiotalar joint.At initial contact,the tibiotalar joint is dorsiflexed in RFS and plantarflexed in FFS,thus causing the talus to be posteriorly translated and the calcaneus relative to the talus to be anteriorly translated in RFS.
In the current work,the RoMs of the subtalar joint in the sagittal plane for RFS and FFS were 5.77˚1.26˚and 5.44˚2.58˚,respectively.In the transverse plane,the RoMs for RFS and FFS were 5.29˚3.32˚ and 3.42˚0.97˚,respectively.These results were similar to those obtained by a bone-pin study,in which the RoMs of the subtalar joint in the sagittal and transverse planes were 5.7˚1.8˚and 5.9˚2.0˚,respectively,during the stance phase of slow running(1.9-2.3 m/s) with habitual foot strike pattern.41And with respect to kinematic features,the motion trend of the subtalar joint in this study was similar to that in another DFIS research study for 3 rotational directions.17However,the motion amplitude was relatively large in all 3 rotational directions.This difference may be related to the running speed.In the previous study,the participants used a low,self-selected speed(1.5-2.0 m/s),whereas those in the current work ran through the platform at a high speed (2.85-3.15 m/s).As a result,the lower limb muscles are activated in response to the impact force at initial contact,thus creating a relatively large motion amplitude.42,43
Despite the fact that no significant differences were observed between RFS and FFS in the eversion of the subtalar joint,examining the effect of foot strike patterns on the eversion of the foot was insightful because the rearfoot eversion is among the factors affecting certain lower extremity and foot injuries.In particular,the malalignment of the rearfoot during stance with high loads placed on the triceps surae muscle/tendon unit from eccentric contraction and release was proposed as a mechanism that would ultimately result in Achilles tendon injury.4Becker et al.6demonstrated that high amounts of rearfoot eversion during the stance phase would increase strain in the tibialis posterior and soleus muscles and suggested that this may lead to the medial tibial stress syndrome.In the current work,the subtalar joint was numerically more everted in RFS than FFS almost throughout the stance phase.Given the above,the relatively small eversion in FFS may have a potential benefit regarding the prevention of certain lower extremities injuries,such as Achilles tendon injury and medial tibial stress syndrome.4,6In addition,the eversion of the hindfoot should be considered in designing running shoes suitable for RFS (i.e.,cushioned running shoes).44To the best of our knowledge,this work is the first to investigate the effects of foot strike patterns on a single subtalar joint via a high-speed DFIS.Given that most previous studies reported the advantages of FFS from the perspective of kinetics (e.g.,loading rate and vertical ground reaction forces),45-47the current research serves as motivation to use DFIS to investigate the potential strength of FFS in terms of the movement of the ankle joint complex,including the tibiotalar and subtalar joints.
No differences were observed in the internal/external rotation of the subtalar joint.However,the mean value of RoM in RFS was greater than that of FFS.This phenomenon may be related to the fact that running with RFS increases the first peak(impact peak),and greater RoM in internal/external rotation of the tibiotalar joint leads to more mechanical energy absorption,considering the natural response of the human foot to cushion and protect itself.
4.3.Limitations and future directions
In order to keep consistent and facilitate comparison with other studies using DFIS,the calculation of the tibiotalar and subtalar joint kinematics in the present study follows the same principle as that of previous studies;29,30thus,the joint kinematics in the present study may differ from other studies based on the anatomic orientation of the joint axes,such as the helical axis,because of the definition of the coordinate system.Therefore,direct comparison of the current results to those other studies should be done with caution.In addition,this work only focused on runners who suddenly switched their foot strike pattern from RFS to FFS.Thus,it failed to explore the kinematic characteristics of runners who habitually hit the ground with their forefoot.Future efforts should clarify the kinematics after prolonged adaptation to FFS.
5.Conclusion
Running with acute barefoot FFS increased the internal rotation of the tibiotalar joint in 0%20%of the stance phase.However,no statistical differences were observed between runners with RFS and FFS for 6DOF kinematics of the subtalar joint,except for the anterior translation at initial contact.Overall,the application of a high-speed DFIS to quantify the movement of the sub-joints (e.g.,the tibiotalar and subtalar joints) was of great importance for revealing the effects of RFS and FFS during running.
Acknowledgments
Funding was provided by the National Natural Science Foundation of China (Grants No.12272238 and No.11932013),the “Outstanding Young Scholar” Program of Shanghai Municipal,and the “Dawn” Program of Shanghai Education Commission(Grant No.19SG47).
Authors’contributions
WF conceived and designed the study;LL designed the experiments;DY performed the experiments and wrote the manuscript;SZ,SX,XS,and SW revised the manuscript.All authors have read and approved the final version of the manuscript,and agree with the order of presentation of the authors.
Competing interests
The authors declare that they have no competing interests.
 Journal of Sport and Health Science2024年1期
- Journal of Sport and Health Science的其它文章
- Commentary on“Speed and surface steepness affect internal tibial loading during running”
- Doseesponse associations,physical activity intensity and mortality risk:A narrative review
- A brief history of the Compendium of Physical Activities
- The 2024 Compendium of Physical Activities and its expansion
- Speed and surface steepness affect internal tibial loading during running
- COVID-19 vaccination produces exercise-responsive SARS-CoV-2 specific T-cells regardless of infection history