3D Radio Map Reconstruction and Trajectory Optimization for Cellular-Connected UAVs
Qiuhu Gong,Fahui Wu,Dingcheng Yang,Lin Xiao,Zemin Liu
Abstract—This paper introduces an innovative approach to address the trajectory optimization challenge for cellular-connected unmanned aerial vehicles (UAVs)operating in three-dimensional(3D)space.In most cases,optimizing UAV trajectories necessitates ensuring reliable network connectivity.However,achieving dependable connectivity in 3D space poses a significant challenge due to terrestrial base stations primarily designed for ground users.Additionally,UAVs possess network information only for the areas they have visited,with global network information being inaccessible.To address this issue,we propose a collaborative approach in which multiple UAVs create a global model of outage probability using federated learning,enabling more precise and effective trajectory design.Building upon the constructed global information,we conduct the trajectory design.Initially,we introduce A-star (A*) algorithm for trajectory design in small-scale scenarios.Nevertheless,recognizing the limitations of A* algorithm in large-scale scenarios,we further introduce improved rapidly-exploring random trees (RRTs) algorithm for weighted path optimization.Simulation results are provided to validate the effectiveness of the proposed algorithms.
Keywords—Cellular-connected UAVs,federated learning,improved RRT*,A*
I.INTRODUCTION
Unmanned aerial vehicles (UAVs) are characterized by their exceptional attributes,which include high mobility,portability,ease of deployment,and task versatility[1-3].These attributes enable UAVs to perform various functions in diverse settings,such as goods transportation,traffic management,and search and rescue operations[4].To execute their tasks efficiently and safely,UAVs require the establishment of real-time and reliable communication with ground control centers.Cellular networks provide a viable solution for enabling this communication,facilitating the emergence of cellular-connected UAVs.Using cellular networks as the infrastructure for UAV communication offers numerous advantages,such as cost savings and enhanced communication efficiency.Furthermore,the ongoing expansion of wireless cellular networks in terms of bandwidth and coverage is expected to drive further advancements in the development of cellularconnected UAVs.Despite these aforementioned benefits,certain issues arise when employing this approach.
The primary challenge is that UAV connectivity relies on ground-based stations (GBSs),which are primarily designed for terrestrial users.As a consequence,not all areas of the sky can receive reliable network service[5].Additionally,the location-dependent and time-varying characteristics of communication channels have a significant impact on the signal quality received by UAVs.Numerous studies have explored this issue.In Ref.[6],the authors employ a generalized Poisson multinomial (GPM) distribution to systematically model interference information.In Ref.[7],the author analyzes the performance of mobile cellular-connected UAVs under realistic antenna configurations.In Ref.[8],the author utilizes existing backhaul links between multiple GBSs that provide cellular network services to eliminate interference among the same channels.Moreover,the energy that UAV can carry is limited.Although the energy consumption for communication between the UAV and cellular GBS can be negligible,both fying and hovering require a substantial amount of energy for the UAV[9].This is critical for extending the UAV’s lifespan.In Ref.[10],the authors employ the deep reinforcement learning (DRL) method to minimize the total outage duration by allowing the UAV to interact multiple times with the environment on a two-dimensional(2D)radio map.Ref.[11]ensures the continuity of service for consumer-grade UAVs by using ground charging stations for energy replenishment operations.In Ref.[12],utilizing the signal-to-interference-plus-noise ratio(SINR)map,authors formulate the shortest path while adhering to the constraint of the specified minimum SINR,employing graph theory.To alleviate computational complexity,various suboptimal solutions are introduced.
To overcome these challenges,designing an appropriate trajectory for UAVs proves to be a cost-effective solution.Apart from ensuring network connectivity and communication quality for UAVs,various performance factors also need to be considered during task execution.Some tasks may require swift completion,making the optimization of fight time a key metric.Other tasks may demand stable communication links and low communication latency,necessitating the design of trajectories that ensure good network coverage and communication quality.Additionally,there are other task-specific performance indicators,including energy efficiency,accuracy,and safety considerations.To meet these performance requirements,it is necessary to consider multiple factors when designing trajectories.With well-designed trajectories,the relationship among different performance metrics can be balanced to achieve the optimal execution of tasks.Therefore,trajectory design plays a crucial role in ensuring multiple performance factors for UAVs.
Notation: Scalars are denoted by italic letters,vectors are denoted by bold-face lower-case letters,and‖·‖denotes the Euclidean norm of a vector.Sets are denoted by calligraphy letters,and|·|is the cardinality of a set.Pr{·}denotes the probability of the occurrence of the event,E[·]represents expectation operation.c(·) signifies the sample space of a random variable.
II.SYSTEM MODEL AND PROBLEM FORMULATION
A.System Model
We consider an urban area with dimensions ofD×Dsquare kilometers,characterized by numerous buildings and multiple GBSs.The density and height of the buildings are determined according to the guidelines provided by the International Telecommunication Union (ITU) recommendation document[13].The ITU document specifies three key parameters:αbd,βbd,andγbd,which respectively represent the proportion of building area to the total area,the average number of buildings per unit area,and the Rayleigh parameter with a mean value ofσbd.These parameters infuence the height distribution of the buildings,ensuring that the tallest building does not exceedzbdmeters.
The position of the UAV at timetis represented byq(t)=(x(t),y(t),z(t))∈R3,wherex(t)∈[0,D],y(t)∈[0,D],andz(t)∈[zmin,zmax]denote the range of the UAV’s fights.The inequality that should be satisfied iszbd<zmin≤z(t)≤zmax.In other words,UAVs will not hit any buildings during their fight.The initial position is denoted asqI=(xI,yI,zI),and the destination is denoted asqF=(xF,yF,zF).Therefore,q(0)=qIandq(T)=qF.
We consider a space that contains a total ofGGBSs with a height ofzbsmeters.Each GBS is equipped with three cells,resulting in a total ofM=3Gcells,denoted by the setM={1,2,3,···,M}.To model the path loss,we adopt the urban microcell(UMi)model specified in the 3rd Generation Partnership Project(3GPP)specifications[14].Depending on whether the line segment between the UAV and GBS is obstructed by buildings or not,we categorize the links as lineof-sight(LoS)or non-line-of-sight(NLoS).If no buildings are blocking the line segment,it is considered a LoS link.Otherwise,it is classified as an NLoS link.In our notation,the subscriptmrefers to themth cell.The path loss for the LoS link between the UAV and cellmcan be expressed in dB as follows.
The large-scale channel power gain at timet,denoted as(t),is primarily determined byq(t)in a given fixed scenario.This parameter plays a crucial role in establishing whether a LoS or NLoS link exists between the UAV and Cellm,in other words
We denotehm(t)as the channel power gain between the UAV and cellm,which is infuenced by factors such as GBS antenna gains,large-scale channel power gain,and small-scale fading.The received signal powerym(t)at the UAV from cellmat timetcan be represented as follows.
wherePmis the transmit power of cellm,β(t)and(t)denote the GBS antenna gain and the large-scale channel power gain.The small-scale fading,denoted by(t),is a random variable.
We assume that cellI(t)∈Mprovides service for the UAV at timet.The instantaneous SINR between the UAV and cellI(t)can be expressed as
whereyI(t)(t) denotes the signal power received by the UAV from the cellI(t),which is the cell that provides cellular network service to the UAV at timet.In this equation,m≠I(t)represents the signal power received by the UAV from cells that do not provide cellular network service to the UAV,andσ2is the noise power.
Clearly,outage probability can be considered as the probability of the SINR being less than a given threshold valueγth,this can be expressed as
The cellular connection is considered interrupted whenγ(t)is less than the outage thresholdγth.The small-scale fading between the UAV and cellI(t)is denoted by,and SINR is a function ofq(t).Therefore,we can rewrite the instantaneous SINRγ(t)asγ(q(t),I(t),).Considering a given outage thresholdγth,the outage indication functionc(t) can be expressed as follows.
Due to the presence of small-scale fading,c(q(t),I(t),is also a random variable.Clearly,this random variable follows a Bernoulli distribution,thus the interruption probability is equal to its mathematical expectation.The outage probability function in (6) can be expressed as the expectation of
To calculate the outage probability at each timet,we conductJtimes measurement of the SINR for each cell within a brief time interval.This process can be achieved by collecting continuous reports of reference signal received power(RSRP)and reference signal received quality(RSRQ)in practical applications.Thejth measurement of the small-scale fading is denoted as,the corresponding SINR and the outage indication function are denoted asγ(q(t),I(t),andc(q(t),I(t),.Mathematically,the empirical outage probability is expressed as
According to the law of large numbers,whenJis sufficiently large,the real outage probability can be replaced by the empirical outage probability.It can be expressed as
Obtaining the optimal connection strategy selected by the UAV atq(t) is straightforward.The connection strategy is implemented by selecting cellmfrom the set ofMcells,wheremcorresponds to the cell with the lowest empirical outage probability.This strategy can be expressed mathematically as
Based on the above analysis,it is possible to derive the expected outage probability of the UAV at some locations throughout its fight duration.With the local dataset,we employ federated learning approach to construct the coverage map across three-dimensional (3D) space.The constructed coverage probability map will be presented in section IV.
Tab.1 presents the main system model symbols along with their corresponding meanings.
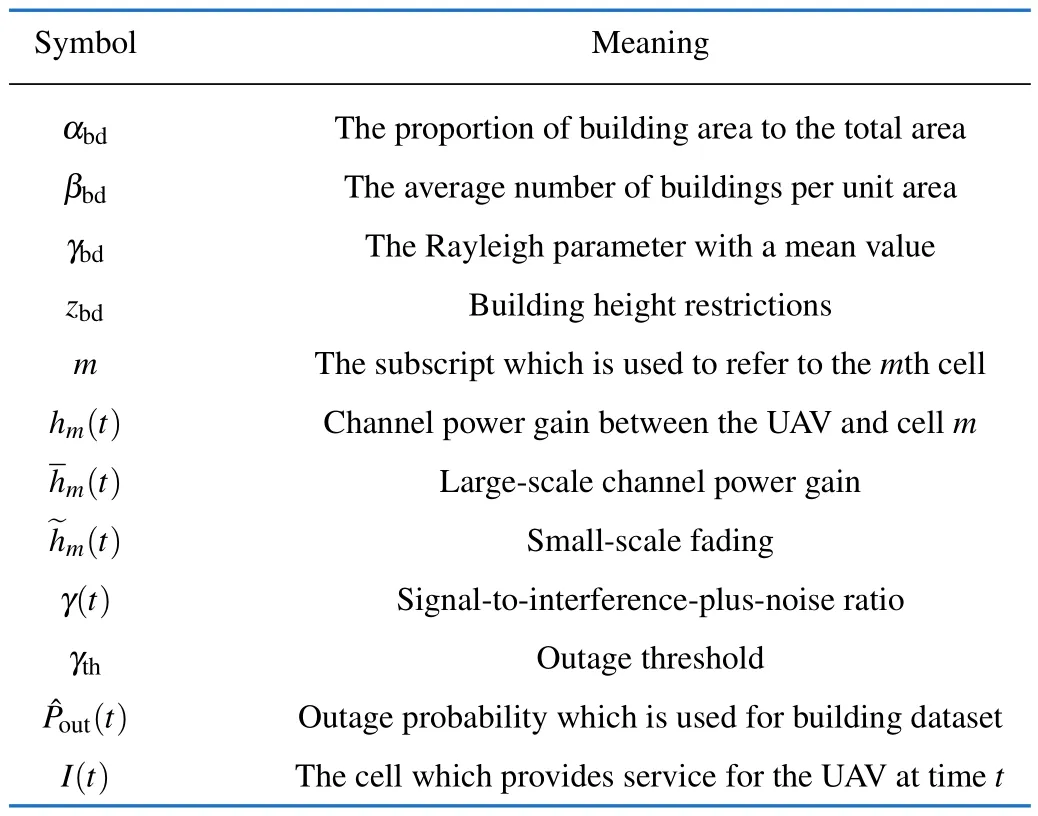
Tab.1 Main system model symbol
B.Problem Formulation and Reformulation
We define the expected outage duration as the integral ofPout(t)with respect to time.With the obtained outage probability map,we aim to achieve two objectives by designing the 3D trajectory of the UAV.
(1) Minimizing the fight durationTrequired to complete the entire task.
(2)Minimizing the expected outage duration.
To strike a balance between the fight time and the expected outage duration,we assign weights to each objective,enabling us to optimize the trajectory based on specific mission requirements.Thus,the optimization problem can be formulated as follows.
It is worth noting that the optimization problem can be tailored to different priorities by adjusting the weights assigned to the objectives.Specifically,whenµ1=0 andµ2=1,the problem aims to minimize the expected outage duration.Alternatively,whenµ1=1 andµ2=0,the problem focuses solely on minimizing the fight duration.In the case whereµ1=1 andµ2=1,the objective is to minimize the cumulative downtime of the UAV’s reliable connection,concurrently minimizing the overall fight duration.
To simplify the problem,we assume that the UAV maintains a constant velocityVduring fight.Consequently,the fying timetis solely determined by the fight distanceL.Under this assumption,the expected network outage duration can be expressed as the path integral ofPout(l)over the entire lengthL.The objective function can be modified as follows.
III.RADIO MAPPING AND PATH PLANNING
To address the reformulated problem (15),the initial step involves obtaining the outage probability for any given location within 3D space.This requires constructing a comprehensive 3D coverage probability map before engaging in path planning.
To accomplish this goal,we adopt the federated learning approach,which enables the estimate of outage probability in 3D space through collaborative efforts among multiple UAVs.Under the federated learning framework,each participating UAV uploads only its training parameters while keeping its original data private.This approach mitigates the risk of data theft and overcomes the limitation of coverage by a single UAV.With the availability of the constructed 3D radio map,providing insights into outage probabilities,effective path planning can be undertaken to optimize the UAV’s trajectory.
A.Radio Mapping Based on Federated Learning
Federated learning is a distributed machine learning approach that distinguishes itself by exchanging parameter models instead of directly sharing local data or samples to construct a global model[15].
The concept of federated learning was introduced by Google in 2016[16].Federated learning can generally be categorized into two types: horizontal federated learning and vertical federated learning.Horizontal federated learning utilizes horizontally partitioned data,where the feature space remains the same but the sample space differs.Vertically partitioned data maintains the same sample space but has different feature spaces.The training methods used in vertical federated learning differ significantly from those used in horizontal federated learning[17].In this paper,we specifically use the term “federated learning” to denote the horizontal federated learning method employed.
During the execution of specific tasks,UAVs can only fy over certain areas in 3D space and collect data that passes through those regions.In other words,these datasets contain only partial channel information from specific areas.Since federated learning is a distributed machine learning algorithm,the datasets used in federated learning must meet the criteria of being independent and identically distributed (IID).In Ref.[18],the authors demonstrate that non-IID datasets can lead to a decrease in the accuracy of federated learning methods.Compared to centralized training through servers,federated learning offers significant privacy advantages.In this algorithm,data itself is not transmitted through the servers;Instead,only the global neural network parameters,which contain minimal private information,are transmitted over the network.This approach ensures a high level of security.
To simulate global outage information for the entire fight space,we employ a neural network with parametersθ.The network takesq(x,y,z)∈R3as input,and the outputP(θ,q(x,y,z))representing the outage probability at the given positionq(x,y,z).In our approach,we utilize the mean squared error (MSE) as the loss function,instead of crossentropy.The MSE is expressed as
whereqcis thecth data point,Pcis the label of thecth data point,andP(θ,qc)denotes the output of neural network.Minimizing the loss function implies finding a parameterθthat makes the output of the neural networkP(θ,qc) close to the labelPc.The objective is not only to minimize the loss function for individual data points but also minimize it for the entire dataset.We have
whereF(θ)can be written as
The dataset or data samples are not shared among UAVs.Therefore,the loss function value on theuth UAV’s datasetDucan be defined as follows.
whereqdis thedth data point.Hence,the value of the loss function on the datasetDcan be expressed as
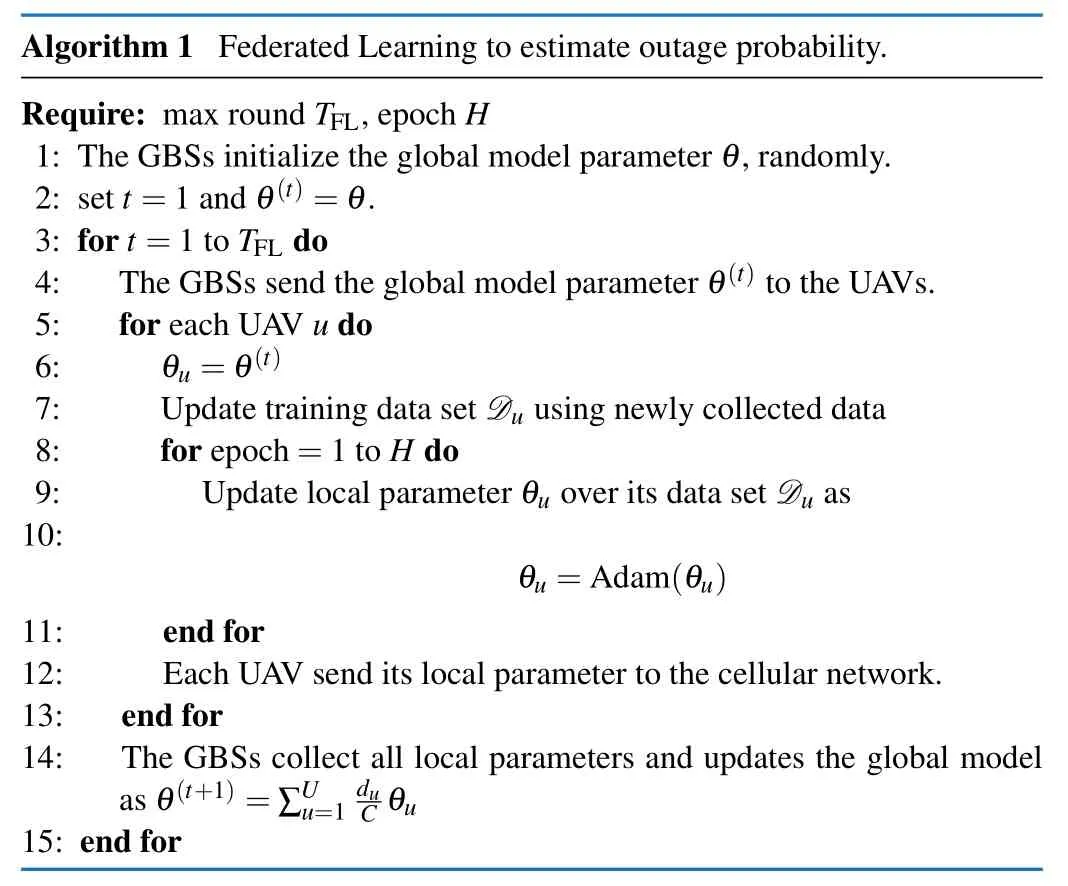
Due to the complexity of the neural network,achieving significant loss reduction in a short period using stochastic gradient descent(SGD)alone is a challenge.Therefore,we employ the adaptive moment estimation (Adam) algorithm[19]to update the parameterθ.This algorithm,known for its sophistication,brings several advantages to the optimization process.Notably,it demonstrates superior performance in terms of low memory requirements and high computational efficiency compared to traditional optimization algorithms.
Once the UAVs have trained their local models using their respective datasets,they upload their updated model parameters to GBSs.GBSs then handle the model parameters by
We update the parameters of the global model using the method mentioned above.The updated parameters are sent back to all UAVs,and the local updates are performed again using additional data.This process is repeated until the neural network is fully updated.The algorithm only requires sharing model parameters without sharing data,thereby improving training efficiency.Algorithm 1 outlines the entire training process of federated learning.
B.A*Algorithm
A-star(A*)algorithm is a widely used and efficient method for finding the shortest path in a static road model[20].It extends the Dijkstra’s algorithm and incorporates a heuristic function to guide the search process.By considering both the cost from the starting point to the current location and the estimate of the cost from the current location to the goal point,A*algorithm determines the most optimal path.Mathematically,the algorithm can be expressed as
wheret(n)is the actual cost from the start point to the current point,h(n)is the estimated cost from the current point to the goal point.
The choice of an appropriate heuristic function is crucial as it greatly infuences the search strategy of the algorithm and ultimately affects the planning result.If the heuristic function always returns 0,A*algorithm is equivalent to Dijkstra’s algorithm,thus ensuring that the optimal path is found.Conversely,as the estimated cost approaches the actual cost,the computation speed increases.However,if the estimated cost exceeds the actual cost,A*algorithm cannot guarantee the attainment of an optimal solution but can provide exceptionally fast execution.Therefore,the selection of a suitable heuristic function is crucial as it directly impacts the pathfinding strategy of A*algorithm.
Based on the analysis above,the ideal heuristic function would always be equivalent to the actual cost.However,due to the uneven distribution of reliable networks,finding such a heuristic function is extremely challenging.Therefore,we compromise on the computational speed,under the condition that the parameterµ1is non-zero,select a heuristic function,such as the Euclidean distance,that enables the estimated cost to be as close as possible to the actual cost.Since the objective function includes the expected network interruption time,the estimated cost will always be lower than the actual cost whenµ1≠0.As a result,this algorithm can achieve the same effect as Dijkstra’s algorithm while significantly reducing the computation time.In the case where the parameterµ1is equal to 0,the Euclidean distance is much greater than the actual path cost,thus making it impossible to obtain the optimal solution.In this scenario,the choice of the weighted Euclidean distance as the heuristic function is motivated by its ability to better approximate the actual path cost compared to the standard Euclidean distance.The incorporation of weights in the distance calculation enables a more accurate representation of the real-world terrain or network conditions.While enhancing accuracy,albeit at the cost of optimality,it expedites the acquisition of an approximate solution,aligning with the objective of balancing computational efficiency with solution quality in pathfinding.
Both A* algorithm and Dijkstra’s algorithm require the construction of a raster grid,involving the division of the entire 3D space into a series of adjacent grid points.In our case,we assume that a UAV has 26 possible directions to move,and the UAV can take steps of three different lengths:Δ,Compared to Dijkstra’s algorithm,A* algorithm offers significant advantages in medium-scale scenarios.In this study,we further optimize both the A*and Dijkstra’s algorithms for comparison purposes by implementing a Priority Queue,resulting in a lower time complexity.
C.Improved RRT*Algorithm
RRT*algorithm is a modified version of rapidly-exploring random trees (RRTs) algorithm[21],which is a typical and rapid sampling algorithm for searching non-convex spaces.RRT*algorithm is specifically designed to efficiently find the shortest path between an initial and final location through a sufficient number of iterations.However,the primary drawback of RRT*algorithm is that it focuses solely on finding the shortest path without considering trade-offs.To address this limitation,we propose an improved version of RRT* algorithm,which strikes a balance between path quality and computation time.
We implement the algorithm using a tree structure,which provides a convenient representation of the path.The tree,denoted asT=(V,E),depicts the path between the start point and any intermediate point.Clearly,the root of the tree is the start pointqI.The setVrepresents all the points explored by the algorithm.The setEcomprises the edges (qp,qcur) that have been explored.
If a pointqcuris directly connected to another pointqpand can be reached by traversing throughqpfrom the root pointqI,thenqpis referred to as the parent point ofqcur.
In this algorithm,we define the functionw(qa,qb) to represent the weighted Euclidean distance between two points as follows.
We assume that the algorithm need traverse a set of points{q1,q2,···,qn-1} from the initial pointqI=q0to the pointqn.Accordingly,the functionW(qn)can be expressed as
Algorithm 2 presents improved RRT*algorithm procedure for the UAVs.
IV.SIMULATION RESULTS
In this section,we present the simulation results evaluating the performance of the proposed algorithm.The objective function is defined with parameter valuesµ1=1 andµ2=1.The simulation is conducted in a 600 m×600 m area with parametersαbd=0.3,βbd=300,σbd=20,and a building height limit ofzbd=45 m.
The positions of the GBSs and buildings are illustrated in Fig.1(a) and Fig.1(b).All GBSs have a height denoted aszbs=10 m,while the UAVs are constrained to fy at altitudes between 60 m and 100 m.

Fig.1 Simulation scenario and a trained outage probability map of 80 m height: (a)position of buildings and GBSs;(b)3D view of buildings and GBSs;(c)outage probability of 80 m by FL
Each cell’s transmit powerPmis set to 20 dBw at a carrier frequency of 2 GHz.The Rician fading factor,KR,is designated as 15 dB for LoS channels.Additionally,the outage SINR threshold,γth,is established at 3 dB.

In our algorithm,we utilize a fully-connected neural network comprising three hidden layers and an output layer.The activation function for the hidden layers is rectified linear unit(ReLU),and the output layer employs the softmax function.For the second-step algorithm,the step size for all the algorithms is fixed atΔ=2 m,and the number of measurement is set toJ=1 000.
By leveraging federated learning,we can estimate the outage probability at any given position,enabling the generation of a comprehensive 3D radio map.Due to space constraints,we don’t provide all the outage probability maps for different heights.However,in Fig.1(c),we present the coverage probability at height of 80 m,which represents one of the trained results.It is evident from the figure that ensuring a reliable network connection with GBSs at all times in the sky is challenging.Therefore,to minimize time of fight and network disconnection,planning an appropriate 3D trajectory is crucial.
Fig.2(a) displays the planned 3D trajectories using Dijkstra’s,A*,and improved RRT* algorithms.The corresponding network disconnect probabilities at various altitudes are provided,offering insights into the advantages and disadvantages of each algorithm.This analysis contributes to a comprehensive evaluation of their performance.
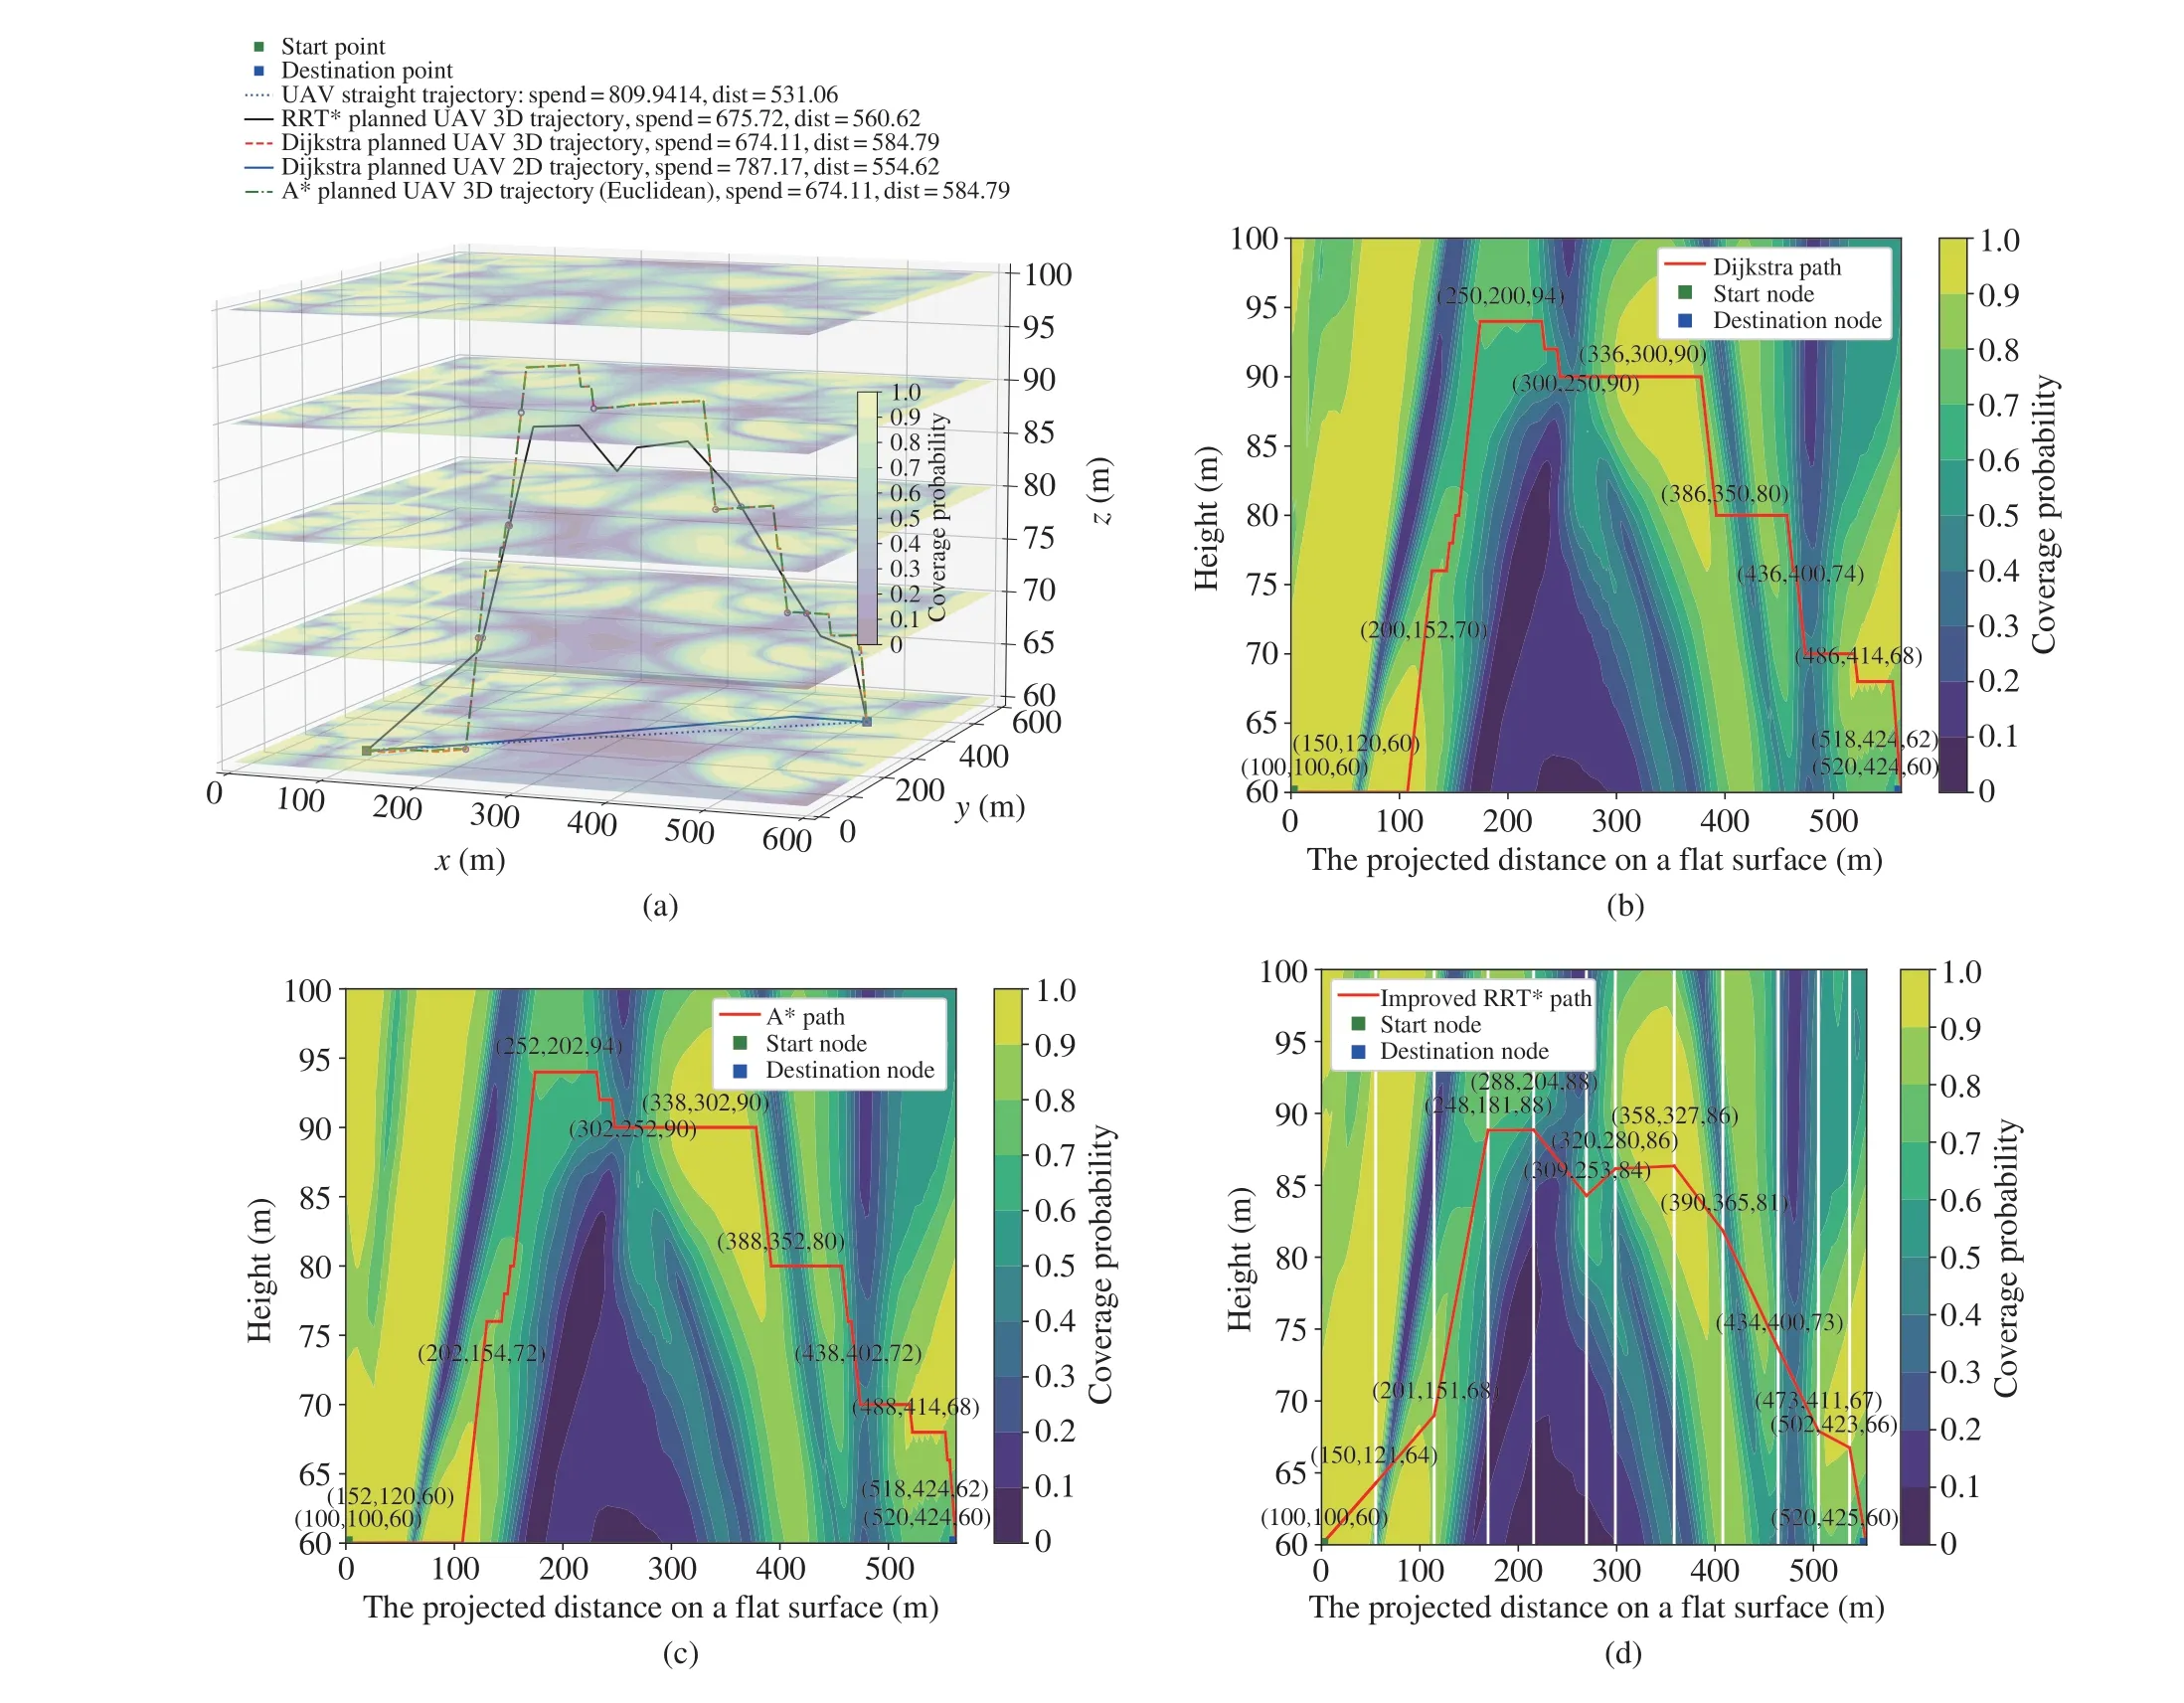
Fig.2 3D trajectory and the outage probability of the vertical plane on where the subpath is located whenµ1=1,µ2=1: (a)planned trajectory in 3D space;(b)Dijkstra’s algorithm used for comparing;(c)A*algorithm;(d)improved RRT*
While we have the capability to generate radio maps for any plane in 3D space based on predictions obtained from federated learning,we specifically illustrate the distribution of reliable network connections in 3D space by depicting radio maps of horizontal planes at heights of 60 m,70 m,80 m,90 m,and 100 m in Fig.2(a)as references for assessing the algorithm’s effectiveness.Upon examining cross-sectional slices of the 3D radio map at varying altitudes,it becomes evident how different heights can significantly infuence the distribution of reliable cellular network signals.Moreover,these crosssectional slices of the radio map at different altitudes help us assess the effectiveness of the planning algorithms.
In Fig.2(a),we present the fight duration cost and the objective function cost(i.e.,the weighted sum of fight duration and network interruption duration)for the planning results of each algorithm.This dual evaluation provides a comprehensive understanding of the trade-offs and efficiencies offered by each planning algorithm.It is evident that the 3D trajectory outperforms the 2D trajectory due to the consideration of cellular network topology.A straight trajectory may lead to the shortest fight time but also prolonged expected outage duration.
Moreover,both A*algorithm and Dijkstra’s algorithm employ the same planning strategy for 3D paths.Although there are slight differences in the resulting paths,both algorithms yield identical path costs.When the parameters in the objective function are set to 1,A* algorithm achieves the optimal solution while saving nearly half of the computation time compared to Dijkstra’s algorithm.
Furthermore,improved RRT* algorithm produces paths that differ from those of Dijkstra’s algorithm.Due to its random sampling characteristic,the lengths of the subpaths generated by this algorithm are not fixed,and the resulting paths are not necessarily optimal.However,RRT* algorithm follows a similar strategy to the optimal solution algorithm,optimizing the interruption time cost without significantly increasing the fight time cost.By considering Fig.2,we can observe that the reliability of the cellular network along the planned paths from improved RRT* algorithm is inferior to that achieved by the optimal solution algorithm.However,the length of the planned path is smaller than that of the optimal solution algorithm.As a result,despite significant differences in the planned results,the objective costs of the two algorithms are very close.
It should be noted that in this small-scale scenario,if a highly optimal solution is required,improved RRT*algorithm does not have an advantage over A* algorithm.The algorithmic results presented in this paper for this scale are solely intended to demonstrate the effectiveness of the proposed algorithm.Certainly,improved RRT* algorithm can approach the optimal solution with an increasing number of iterations,the benefits gained from this approach may not justify the associated costs.
Fig.2(b)-2(d) depict the stitched map of 2D outage probability,comprised of vertical planes representing the planned path.These maps offer insights into the quality of the planned paths in the vertical direction.Drawing connected probability at all positions in the sky is challenging due to potential blockages caused by other points.Therefore,the stitched map is presented as an alternative.Analysis of these figures reveals that the planned path,constructed by improved RRT*algorithm,exhibits nearly identical outage probabilities.The vertical axis represents the height of the planning space,while the horizontal axis represents the projected length of the path on the horizontal plane.Furthermore,whenµ1=1 andµ2=1 in the objective function,A*demonstrates performance similar to Dijkstra’s algorithm.It is worth noting that improved RRT* algorithm,known for its optimal characteristic,does not have a fixed length for the planned subpaths.
Fig.3 illustrates the average loss of federated learning and the objective function across iterations using improved RRT*algorithm.Fig.3(a)displays the average loss per round during the model parameter averaging process in federated learning at the base station.Due to the shuffing of data during federated learning training,the loss exhibits some fuctuations.However,it is observable that as the number of rounds increases,the loss function tends to converge,indicating the effectiveness of the federated learning training data.Fig.3(b)depicts the convergence process of the objective function(15)during the execution of improved RRT* algorithm.The left scale corresponds to the weighted sum of the cost distance and the actual distance of the path,while the right scale corresponds to the fight time cost of decreasing the expected outage duration by one second.Due to the characteristics of improved RRT*algorithm,the objective function is a monotonically decreasing function during execution.The parent node of a certain node is updated only when a weighted path resulting in a shorter objective function value is found during the algorithm’s resampling process.Hence,the red line is used to illustrate the effectiveness of improved RRT*algorithm.The blue line represents the variation in the actual length of the paths found as the number of iterations increases.Due to the fact that the actual length is not the optimization target,some fuctuations may be present.The green line means the fight time cost of decreasing the expected outage duration by one second.

Fig.3 Algorithm convergence process: (a)federated learning loss;(b)object of improved RRT*
Furthermore,simulation results are presented in Fig.4 for the objective function withµ1=0 andµ2=1.When the optimization objective is to minimize network interruption duration,the reliable cellular network interruption duration is equivalent to the product of the planned path length and the probability of connectivity disruption in the path’s coverage area.In this case,the impact of the connectivity disruption probability in the path’s coverage area on the objective result is much greater than the impact of the path length.Therefore,theoretically,the planned path length in this case will be much longer than when the objective is set asµ1=1 andµ2=1.
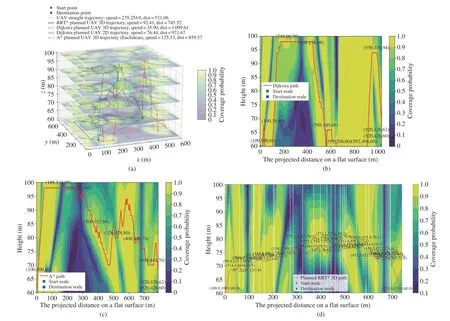
Fig.4 3D trajectory and the outage probability of the vertical plane on where the subpath is located whenµ1=0,µ2=1: (a)planned trajectory in 3D space;(b)Dijkstra’s algorithm used for comparing;(c)A*algorithm;(d)improved RRT*
In such a scenario,the algorithm proposed in this paper proactively searches for the most reliable areas along the path from the starting location to the destination.This process results in the formation of a pathway that effectively circumvents the challenge of being unable to find a path in regions characterized by extremely poor network conditions,as previously discussed in Ref.[13].
Due to the objective function withµ1=0 andµ2=1,which exclusively considers the network interruption time,A*algorithm faces challenges in obtaining the optimal solution.This is attributed to the fact that,in this particular scenario,the heuristic function estimate consistently surpasses the actual value.As mentioned earlier,the impact of this discrepancy between the heuristic function estimate and the true value on the efficacy of A* algorithm leads to relatively suboptimal path results within a brief timeframe.
To enhance planning outcomes,it becomes inappropriate to persist with the use of the Euclidean distance as the heuristic function.Instead,we adopt a weighted Euclidean distance,specifically aligned with the objective function,as the new heuristic function.The weighted Euclidean distance incorporates the probability of connectivity disruption for weighting.Although its estimate remains higher than the true value,thus hindering the attainment of the optimal solution,it is closer to the actual value compared to the Euclidean distance.Consequently,through increased computational time investment,superior approximate solutions can be obtained.
Fig.4(a)illustrates the trajectories of various algorithms in 3D space.It is evident that each algorithm generates paths with significant differences,which are notably more intricate than the paths considering both UAVs’fight duration and the expected network interruption duration.Fig.4(b)-4(d) provide a detailed representation of the performance of the algorithms proposed in this paper.
Tab.2 presents the computational time and cost of planning results for different scenarios when the objective parameters are set asµ1=1 andµ2=1.Observing the table,it becomes evident that,when considering both drone fight time and expected network interruption time,A* algorithm,in comparison to the classical Dijkstra’s algorithm,can save nearly half of the computational time while still obtaining the optimal path.Furthermore,owing to the typical hardware limitations of drones in terms of memory size and computational power,Dijkstra’s algorithm fails to complete planning tasks in certain medium-scale scenarios,whereas A*algorithm can accomplish them within an extended computational time.

Tab.2 Comparison of computation time and effectiveness of various algorithms under different planning scales
However,as the computational scale increases,even A*algorithm becomes inadequate.In such cases,only improved RRT* algorithm can complete the task.This is attributed to the differing internal mechanisms of the two algorithms.The improved RRT*algorithm,benefiting from its stochastic sampling feature,can complete planning tasks with lower memory consumption,thereby avoiding the memory explosion issues experienced by A*and Dijkstra’s algorithms.With improved RRT* algorithm,we can adjust the iteration count to determine the quality of the planning results.
V.CONCLUSION
This paper presents a comprehensive approach to optimizing trajectories for cellular-connected UAVs in 3D space,balancing fight time and expected outage duration.It employs collaborative federated learning to construct a global model for outage probability and radio maps,using A* for optimal solutions in smaller scenarios and improved RRT*for largerscale planning.When prioritizing the expected outage duration,A* algorithm with Euclidean distance is faster,but in other cases,the choice depends on optimization goals and planning scales.
 Journal of Communications and Information Networks2023年4期
- Journal of Communications and Information Networks的其它文章
- Deep Learning-Assisted OFDM Detection with Hardware Impairments
- Full-Duplex Cooperative Relaying with Non-Linear Energy Harvesting for Vehicular Communication
- Ultra-Wideband Millimeter-Wave Vortex Beam Generation Based on Refective Pancharatnam-Berry Phase Metasurface
- A Model-Driven Approach to Enhance Faster-than-Nyquist Signaling over Nonlinear Channels
- Coverage in Cooperative LEO Satellite Networks
- Resource Allocation for URLLC with Parameter Generation Network
