
Rural transformation, income growth, and poverty reduction by region in China in the past four decades
2023-12-14 12:43:38SHIPengfeiHUANGJikun
Journal of Integrative Agriculture 2023年12期
SHI Peng-fei , HUANG Ji-kun
1 China Center for Agricultural Policy, School of Advanced Agricultural Sciences, Peking University, Beijing 100871, P.R.China
2 Research Center for Rural Economy, Ministry of Agriculture and Rural Affairs, Beijing 100810, P.R.China
Abstract China has experienced rapid rural transformation in the past four decades.Accompanying the rapid transformation is a significant rise in rural household income and a substantial fall in rural poverty.This paper examines the evolutions of and the relationships between rural transformation (high-value agriculture and rural non-farm employment) and its outcomes (per capita rural income and rural poverty incidence) using provincial-level data.The results show that 31 provinces/autonomous regions/municipalities have undergone significant rural transformation, but the level and speed of rural transformation differed considerably.Moreover, an increased level of rural transformation is often associated with higher per capita rural income and reduced rural poverty incidence.Notably, a category of provincial rural transformation based on high-value agriculture and rural non-farm employment is also analyzed.We further discuss the likely impacts of institutions, policies, and investments (IPIs) on rural transformation and conclude with policy implications.
Keywords: rural transformation, high-value agriculture, non-farm employment, income, poverty, China
1.Introduction
China has witnessed rapid agricultural growth and rural transformation since the initiation of the reform and opening-up policy in 1978.Over the past four decades,agricultural output value grew at the annual rate of 5.4%in real terms.While grain production has increased steadily, other crops, particularly horticultural crops, have experienced much faster growth (NBSC 2020).Compared with crops, livestock and fishery production grew even faster, with their output value share in agriculture rising from less than 17% in 1978 to 37% in 2019 (NBSC 2020).During the same period, the employment structure in rural China has also changed dramatically, shifting from farm to non-farm activities.The share of full- or part-time nonfarm work for rural laborer increased from 9.3% in 1978 to 84.4% in 2018 (Liet al.2021).
China’s rural transformation has been accompanied by rising income and reduced poverty in rural areas.Between 1978 and 2019, the per capita income of rural households in real terms has increased by nearly 22 times (NBSC 2020).Meanwhile, under the current poverty standard in China (about 3 USD d-1in 2011 PPP),rural poverty incidence had declined from 97.5% in 1978 to 0.6% in 2019 and then to zero in 2020.Recently,the national leader declared that China had completely eliminated rural poverty by the end of 2020, which implies that about 770 million rural population have escaped poverty since 1978.
While success has been made throughout the whole country, the speed of rural transformation and its effects on rural income growth and rural poverty reduction have differed across regions over the past four decades.On the one hand, different regions have various performances in the structure change of agricultural production along the path of moving from producing low-value to high-value commodities (Liuet al.2018; Wanget al.2019; Huang and Shi 2021).On the other hand, the participation rate of rural laborer’s non-farm employment has also varied substantially among regions (Liuet al.2018; Zhanget al.2018).
Several transnational studies have suggested that rural inclusion could be achieved through inclusive rural transformation.For example, the International Fund for Agricultural Development (IFAD) and the Food and Agriculture Organization (FAO) reported that successful rural transformation is characterized by poverty reduction in rural areas (IFAD 2016; FAO 2017).In Asian developing countries, a faster fall in the rural poverty rate is often associated with a faster rural transformation(Huang 2018a).However, all these studies are based on the aggregate national-level data.
Rural transformation in China has received increased attention, but a systematic analysis of rural transformation in different regions is still lacking.According to the existing literature, many scholars have developed various indicators to measure rural transformation in China (Huang and Ma 2018) and other countries in Asia (Dawe 2015;Belton and Filipski 2019; Imaiet al.2019; Liuet al.2020)and Africa (Barrettet al.2017).In addition, the typology analysis has provided new insight into the relationship between the path and outcome of rural transformation.However, most studies either focus on a specific region or analyzed rural transformation over a short time period (Liet al.2011; Longet al.2012).
To fill the above research gaps in the literature, this study aims to analyze the path of rural transformation and examine the relationship between rural transformation and its outcomes at the provincial level with much longer time coverage.The remainder of the paper is organized as follows.Section 2 presents the methods and data of rural transformation analysis in China.Section 3 describes the pattern of rural transformation by region from 1978 to 2018, investigates the relationship between the path and outcome of rural transformation by graphic illustration and regression analysis, provides a general classification of provincial rural transformation based on the key indicators of rural transformation, and discusses the major institutions, policies, and investments that might have facilitated rural transformation in China by reviewing the existing literature.The final section concludes this study.
2.Methods and data
2.1.Definitions and indicators
Rural transformation often refers to agricultural transformation and employment transformation of rural laborer (IFAD 2016; Huang and Shi 2021; Otsuka and Zhang 2021).IFAD (2016) defined rural transformation as ‘the process involving rising agricultural productivity,commercialization and diversification of production patterns and livelihoods, and expanded off-farm employment’.Over the past four decades, rural China has also witnessed more commercialized and diversified production in the agricultural sector (Liuet al.2018;Wanget al.2019) as well as a rapid rise in non-farm employment among rural laborers (Zhanget al.2018;Huang and Shi 2021).In addition, moving from graindominated agriculture to high-value crops, livestock,and fisheries is the key feature of China’s agricultural transformation.
In this study, the definition of rural transformation (RT)in China is a process that gradually shifts the structure of agricultural production from low-value (or grain-based)commodities to more diversified high-value (or non-grainbased) commodities and changes rural labor employment from farm to non-farm sectors.Accordingly, the paths of RT can be illustrated by two indicators (Table 1).RT1is the share of high-value products in agriculture (excluding forestry).This is mainly because grain (including rice,wheat, maize, other cereals, sweet potato, potato, and soybean) accounted for more than 80% of total crop sown area in 1978, and the share only declined to less than 70% in 2019 (NBSC 2020).RT2is the share of non-farm employment in rural labor, which reveals the increasing rural labor force participating in non-farm activities.
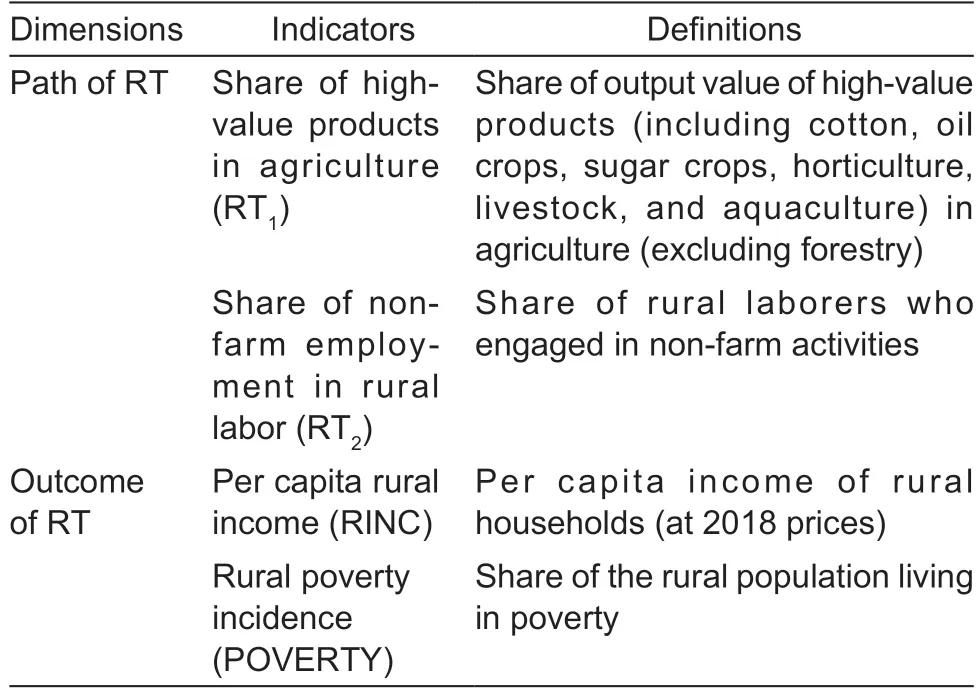
Table 1 Indicators for the path and outcome of rural transformation (RT)
Furthermore, the outcomes of RT can be evaluated from different aspects, such as growth, equity, and sustainability.This study focuses on two major outcomes(Table 1), rural income and rural poverty, which are measured by per capita rural income and rural poverty incidence, respectively, available at the provincial level.
2.2.Descriptive and econometric methods
Both graphic illustration and regression analysis are applied to investigate the potential relationship between RT and their outcomes.The former method displaysthe basic trend as well as the relationship of RT1or RT2against per capita rural income or rural poverty incidence.The latter method reveals their correlation by using both ordinary least square (OLS) and provincial fixed effect (FE)models (see eqs.(1) and (2), respectively).
where the dependent variableOutcomedonates per capita rural income or rural poverty incidence,respectively;iandjindicate province/autonomous region/municipalityi(ranging from 1 to 24) and yearj(ranging from 1978 to 2018);RT1andRT2represent the share of high-value products in agriculture and the share of nonfarm employment in rural labor, respectively.Moreover,δin eq.(2) is to capture unobservable but provincial fixed effects.
2.3.Data
Data used to calculate the indicators in Table 1 were collected from the official data published by the Statistic Bureau of each province/autonomous region/municipality in China and the Data Compilation on Production Cost and Benefit of Nationwide Agricultural Commodities,China.All the indicators cover the period of 1978-2018.Table 2 summarizes the statistics results.Notably, due to the change in the rural poverty line, rural poverty incidence is only comparable within each of the three periods (1978-1999, 2000-2010, and 2011-2018).
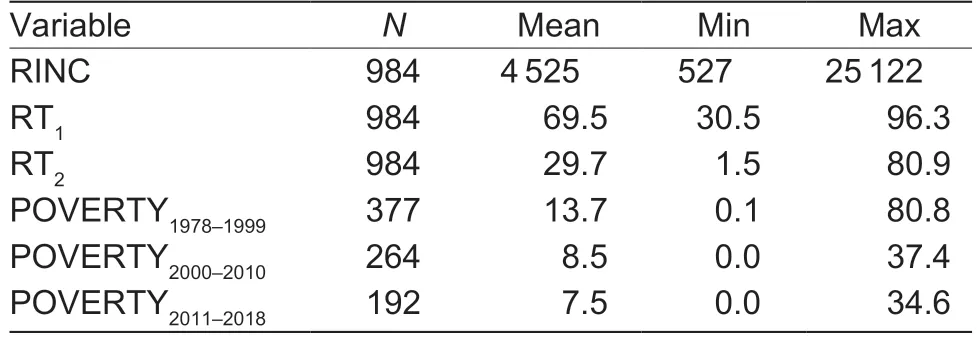
Table 2 Summary statistics of key variables
3.Results and discussion
3.1.Trends of provincial RT
Structural transformationRT is embedded within structural transformation (FAO 2017), so this sectionbegins with a brief introduction of structural transformation(ST).Following previous studies (Timmer and Akkus 2008; IFAD 2016; Timmer 2017; Huang 2018a), we define ST as agricultural shares in both gross domestic production (GDP) and employment.Notably, we include 31 provinces/autonomous regions/municipalities in this part of analysis.
Fig.1 reports that ST occurred along a similar pathway during 1978-2018.On the one hand, agricultural GDP grew at the annual rate of 4.5% in the past four decades,but industry and service sectors have grown much faster, which leads to a significant fall in agricultural GDP share.On the other hand, agricultural employment share in the national economy has also decreased, driven by urbanization and industrialization as well as rising agricultural productivity.Interestingly, the gap between the two shares has been narrowing (bottom line in Fig.1).Such a pattern is similar to those that occurred in developed countries and many Asian developing countries(Timmer 2009; IFAD 2016; Huang 2018a).Notably,China has experienced a greater decline in the share of agricultural employment than many developing countries,largely due to the faster economic growth and more significant expansion of labor-intensive manufacturing and service sectors that have created massive non-farm employment for rural labor force (Cai and Wang 2010;Huang and Shi 2021).However, the level of ST and the gap between the share of agricultural GDP and the share of agricultural employment differ considerably among provinces/autonomous regions/municipalities.
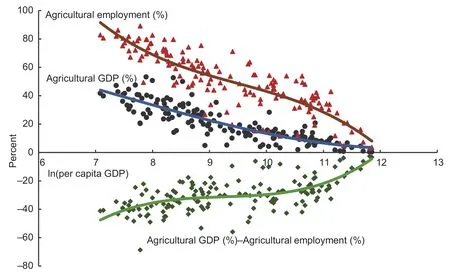
Fig.1 Convergence of the agricultural shares in GDP and employment in 1978, 1988, 1998, 2008, and 2018.Per capita GDP is at 2018 prices.The triangle, circle, and square dots represent agricultural employment (%), agricultural GDP (%), and the difference (%) between agricultural GDP (%) and agricultural employment (%), respectively.Each dot represents an observation for a province/autonomous region/municipality in a year.
Path of RTThe pathway of provincial RT varies depending on the dominant types of agriculture in local production.As indicated by Huang and Shi (2021),the autonomous regions (Inner Mongolia, Xizang,and Xinjiang), the municipalities (Beijing, Tianjin, and Shanghai), and the island province (Hainan) have their unique pathway.All these provinces/autonomous regions/municipalities are outliers, and therefore excluded in this study.In the end, the data from 24 of 31 provinces/autonomous regions/municipalities in farming region over the past four decades were used in analyzing the path and outcome of RT.We only show data for five years in 1978, 1988, 1998, 2008, and 2018 from each province/autonomous region/municipality in Figs.2 and 3 for simplicity.
Fig.2 reveals three interesting results on RT1in the past four decades.First, 24 provinces/autonomous regions/municipalities have experienced rapid agricultural transformation from grain-dominated agriculture to high-value agriculture.RT1in more than two-thirds of provinces/autonomous regions/municipalities exceeded 85% in 2018.Notably, the province/autonomous region/municipality with a higher level of RT1is generally associated with a more developed market and transportation infrastructure (e.g., Zhejiang and Jiangsu),but the province with a relatively low level of RT1in the northeast region is closely linked to the national policy to promote grain production (Huang and Shi 2021).Second,the initial level of RT1differed considerably across provinces/autonomous regions/municipalities, but many provinces/autonomous regions/municipalities have caught up and accelerated RT in the later period.For example,while the RT1in Ningxia rose from 31% in 1978 to 85%in 2018, the RT1in Guangdong had only increased by 30 percentage points and reached 94% over time.Moreover,Jilin was an exception, recording a significant fall in RT1during 2008-2018 (the last one in Fig.2).This could be explained by the policies supporting grain production prices that shift agricultural production to maize and rice in the recent decade (Huang and Shi 2021).Third, the speed of RT has slowed down significantly,particularly after the RT1exceeded 80%, which is largely because China has enhanced the provincial governor’s responsibility for grain security since 2015 (The State Council 2015).
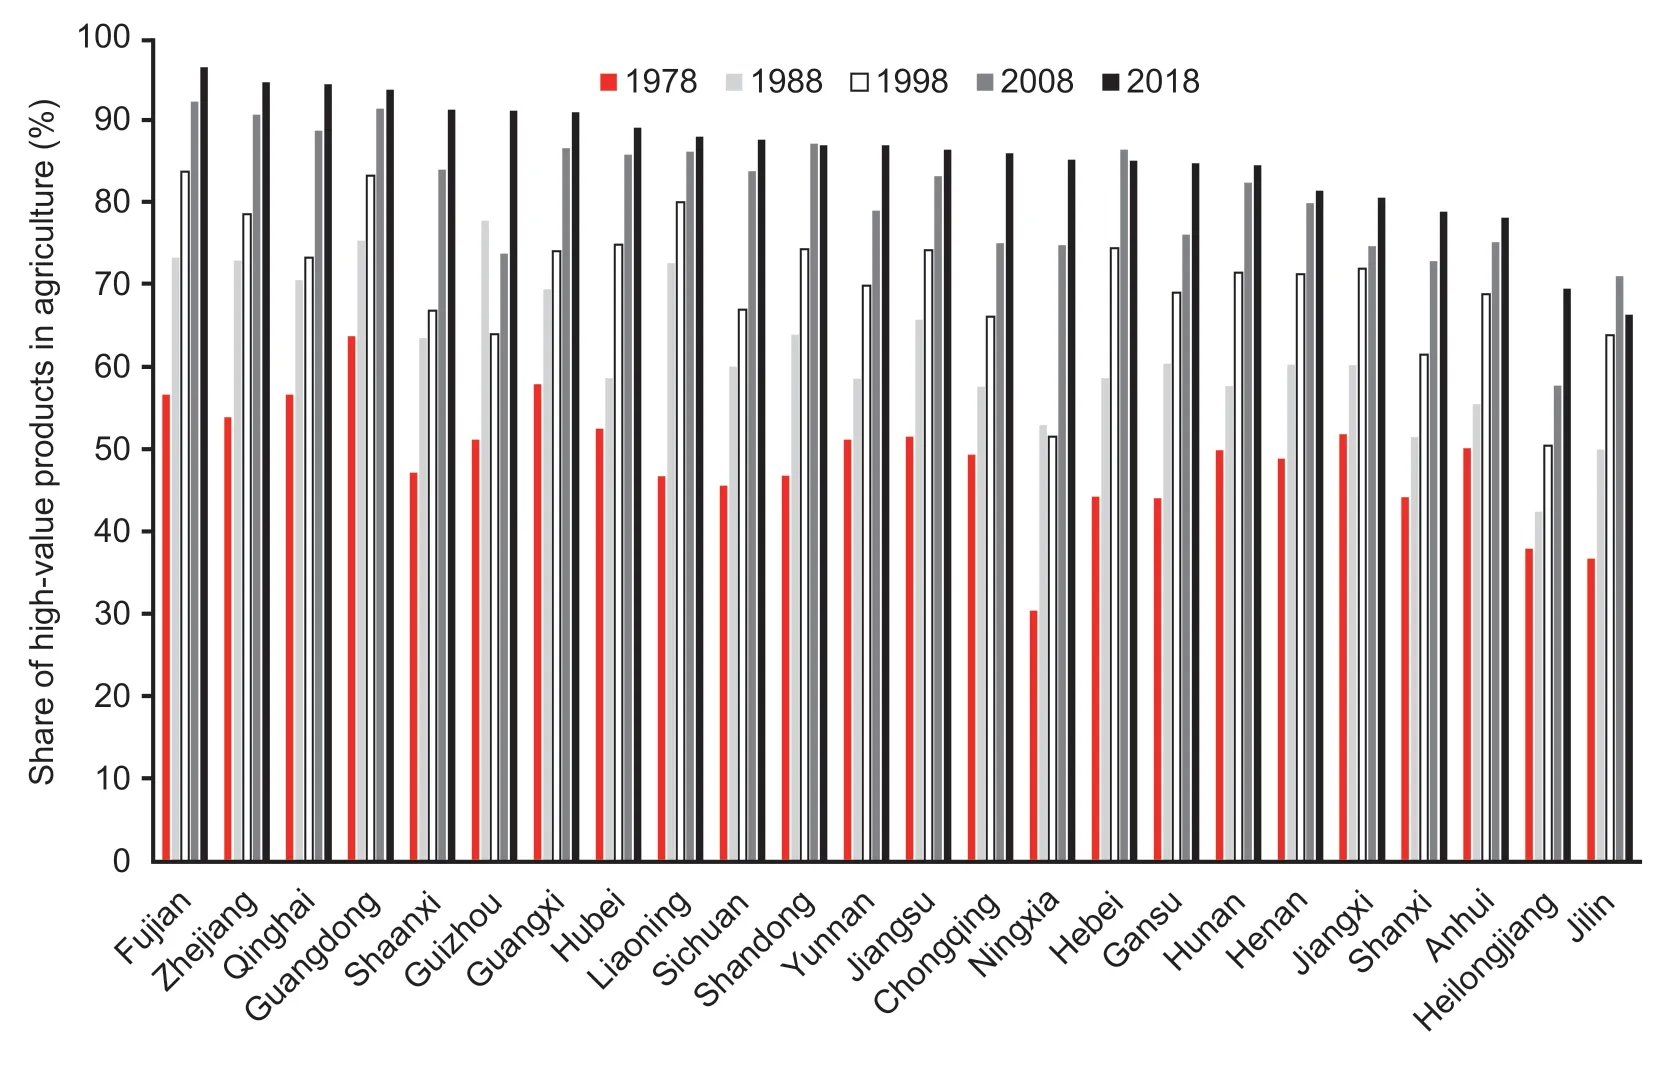
Fig.2 Share of high-value products in agriculture by region in 1978, 1988, 1998, 2008, and 2018.Provinces/autonomous regions/municipalities are ordered by share of non-grain products in agriculture in 2018 from the highest (left) to the lowest (right).
Apart from rapid agricultural transformation, the rate of non-farm employment among rural laborers also increased substantially between 1978 and 2018.According to Fig.3, there was only about 7% of rural laborers working in non-farm sectors in 1978, but the share increased by 44 percentage points and reached 51% in 2018.The most significant increase occurred during 1998-2008.However, Fig.3 displays a significant variation in rural non-farm employment among provinces/autonomous regions/municipalities.For example, rural households in economically developed provinces (e.g.,Zhejiang, Jiangsu, Guangdong, and Fujian) have gained more employment opportunities than those in less developed provinces/autonomous regions/municipalities(on the right-hand side of Fig.3).This is largely due to faster urbanization and more rapid expansion of laborintensive manufacturing and service sectors in the eastern region (Huang and Shi 2021).In addition, the starting points were more or less comparable in 1978,but the extent of the increase in RT2has differed among provinces/autonomous regions/municipalities.From 1978 to 1998, rural non-farm employment had grown faster in the eastern region.For example, RT2in Jiangsu and Guangdong rose from 8% to 44% and from 6% to 43%, respectively, while RT2was less than 30% in the central and western regions with less developed township enterprises (Liuet al.2018).In recent two decades,a significant rise in rural non-farm employment has occurred within less developed provinces/autonomous regions/municipalities in the central and western regions, compared with their weak performances during 1978-1998.Taking Qinghai in the western region as an example, the share of non-farm employment in rural labor rose from 2% in 1978 to 15% in 1998 and reached 48%in 2018.Other provinces/autonomous regions (e.g., Jilin,Heilongjiang, Yunnan, Shaanxi, and Ningxia) followed a similar trend.
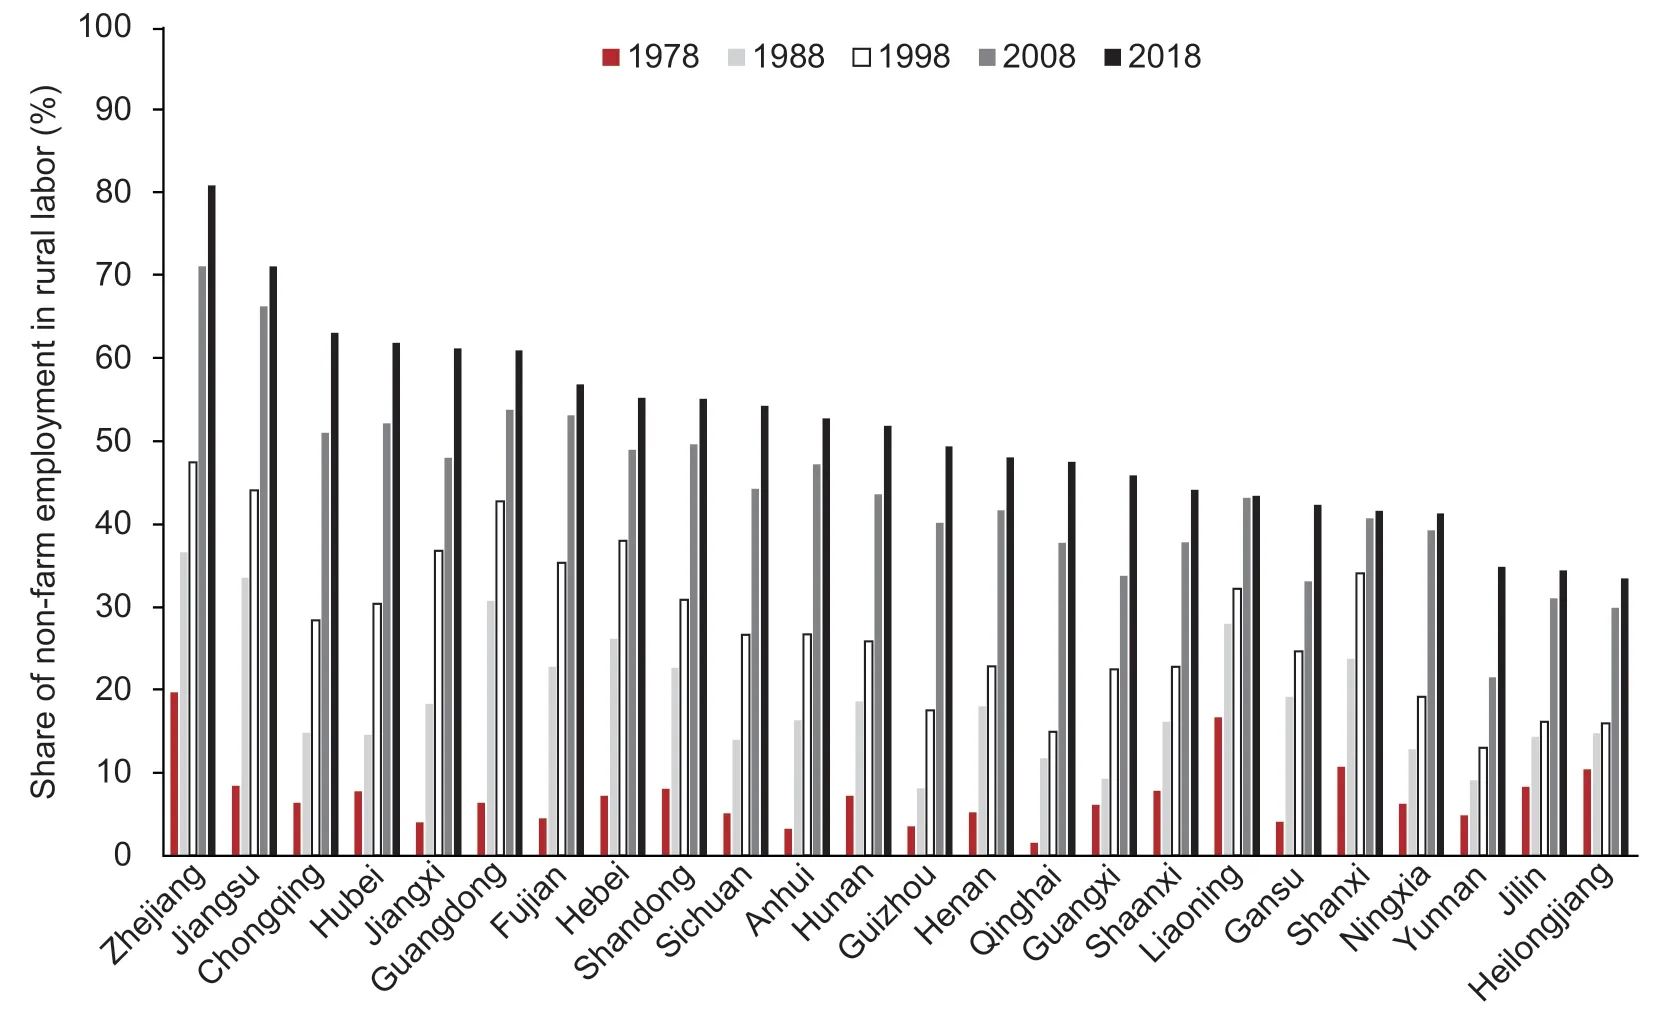
Fig.3 Share of non-farm employment in rural labor by region in 1978, 1988, 1998, 2008, and 2018.Provinces/autonomous regions/municipalities are ordered by share of non-farm employment in rural labor in 2018 from the highest (left) to the lowest (right).
Outcome of RTFig.4 shows provincial per capita rural income in real terms.First, the per capita income of 24 provinces/autonomous regions/municipalities grew rapidly.Based on our estimation, the average income in 2018 was 16 times that in 1978, ranging from about 10-13 times in the western region (e.g., Yunnan, Guizhou, Gansu,Ningxia, Qinghai, and Shaanxi) and some provinces in the central region (e.g., Hunan) and northeast region (e.g.,Heilongjiang and Jilin) to 22-25 times in several provinces in the eastern region (e.g., Zhejiang, Jiangsu, Fujian, and Shandong) and Henan in the central region.Second,the per capita rural income varied across provinces/autonomous regions/municipalities in China.In general,the provinces in the eastern region have higher incomes than those provinces/autonomous regions/municipalities in the central and western regions.For example, in terms of the per capita rural income in 2018, the top five provinces were all from the eastern region, and the bottom seven provinces/autonomous regions/municipalities were all from the western region.
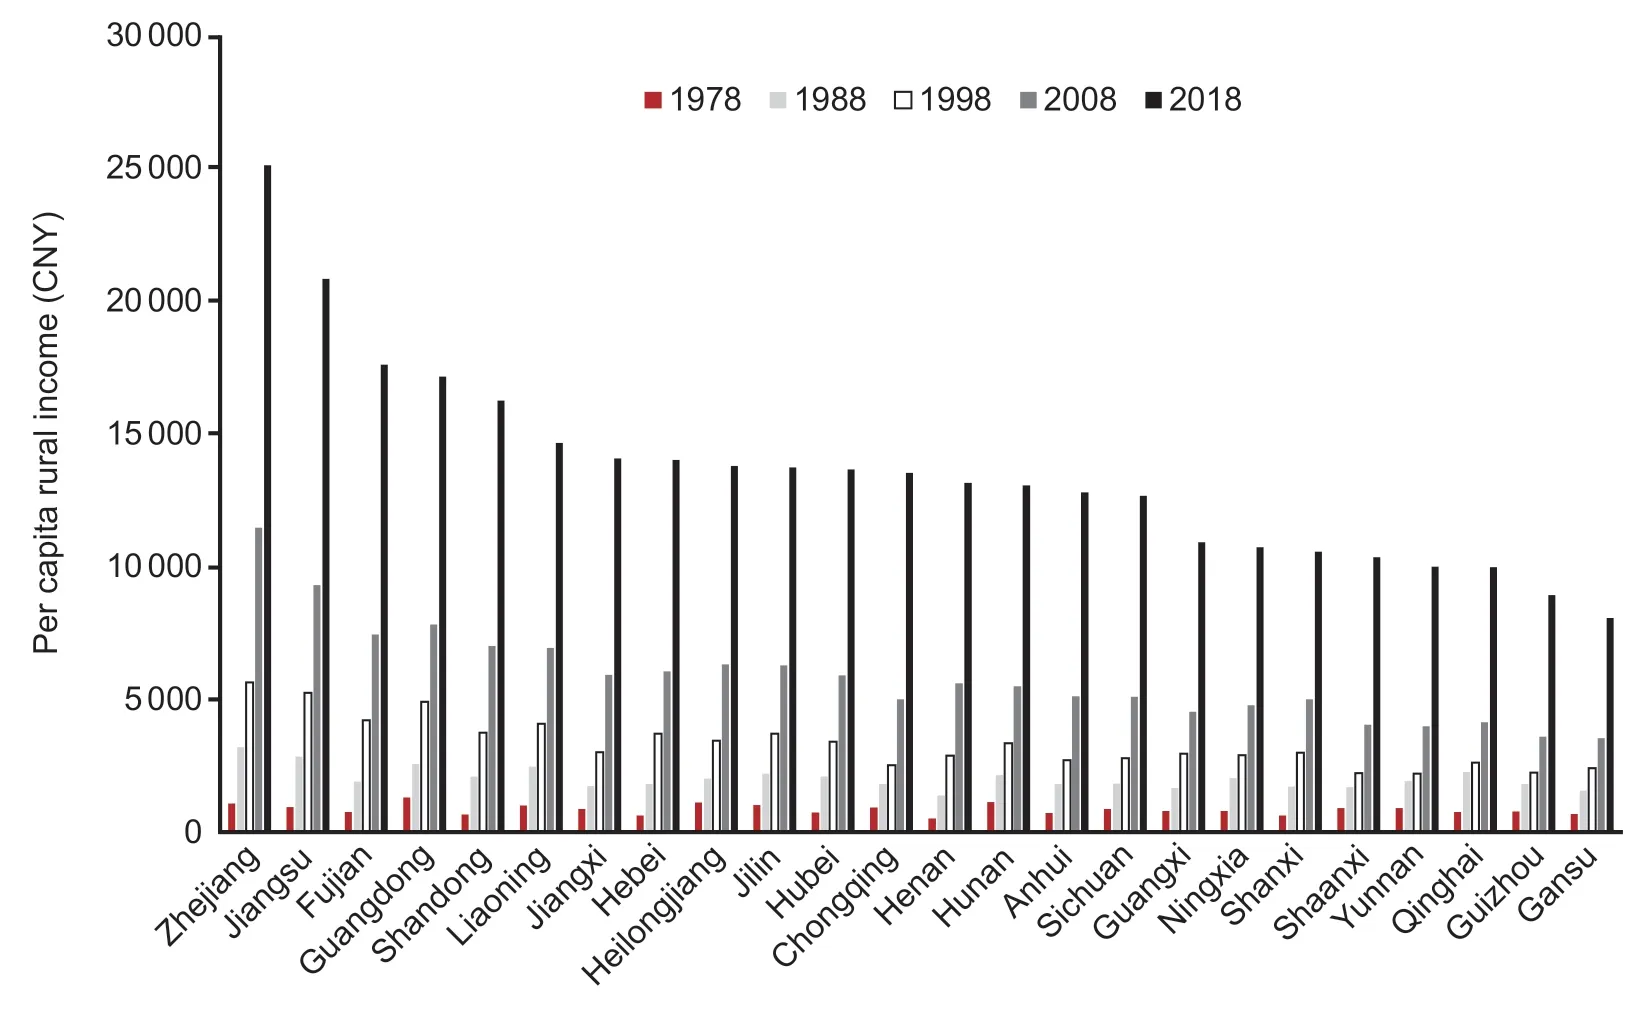
Fig.4 Per capita rural income by region in 1978, 1988, 1998, 2008, and 2018.Provinces/autonomous regions/municipalities are ordered by per capita rural income in 2018 from the highest (left) to the lowest (right).
Fig.5 illustrates the trend of rural poverty incidence by different standards: the 1978 standard for 1978-1999(Fig.5-A), the 2008 standard for 2000-2010 (Fig.5-B),and the 2010 standard for 2011-2018 (Fig.5-C).Notably,the 2010 standard is based on multiple dimensions(Liuet al.2018).In addition to income targets, poverty alleviation is also defined as ‘no shortage of food and clothing, and compulsory education, basic medical care and housing are guaranteed.’ Overall, the sharp decrease in rural poverty in Fig.5 is the most successful story of China’s RT and the national poverty alleviation plan.A close look at rural poverty incidence in three periods reveals that some provinces in the eastern region have escaped poverty faster or earlier than other provinces/autonomous regions/municipalities.Although a significant decline in rural poverty incidence has occurred in the western region in each period, the poverty level remains high in the latest period under the relevant poverty line,compared with the provinces in the eastern and central regions.
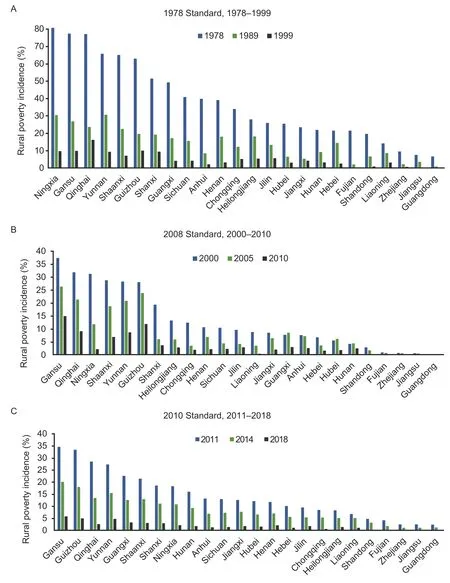
Fig.5 Rural poverty incidence by region in 1978-1999, 2000-2010, and 2011-2018.The national rural poverty incidence fell to 7.2% in 2014.Since then, China has implemented a targeted poverty reduction policy and mobilized large amounts of resources to achieve the poverty alleviation goal by 2020.In recent three years, China has begun to focus on consolidating and expanding poverty alleviation efforts in line with the full implementation of the Rural Vitalization Strategy in the 14th Five-Year Plan (2021-2025).
3.2.Correlation between the path and outcome of provincial RT
Results of graphic analysisTo examine the relationship between provincial RT and per capita rural income as well as rural poverty incidence in China, both the Locally Weighted Scatterplot Smoothing (LOWESS) method and the Polynomial method were conducted to fit the data of 24 provinces/autonomous regions/municipalities from 1978 to 2018.Although the results are largely consistent,we find that the former method performs better at fitted lines for the relationship between provincial RT and per capita rural income, and the latter method fits better for the relationship between provincial RT and rural poverty incidence.To save space, we only present the results that fit better.
As shown in Fig.6, the level and speed of RT in terms of high-value agriculture differ among provinces/autonomous regions/municipalities, but there is a clear pattern (Fig.6-A).That is, the higher RT1is associated with the higher per capita rural income.However, the per capita rural income tends to increase moderately in the early stage of RT and then dramatically rises after the RT1reaches about 60%.The steeper fitted lines in the later stage of RT could be explained by two reasons.On the one hand, additional high-value products may yield more profit for farmers.On the other hand, nonfarm employment with higher wage rates turns out to be the main contributor to rising rural household income (Liet al.2012).Notably, Jilin was an exception, where rising per capita rural income was accompanied by a declining share of high-value products in agriculture in recent years.
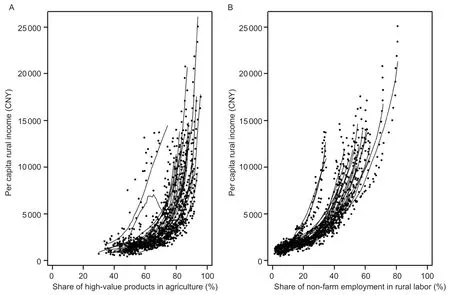
Fig.6 Locally Weighted Scatterplot Smoothing (LOWESS) fit between rural transformation (RT) and per capita rural income by region in 1978-2018.Each dot represents either the share of high-value products in agriculture (A) or the share of non-farm employment in rural labor (B) and per capita rural income for a province/autonomous region/municipality in a year.
Fig.6-B illustrates a larger variation in non-farm employment than in high-value agriculture, but a similar tendency is also observed.That is, the higher the RT2,the higher the per capita rural income.Moreover, the per capita income of rural households has accelerated to grow after the RT2exceeded 30% or so.Notably, the slower increase in per capita rural income in the early stage of RT is largely due to the fact that wages did not rise or only increased moderately before the early 2000s(Liet al.2012), but both new non-farm employment opportunities and rise in wage rates contribute to the exponential growth of per capita rural income in the later stage of RT.
Fig.7 displays the relationship between the high-value agriculture and rural poverty incidence in three periods.Overall, the share of the rural population living in poverty tends to decrease with a rising share of high-value products in agriculture.To be more specific, there exists a strong and negative relationship between RT1and rural poverty incidence under the relatively low level of the poverty standard (Fig.7-A), indicating that poor people did gain from agricultural transformation moving from grain-based agriculture to more high-value agriculture in the early stage of RT.Besides, the inverse relationship between higher RT1and lower rural poverty incidence still holds in the later stage of RT under the higher level of poverty standards in 2000-2010 (Fig.7-B) and 2011-2018 (Fig.7-C).Notably, Liaoning, Jilin, and Heilongjiang in the northeast region were exceptions to the slopes of fitted lines in 2000-2010.
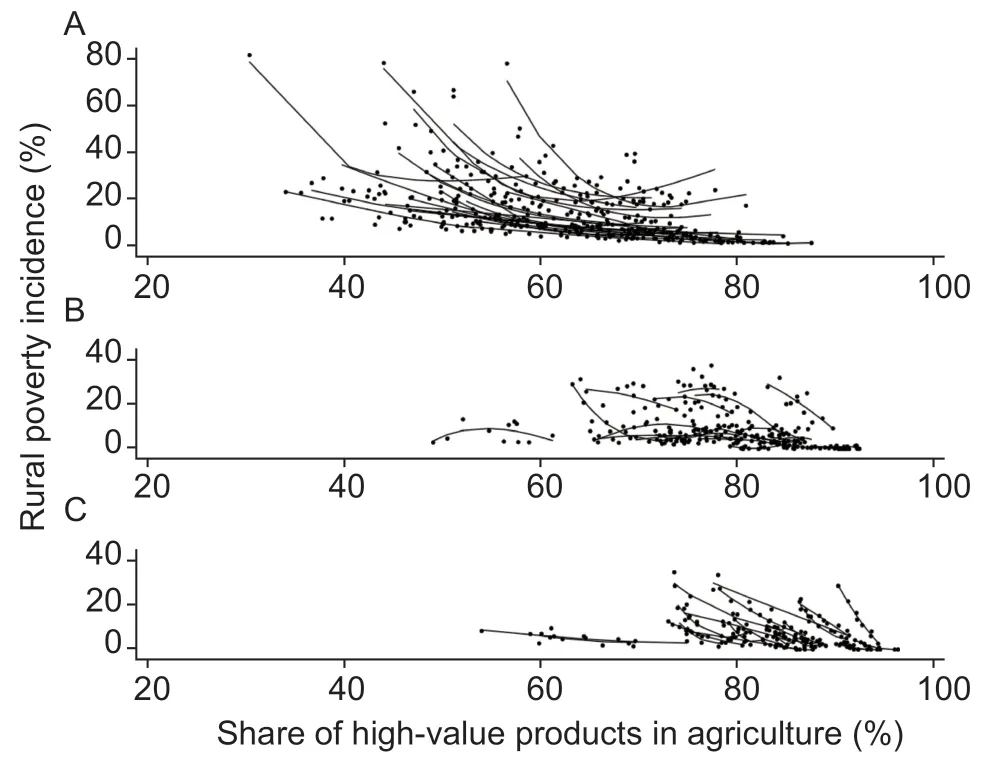
Fig.7 Polynomial fit between the share of high-value products in agriculture and rural poverty incidence by region in three periods, 1978-1999 (A), 2000-2010 (B), and 2011-2018(C).Each dot represents the share of high-value products in agriculture and rural poverty incidence for a province/autonomous region/municipality in a year.
Fig.8 describes the relationship between rural labor employment in non-farm and rural poverty incidence during 1978-2018.In general, the higher RT2is associated with the lower poverty incidence in rural areas.Compared with the relationship between highvalue agriculture and rural poverty incidence in Fig.7,more inclusive RT is evidenced in terms of RT2.That is a stronger and more negative relationship between RT2and rural poverty incidence in nearly all regions.Furthermore,additional non-farm employment for rural labor force could substantially reduce rural poverty in the early stage of RT (Fig.8-A).Such a relationship still holds even if the poverty standard is raised (Fig.8-B and C).

Fig.8 Polynomial fit between the share of non-farm employment in rural labors and rural poverty incidence by region in three periods, 1978-1999 (A), 2000-2010 (B), and 2011-2018 (C).Each dot represents the share of non-farm employment in rural labor and rural poverty incidence for a province/autonomous region/municipality in a year.
Results of regression analysisWe further applied a regression method to quantify the relationship between the path and outcome of RT.Since the graphic analysis indicates that RT is strongly and positively correlated with income growth and poverty reduction in rural areas, we include both RT1and RT2as the right-hand side variables.To capture the non-linear relationship between RT1or RT2and rural income or rural poverty1We have tried to include the inverse terms of RT1 and RT2, but the major results in Appendix A are consistent with those presented in Table 3.For example, they have similar R-squared, and most coefficients are statistically significant at a 1% level., we also include the quadratic terms of RT1and RT2.Notably, rising nonfarm employment in rural labor force is interconnected with ST, so we exclude ST from the right-hand side of the model specifications.The results based on OLS and FE estimations are presented in Table 3.Overall,the models explain the variation of outcomes well2It is worth noting that income growth and poverty reduction in rural areas are not fully explained by RT.Other factors, such as wage,are also important..The value ofR-squared is 0.768 (OLS) and 0.818 (FE) in the rural income model, and it ranges from 0.336 to 0.775 in the rural poverty incidence model for three periods.Most estimated parameters are statistically significant at a conventional level.
The estimation results of the rural income model suggest that a high level of RT1enhances rural income growth.To be more specific, the parameter of RT12is positive and statistically significant (column 1, Table 3),which indicates a U-shaped relationship between RT1and per capita rural income.The calculated turning point of RT1, based on OLS estimation, is at about 57%(176.43/2/1.55).Together with the data of high-value agricultural share (Fig.6-A), we find most observations are located on the right-hand side of the turning point.When we apply the FE estimation (column 2, Table 3), the curve is no longer U-shaped and becomes exponentialshaped.This is because the parameter of RT12is statistically significant, while the parameter of RT1is not.
Moreover, it is likely to raise rural income by promoting RT with rural labor employment in non-farm.As shown in Table 3, the relationship between RT2and per capita rural income is also U-shaped.The results of FE estimation(column 2, Table 3) suggest the turning point of RT2is as low as 10% (76.58/2/3.74), and the average share of nonfarm employment in rural labor was already about 10%in 1978 (Fig.3).In other words, additional increase in rural non-farm employment would significantly raise rural income.Besides, the results based on OLS estimation(column 1, Table 3) show that rising rural labor non-farm employment has accelerated the growth of per capita rural income even in the early stage of RT.
According to the estimation results of the rural poverty incidence model in Table 3, the relationship between RT1and rural poverty incidence reveals two interesting findings.First, in the early stage of RT with a relative lowlevel of rural poverty standard, the estimated parameters of RT1and RT12are statistically significant in the FE model(column 4, Table 3), which implies that the U-shaped curve of RT1against rural poverty incidence existed by controlling the initial level of poverty incidence during 1978-1999, and the turning point of RT1was at about 77% (1.36/2/0.0088).Second, the results of column 5 and the last two columns in Table 3 display the inverse U-shaped relationship between RT1and rural poverty incidence because the parameters of RT1and RT12are positive and negative, respectively.Under the poverty standard during 2011-2018, the estimated turning points of RT1were at about 80% (3.57/2/0.022) by using OLS estimation and about 60% (3.68/2/0.03) by using FE estimation.The results of the latter estimation seem more reasonable than those from the former one.This is also evidenced byR-squared values (0.336 in OLS and 0.775 in FE).
As for the relationship between RT2and rural poverty incidence, the estimated results in Table 3 are consistent across three periods.All regression results show a U-shaped relationship with most observations located to the left-hand side of the turning points (Fig.8).In other words, a fall in rural poverty incidence is accompanied by a rise in rural labor employment in non-farm, but the marginal rise in non-farm employment is associated with less reduction in rural poverty at the end of each period.These results may also suggest that a more targeted poverty alleviation program is required to effectively reduce rural poverty.In addition, the turning points occurred at about 35% (2.36/2/0.034, OLS) and 32%(2.59/2/0.04, FE) when the poverty standard was at a very low level between 1978 and 1999.While China’s rural poverty standard has been raised twice after 2000, the turning point rose to about 60% during 2000-2018.
3.3.Category of provincial RT
Both graphic and econometric results confirm that a higher level of RT is strongly associated with higher per capita rural income and lower rural poverty incidence.However,it is meaningful to identify the status and category of RT at the provincial level.For this purpose, we used RT1and RT2to conduct typology analysis.
To avoid year-on-year fluctuations in these two indicators, we obtained the averaged RT1and RT2during 2016-2018 by province/autonomous region/municipality.Then, 24 provinces/autonomous regions/municipalities were divided into three groups.That is, Low RT1(or RT2),Medium RT1(or RT2), and High RT1(or RT2).Here, we used RT1as an example for illustration.Let dX be the gap between the largest (Xmax) and the lowest (Xmin) RT1among 24 provinces/autonomous regions/municipalities.All these provinces/autonomous regions/municipalities could be grouped into the following three groups by using dX/3: Low RT1if RT1<(Xmin+dX/3), Medium RT1if (Xmin+dX/3)
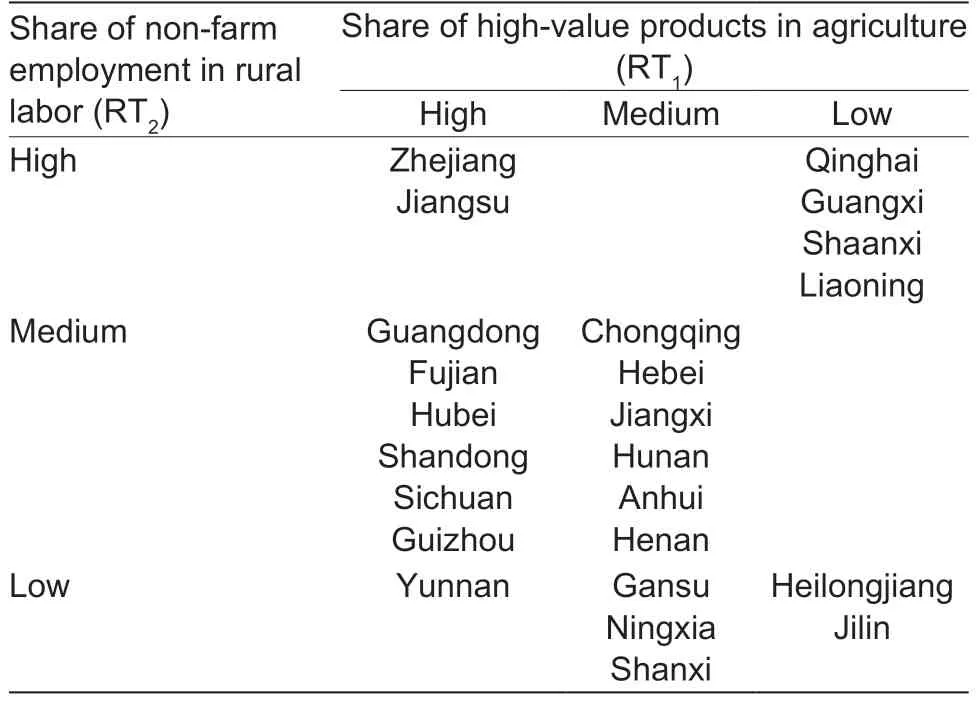
Table 4 Category of provincial rural transformation (RT) during 2016-2018
Category I: High in both RT1and RT2(Zhejiang and Jiangsu).Provinces in this group had a high level of highvalue products in agriculture and non-farm employment in rural labor force.In fact, Zhejiang and Jiangsu were ranked 1st and 2nd in terms of per capita rural income among 24 provinces/autonomous regions/municipalities of China in 2018.They had also eliminated rural poverty by 2015 under the current poverty standard, much earlier than other provinces/autonomous regions/municipalities.In the long run, these two provinces should continue their current pathway of RT.
Category II: High in RT1and medium in RT2.Provinces in this group had a high level of RT in terms of high-value agriculture and a medium level of RT in terms of rural labor employment in non-farm.Guizhou and Sichuan were low-income provinces with a relatively high level of rural poverty incidence.The rank of per capita rural income in the other four provinces ranged from 3rd in Fujian to 11th in Hubei, and they had ended poverty by 2018.In general, there is more room to expand non-farm employment in rural labor.
Category III: High in RT1(or RT2) but low in RT2(or RT1).Provinces/autonomous regions in this group had either a high level of high-value products in agriculture but a low level of non-farm employment in rural labor or vice-versa.They (except Liaoning) had a relatively low level of per capita rural income, ranging from 17th in Guangxi to 22nd in Qinghai, and a high level of rural poverty incidence.This group has considerable room to speed up either rural non-farm employment (Yunnan)or high-value agriculture (the other four provinces/autonomous regions).
Category IV: Medium in both RT1and RT2.Provinces/municipalities in this group (Chongqing, Hebei, Jiangxi,Hunan, Anhui, and Henan) had a medium level of RT in both high-value agriculture and rural labor employment in non-farm.Their income and poverty incidence in rural areas have also been approximately at China’s national average in recent years (Figs.4 and 5).These provinces/municipalities still have room to speed up their RT in two major aspects.
Category V: Medium or low in RT1and low in RT2.Provinces/autonomous regions in this group had either a medium or low level of RT in high-value agriculture and a low level of RT in non-farm employment of rural labor.Rural poverty incidences in Gansu, Ningxia, and Shanxi were high, and per capita rural income ranked between 18th and 24th in 2018, so these three provinces/autonomous regions should make great efforts to accelerate their RT, particularly non-farm employment in rural labor.While Heilongjiang and Jilin maintained a low level of RT in both high-value agriculture and non-farm employment, per capita rural income was slightly higher than the average.This is mainly because the per capita cultivated land of good quality in these two provinces is larger than in other provinces/autonomous regions, which is more suitable for planting staple crops.
3.4.Likely impact of institutions, policies, and investments
Institutions, policies, and investments (IPIs) have contributed to rapid RT in China (Huang and Rozelle 2018; Huang and Shi 2021).In this section, the potential effects of various IPIs on provincial RT are discussed.
Institutional innovationsOngoing institutional innovation is the key feature of China’s rural reform in the past four decades.For example, the implementation of the household responsibility system (HRS) greatly promoted agricultural productivity during 1978-1984(McMillanet al.1989; Lin 1992; Huang and Rozelle 1996).This increase in productivity had a positive impact on grain security and enabled the allocation of more agricultural resources, such as land and water, towards the production of high-value agricultural products (Huang and Shi 2021).Moreover, institutional reforms to enhance land use rights since the late 1990s, the establishment of land transfer service centers (Gaoet al.2012; Huang and Ding 2016), and the rapid expansion of agricultural mechanization customs service since the early 2010s(Yanget al.2013; Wanget al.2016; Yiet al.2019) have also facilitated employment transformation of rural labors from farm to non-farm sectors.
Policy supportsChina’s agricultural technology and extension innovations are the major driving force of agricultural productivity growth (Fan 1997; Jinet al.2010) and play an important role in RT.For example, the generation and adoption of hybrid rice have significantly increased rice yield in China since the 1970s.Benefiting from modern varieties and inputs, the wheat yield has increased even more than rice yield.With the increase of grain production to ensure national grain security, China has been able to successfully diversify its agriculture in the past four decades.Other technological innovations in cash crops (e.g., Bt cotton), livestock production (e.g., swine and poultry), fertilizer manufacture, and agricultural mechanization have largely promoted RT.It is worth noting that most technologies adopted by farmers in China have come from the public research and development (R&D) system.
Market reform has also affected the process of RT in China.In general, farmers could diversify their livelihood in different ways, either by adjusting the production structure of agriculture, particularly from grain-based to more cash crops and other high-value agricultural products, or by participating in non-farm employment to raise labor productivity.However, the price invention policies (e.g., the minimum procurement prices for rice and wheat) distort the allocation of agricultural inputs and lead to serious supply-side structural problems in agriculture (Huang 2018b).Some agricultural subsidy policies (e.g., direct grain subsidy) have little or no impact on agricultural production (Huanget al.2011).Notably,liberalization in agricultural markets help China to import land-intensive products (e.g., soybeans, oil, and sugar crops) and export labor-intensive products (e.g., fruits and vegetables), which have stimulated agricultural transformation (Andersonet al.2004).
Investment in infrastructureInvesting in infrastructure has contributed to rapid RT (Fanet al.2018).For example, irrigation in China lays a solid foundation for rising agricultural productivity, which has further facilitated agricultural transformation towards more high-value agricultural products (Wanget al.2020).With substantial investment in rural road and marketing infrastructure,China’s agricultural markets have been emerging, and agricultural production has been diversifying since the late 1990s (Huang and Rozelle 2006).Increasing nonfarm employment in rural labor has largely benefited from transportation (Wang and Sun 2016), telecommunication(Minet al.2020), and other infrastructure, which promotes the linkage between small farmers and big markets.
4.Conclusion and implications
China has achieved successful rural transformation over the past four decades.Such a process is characterized by a gradual movement from grain-dominated agriculture to more diversified high-value agriculture and a significant shift from farm to non-farm employment in rural labor.Specifically, on the one hand, agricultural transformation is based on the premise that primary food grain production has been growing at a steady rate, which allows more land, water resources, and other production factors to be allocated to produce cash crops, livestock, and aquatic products to meet the diversified food demand in China.On the other hand, driven by urbanization and industrialization,ST has created massive employment opportunities for rural labor, together with rising agricultural labor productivity,which enables rural labor to work in non-farm sectors.
However, the level of RT differs across provinces/autonomous regions/municipalities in China.In particular,provinces in the eastern region have transformed their rural economy faster than many provinces/autonomous regions/municipalities in the central, western, and northeastern regions.Our provincial analysis shows that the level of RT is strongly and positively correlated with per capita rural income and negatively associated with rural poverty incidence.Considering the non-linear relationship between the path and outcome of RT, the marginal contribution (if causality exists) of high-value agriculture or rural labor employment in non-farm to per capita rural income is increasing.The presence of either the left-hand side of a U-shaped curve or the righthand side of an inverse U-shaped curve indicates that promoting rapid RT will reduce rural poverty.Based on the level of RT measured by RT1and RT2in 2016-2018,five categories of provincial RT in China are identified.
This paper has several important policy and research implications for rural income growth and poverty reduction in the process of RT.First, accelerating RT either by agricultural transformation towards high-value products or rural labor employment transformation towards non-farm sectors is crucial.Second, the categories of provincial RT provide useful information to decision-makers in central and local governments as well as development agents working in local provinces/autonomous regions/municipalities.It helps identify the current status of each province/autonomous region/municipality and provides guidance on the desired direction for future progress.Third, appropriate IPIs should be explored to promote more rapid and inclusive RT.This paper only discusses the likely impacts of IPIs on RT, but the actual impact and sequence of IPIs are critical issues that should be rigorously examined.Last but not least, the causality between the path and outcome of RT needs further study.
Acknowledgements
The authors acknowledge the financial support from the Australian Centre for International Agricultural Research(ADP/2017/024), the National Natural Science Foundation of China (71934003), the National Social Science Fund of China (19ZDA002 and 22CJL003), and the International Fund for Agricultural Development (2000000866).
Declaration of competing interest
The authors declare that they have no conflict of interest.
Appendixassociated with this paper is available on https://doi.org/10.1016/j.jia.2023.10.037
 Journal of Integrative Agriculture2023年12期
- Journal of Integrative Agriculture的其它文章
- Biotechnology of α-linolenic acid in oilseed rape (Brassica napus)using FAD2 and FAD3 from chia (Salvia hispanica)
- Analyzing architectural diversity in maize plants using the skeletonimage-based method
- Derivation and validation of soil total and extractable cadmium criteria for safe vegetable production
- Effects of residual plastic film on crop yield and soil fertility in a dryland farming system
- Identifying the critical phosphorus balance for optimizing phosphorus input and regulating soil phosphorus effectiveness in a typical winter wheat-summer maize rotation system in North China
- Characteristics of Mycobacterium tuberculosis serine protease Rv1043c in enzymology and pathogenicity in mice