Change of cultivated land area and effect on ecosystem service in black soil region in Northeast China:a case study of Lishu County, Jilin Province
WANG Ruiqi, LI Hong and SHANG Yi
College of Earth Sciences, Jilin University, Changchun 130061, China
Abstract: It is of great significance to study the influence of spatial pattern change of cultivated land on ecosystem service, including the sustainable utilization and ecological protection in black soil region in Northeast China.Taking Lishu County of Jilin Province as the study area, we quantitatively evaluated soil conservation,habitat quality, carbon storage and grain production service, and analyzed the change of cultivated land and ecosystem service pattern in Lishu County from 1990 to 2020 by using Pearson correlation analysis on the correlation between cultivated land change and ecosystem service.The results show that: (1) The cultivated land area of Lishu County was reduced by 19.67 km2, the characteristics of cultivated land change are significant; (2) the overall change rate of carbon storage, habitat quality, soil conservation and grain production service in the study area was 10.82%, -0.09%, 4.07% and 1.80%, respectively.They all had significant spatial differentiation features; (3) the change of habitat quality, grain production service showed a significant positive correlation with the change of cultivated land area.The change in soil conservation and carbon storage were negatively related to cultivated land area.In order to promote the rational development and utilization of cultivated land in the research area, it is suggested to scientifically carry out the comprehensive utilization of cultivated land reserve resources such as saline-alkali land, strengthen the management and protection of newly added cultivated land at the same time.The results can provide scientific reference for formulating comprehensive land use planning under ecological security conditions.
Keywords: spatial pattern of cultivated land; ecosystem service; InVEST model; black soil region; Lishu County
Introduction
Ecosystem service refers to the natural environmental conditions and utilities formed and maintained by ecosystems and ecological processes for human survival (Daily, 1997).As a composite ecosystem,cultivated land can provide human many products and services with ecological value, and also interacts with the ecosystem (Jianget al., 2020).It has the functions of ecological regulation and environmental conservation, and assumes the responsibility of maintaining regional ecosystem balance (Song & Li, 2019).However, with the advancement of urbanization,the phenomenon of cultivated land reduction caused by construction land occupation is becoming more and more common (Denget al., 2015).Ecosystem service and spatial distribution are closely related to the change of land use patterns, which play a decisive role in ecosystem maintenance, human can affect ecosystem services by changing land use patterns (Chenet al., 2019; Defrieset al., 2004).Therefore, the evaluation of regional ecosystem service based on the evolution of cultivated land utilization patterns is of great significance to clarify the changing characteristics of regional ecosystem service and the process of sustainable utilization of cultivated land.
Ecosystem service is mainly evaluated quantitatively through model construction.At present, InVEST,ARIES and SoLVES models are widely used in the evaluation of ecosystem service (Bagstadet al.,2011; Brown & Brabyn, 2012).Among them, the InVEST model has strong spatial analysis ability, high accuracy of evaluation results and low input cost.As a new tool to connect the function of ecological production and economic values, InVEST model has advantages over other models, solves the problem that the expression of ecosystem service assessment is not intuitive enough, and widely used in ecosystem service assessment research (Tallis & Polasky, 2009;Terradoet al., 2016; Lehet al., 2013; Goldsteinet al., 2012; Yuet al., 2021).Regarding the research on the evolution of cultivated land spatial pattern,relevant scholars mainly studied the spatio-temporal process of cultivated land evolution, driving forces and driving mechanisms, the simulation of cultivated land spatial pattern, environmental effect of the evolution of cultivated land spatial pattern (Caoet al., 2019;Omaidet al., 2018; Liuet al., 2018; Weiet al., 2021).At present, the ecological problems caused by the change of cultivated land spatial pattern have aroused widespread concern, relevant scholars have focused on the impact of the spatial pattern of cultivated land on single elements such as the production capacity, the climatic production potential of cultivated land, soil,some scholars have estimated its ecological effects by constructing ecological index (Huanget al., 2022; Tanet al., 2004; Liuet al., 2022; Tianet al., 2002; Song &Deng, 2017; Suet al., 2022).Most studies have chosen ecological reserves as research areas, while few papers focused on the black soil area in Northeast China,ignoring the impact of cultivated land spatial pattern change on regional ecosystem service.Therefore,this paper studied the change of cultivated land spatial pattern and regional ecosystem service in the representative region (Lishu County, Jilin Province),and discussed the correlation between cultivated land change and regional ecosystem service, so as to clarify the mechanism of cultivated land spatial pattern on regional ecosystem service.
The black soil area is mainly distributed in the Northeast China Plain, including Heilongjiang, Jilin,Liaoning provinces and the northeast part of Inner Mongolia Autonomous Region.Since the 1990s, the grain commodity rate of Jilin Province is as high as 50%–75%, which plays a pivotal role in the national food security system (Liu & Yan, 2009).Lishu County is located in the southwest of Jilin Province.The area of cultivated land in the county accounts for a high proportion, plays an important role in ensuring the stable and high yield of agricultural production in Jilin Province.At present, the spatial pattern of cultivated land in Lishu County is changing rapidly, the environmental relationship is complex, and strongly influenced by human activities such as agricultural production.Therefore, the evolution of the spatial temporal pattern of cultivated land poses a great challenge to regional ecosystem service.On the basis of analyzing the change in the cultivated land spatial pattern, revealing the relationship between the change in the cultivated land spatial pattern and ecosystem service between 1990 and 2020 is of great significance for achieving sustainable use of regional cultivated land and ecological protection at the same time.
1 General situation of the study area

Fig.1 Geographical locations of townships in Lishu County
Lishu County is located in the southwest of Jilin Province at 123°45′–124°53′ E and 43°02′–43°46′ N,with an area of 3 232 km2(Fig.1).The terrain from the southeast to the northwest gradually reduced, the southeast is low hills, the central is the wave plain, and the northwest is the East Liaohe alluvial plain.The land use types are mainly cultivated land, grassland and forest land.The cultivated land area of the county is 2 387.87 km2, accounting for more than 76% of the total land area.Therefore, the change of its spatial pattern is closely related to the spatial and temporal pattern of regional ecosystem service.Agriculture is the basic industry of Lishu County, with an annual total grain output of 2.5 billion kilograms.Driven by grain production and economic interests, the spatial layout of cultivated land in Lishu County changes continuously, so Lishu County is a good research area to reveal the change of cultivated land and the change of ecosystem service (Data source: website of Lishu County People’s Government).
2 Methods
This study uses transfer matrix to analyze the spatial change of cultivated land in the study area,InVEST model and NDVI data were used for the quantitative assessment of ecosystem service, and Pearson correlation coefficient was used for the association and correlation analysis.
2.1 Data sources
The data used in this paper mainly include land cover data, DEM data, precipitation data, soil data, etc.The land cover data and DEM data were obtained from the website of Resource and Environmental Science Data Center of Chinese Academy of Sciences (https://www.resdc.cn/), and the land cover data of 1990, 2000,2010 and 2020 were selected with a spatial resolution of 30 m, and the spatial resolution of 90 m for DEM data.Considering the actual situation of the study area, the land use type was classified into 14 types,including paddy field, dry land, forest land, shrub,sparse forest land, other forest land, high coverage grassland, coverage, grassland, water, urban land, rural residential areas, other construction land and unused land.Annual precipitation data were obtained from the National Earth System Science Data Center (http://gre.geodata.cn).Soil texture data were obtained from the National Glacier and Desert Scientific Data Center(http://www.ncdc.ac.cn).Normalized Difference Vegetation Index (NDVI) was derived from the MODIS13Q1 Land Project, and the modal dataset was synthesized and downloaded annually through the GEE (Google Earth Engine) platform with a resolution of 250 m.The data of grain output comes from Lishu County Statistical Bulletin of National Economic and Social Development in 2021.Other parameters used to assess ecosystem service were obtained by referring to the InVEST model guidelines and related literature.
2.2 Land-use transfer matrix
The land use transfer matrix can analyze the dynamic process of the mutual transformation between the different areas at the beginning and end of a certain period, and can reflect the spatiotemporal evolution process of cultivated land (Qiaoet al., 2013).
2.3 Quantitative assessment of ecosystem service
2.3.1 Support service
Habitat quality is an assessment of the ecological environment of different species, which can indirectly measure the level of biodiversity (Hallet al., 1997;Salaet al., 2000).The habitat quality module in the InVEST model connects different land use types with threat sources, and calculates the habitat degradation according to the sensitivity of different habitats to threat sources, and then calculates the habitat quality(Gaoet al., 2018).The model formula for calculating the habitat quality based on the InVEST model is as follows:
WhereDxjis the habitat degradation ofxgrid in land categoryj,Qxjis the habitat mass of gridxin habitat typej;Hjis the habitat suitability of land categoryj; z is the normalized constant, usually 2.5;kis the half-saturation coefficient, generally half of the maximum value of habitat degradation.Model parameters refer to the InVEST Model Manual and related studies, as shown in Table 1 and Table 2 (Shanget al., 2022; Yanget al., 2018; Zhanget al., 2021;Zhaoet al., 2022).

Table 1 Impact scope and weight of threat sources in the study area
2.3.2 Adjustment service
Soil conservation refers to the regulatory erosion of the ecosystem to reduce the ability of sedimentoutput, protection and storage of soil (Costanzaet al.,1997).It is calculated based on the SDR module of the InVEST model, the calculation formula is as follows:
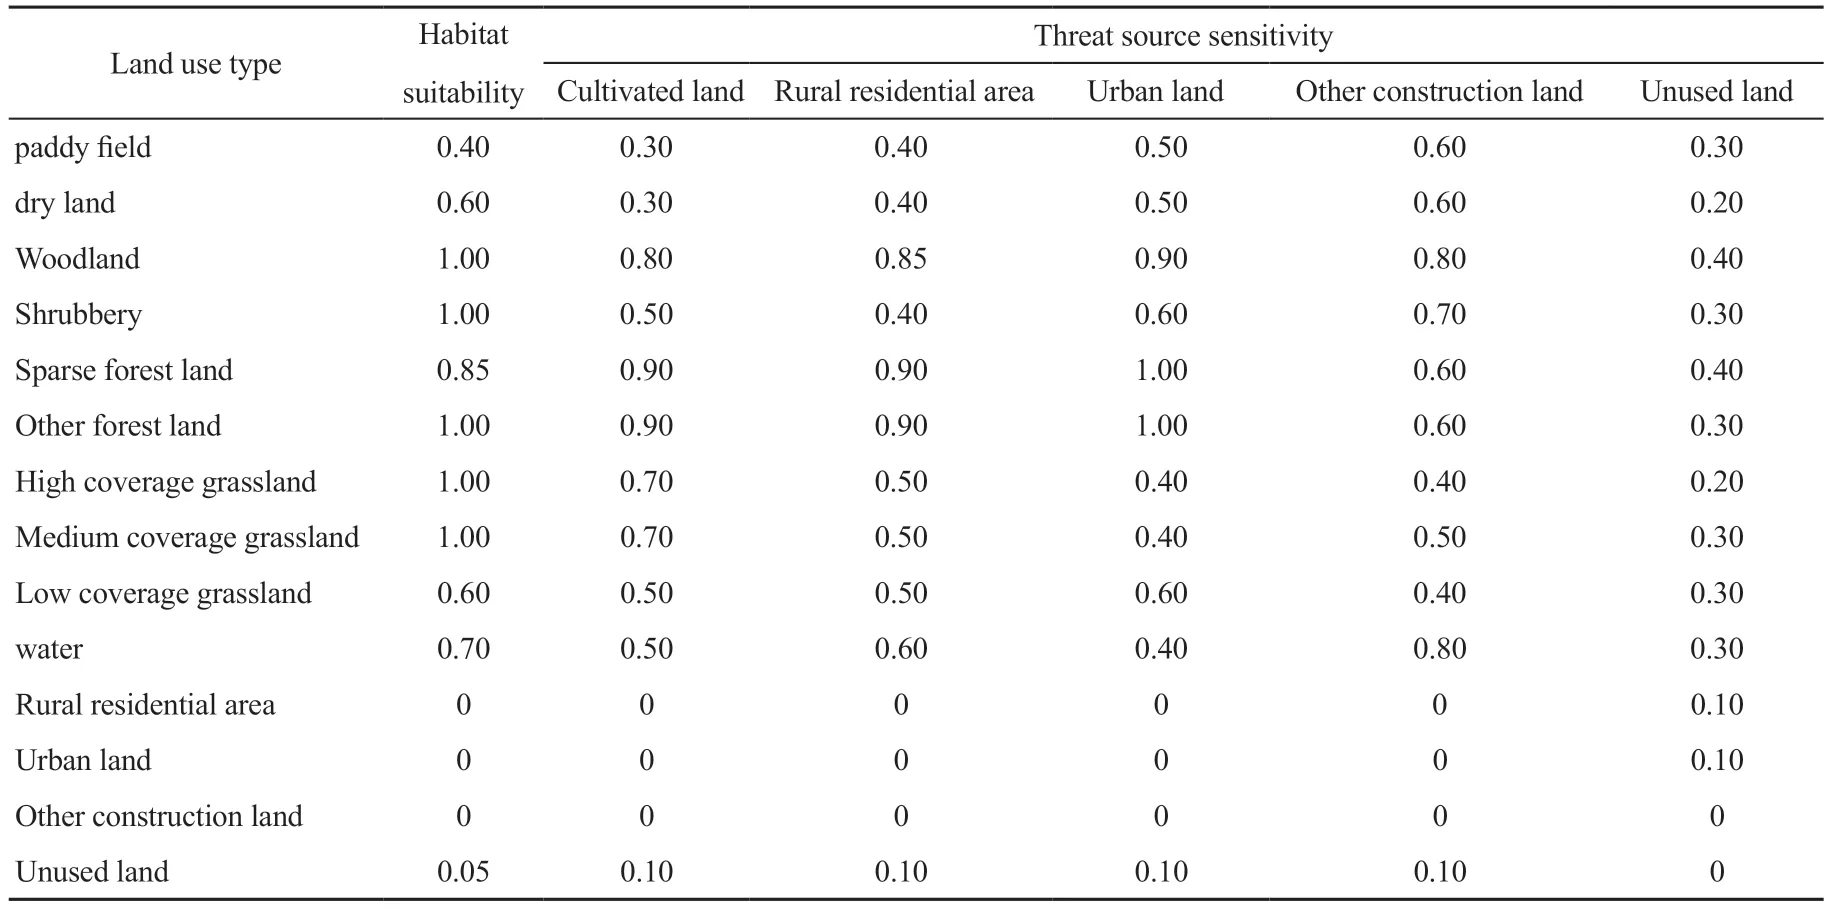
Table 2 Habitat suitability and sensitivity to threat sources of different land use types in the study area
WhereAmeans soil conservation (t/hm2·a),RKLSis potential soil erosion (t/hm2·a) andUSLEis actual soil erosion (t/hm2·a).The required basic data are rainfall erosion factorR, soil erosion factorK,vegetation cover and crop management factor C, soil conservation measures factor P, and topographic factor DEM.
TheRvalue of rainfall erosion factor is calculated by calculating the guidelines for soil loss of production and construction projects (MWR, 2018).The formula is as follows:
WheredRis the average annual rainfall erosion factor [MJ·mm/(hm2·h)] andpdis the average annual rainfall (mm).
Soil erodibilityKwas calculated by using EPIC model and the result was corrected according to Zhang Keli’s study with the following formula (Zhanget al.,2007):
WhereKepicis the soil corrosion ability before modification, andKis the soil corrosion after modification (t·h/MJ-1·mm-1).SAN,SIL,CLAandCorganicare the percentage content (%) of sand (0.05–2.00 mm),powder (0.002–0.050 mm), mucus (<0.002 mm)and organic carbon, respectively, includingSN= 1-SAN/100.Vegetation cover and crop management factors C, soil and water conservation measures factors P were obtained from relevant literature in Table 3(Zhaoet al., 2014; Wang, 2020; Yu, 2021; Jiang,2021).
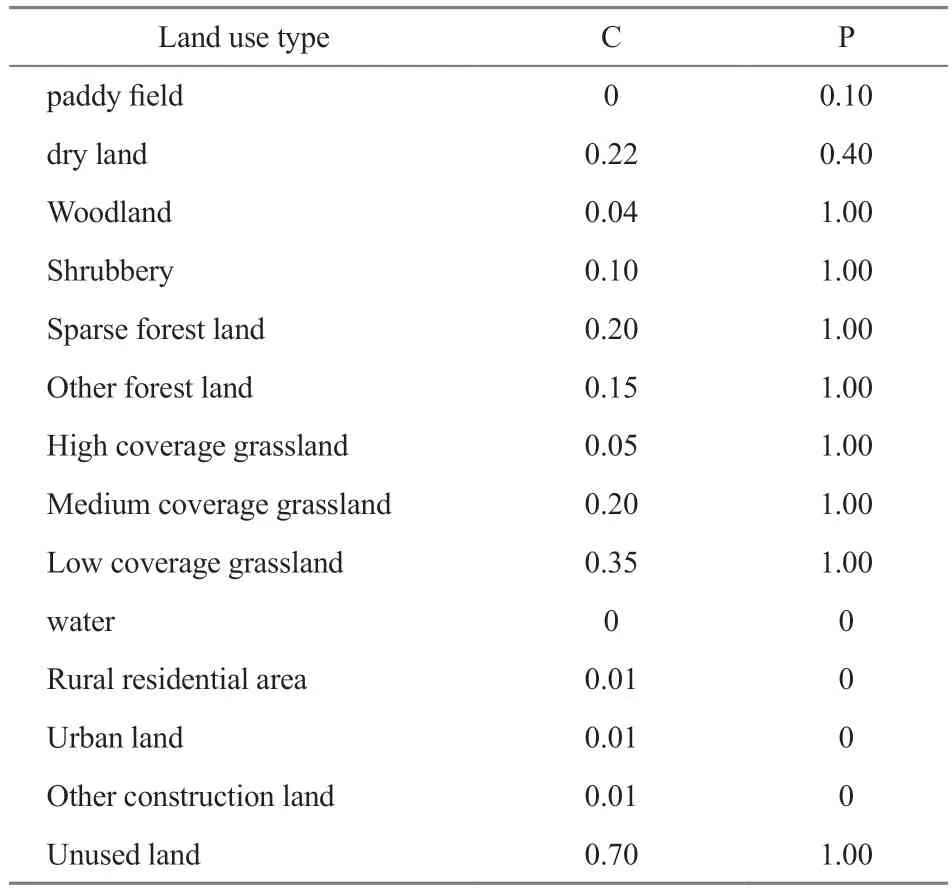
Table 3 C and P values of various land use types
Carbon storage is an important ecosystem service.The carbon reserve calculation module in the InVEST model is established based on the carbon density method, which can directly apply the land use map to the carbon reservoirs.The carbon reserve calculation formula is as follows:
WhereCtotalis the total carbon storage of the ecosystem;Cabove,Cbelow,CsoilandCdeadare aboveground part carbon density, underground part carbon density,soil carbon density and dead organic carbon density(t/hm2).The carbon density data were obtained by consulting the relevant regional literature and InVEST model guidelines (Donget al., 2017, Chang, 2021;Tanget al., 2008; Li, 2019; Zhanget al., 2016).Because the information of death organic carbon density cannot be accurately obtained, the death carbon density was set to 0 t/hm2(Table 4).
2.3.3 Supply service
Grain production is one of the most direct manifestations of ecosystem supply service; it has a high correlation with its vegetation cover index (NDVI).According to Caoet al.(2020), the total grain output was allocated according to the ratio between the grid NDVI value and the total NDVI value.The specific method is calculated by the following formula:
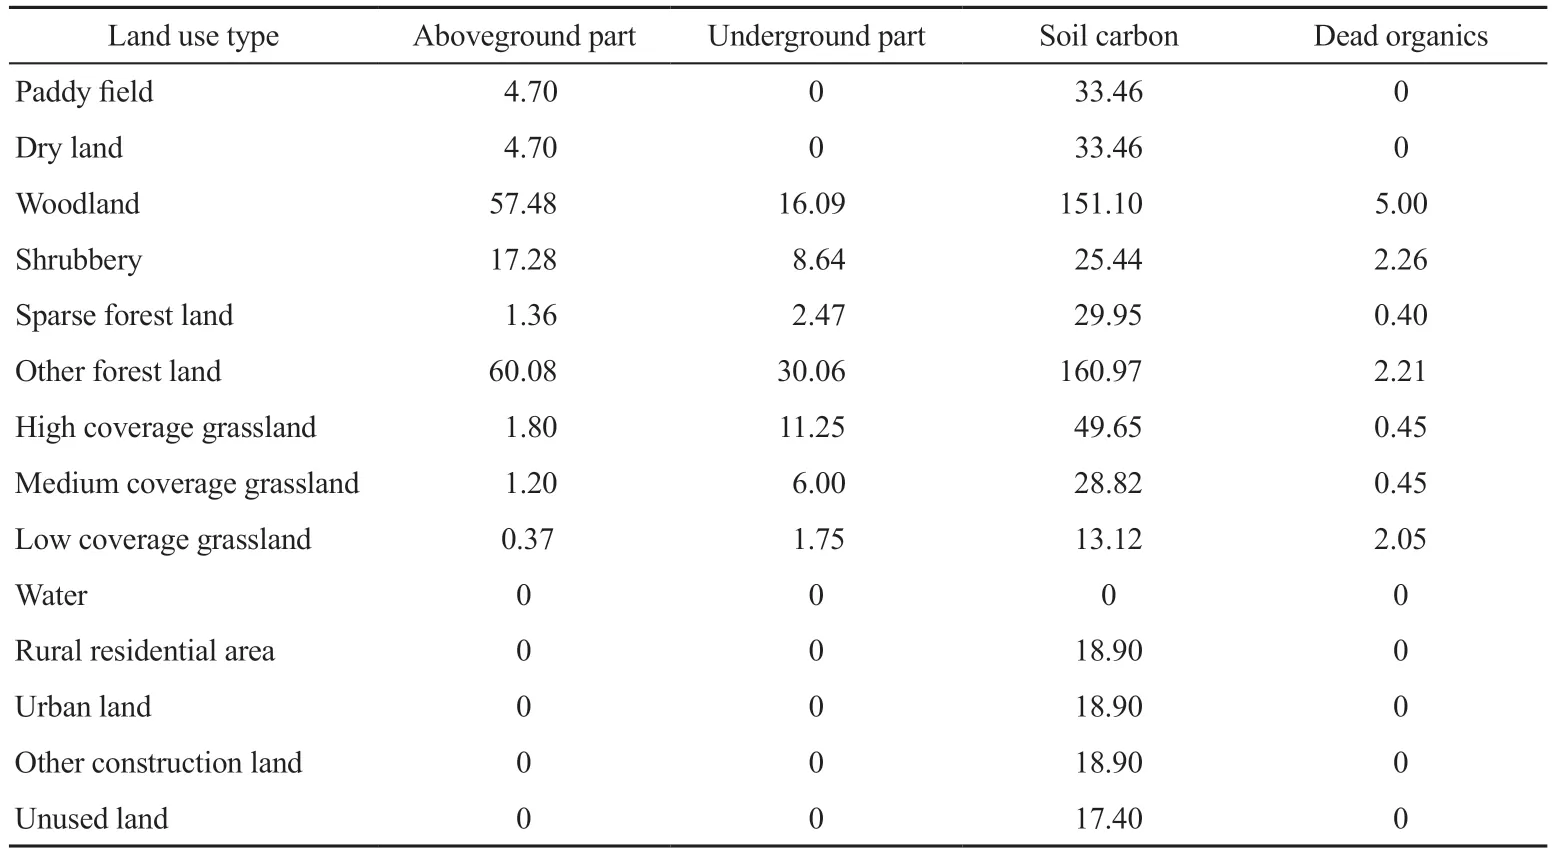
Table 4 Carbon density (t/hm2) of various land use types in the study area
WhereGiis the grain yield of gridi,Gsumis the total grain yield in the study area,INDVsumis the sum of the NDVI values in the study area, andINDVis the NDVI value of gridi.
2.4 Correlation analysis of ecosystem service and change in cultivated land area
Based on the township scale, used the Pearson correlation analysis to explore the correlation between the change of cultivated land area and the change of each ecosystem service, so as to clarify the mechanism of farmland spatial pattern on regional ecosystem service.
3 Results
3.1 Temporal and spatial change in cultivated land
3.1.1 Quantitative and structural change in cultivated land areas
Cultivated land was the most dominant land type in the study area, exceeding 76% of the total land area.Compared with the change of cultivated land around 2 000, the area of cultivated land experienced a change from increase to gradual decrease.Cultivated land increased by 29.85 km2first, and reduced by 18.78 km2,30.74 km2finally.
The pattern of cultivated land has changed significantly: The transfer volume of cultivated land in Lishu County was 186.81 km2, mainly for construction land(49.94%) and forest (38.3%); 167.17 km2was transformed into cultivated land from other land types, mainly from construction land (40.09%) and forest land(24.46%).Among them, the cultivated land area changed most significantly from 2000 to 2010, 145.76 km2has been transferred out, and 126.97 km2has been transferred into cultivated land.89.68 km2cultivated land has been occupied by the rapid expansion of construction land during this period.76.4 km2has been transformed into other land types, 74.97% of them was transferred into forest land, and 45.65 km2has been transformed into cultivated land from 2010–2020.
3.1.2 Spatial distribution and change in cultivated land
Based on the spatial superposition analysis of the land use maps of the four periods (Fig.2), it is found that: The reduced cultivated land area shows discontinuous distribution, and most of the increased area shows continuous distribution.(1) Among them, from 1990 to 2000, the spatial distribution of cultivated land change was obvious, mainly showing the characteristics of increasing patches and local dot decrease; (2) From 2000 to 2010, the spatial pattern of cultivated land change was scattered, scattered in the whole region, with no obvious concentration area;(3) From 2010 to 2020, although the spatial pattern of cultivated land change was still scattered, there were concentrated reduction area in Shenyang Town,Liujiaguanzi Town and Lishu Town.
3.2 Analysis of ecosystem service
3.2.1 Spatial change of ecosystem service
In terms of support service (Fig.3), the areas where the habitat quality in Lishu County increased significantly during the study period were mainly concentrated in Liujiaduanzi, Shenyang and Xiaochengzi towns, while in the northeast of Shenyang and Yushutai towns.
In terms of adjustment service (Fig.4), the amount of soil conservation all showed significant reduction in Baishan, Lamadian and Yushutai towns from 1990 to 2020, the degree of reduction from 2010 to 2020 increased significantly compared with the previous two stages.
The overall trend of carbon storage was shown in Fig.5: The increase of carbon storage was concentrated in the northeast of Shenyang Town and Yushutai Town from 1990 to 2000, and in Linhai Town, Liujiaguanzi Town from 2000 to 2020, indicated that the ecological construction measures are conducive to the increase of carbon storage.
In terms of supply service, distributed the grain output to each cultivated land grid and analyzed the spatial change of grain supply according to the division of towns.As shown in Fig.6, the change of grain supplywas most obvious from 1990 to 2000, there were two significantly increased parts in the south and north of the study area, while it showed the characteristics of spatial differentiation, which increased in the central part and decreased at the north and south parts from 2000 to 2010; the increase of grain supply was mainly concentrated in the strip areas in in the southeastern strip area from 2010 to 2020.

Table 6 Farmland transfer (km2) from 1990 to 2020 in Lishu County

Fig.2 Spatial distribution of cultivated land change from 1990 to 2020 in Lishu County

Fig.3 Spatial change of habitat quality (CHQ) from 1990 to 2020 in Lishu County

Fig.4 Spatial change of soil conservation (CSC) from 1990 to 2020 in Lishu County

Fig.5 Spatial change of carbon storage (CCS) from 1990 to 2020 in Lishu County
3.2.2 Quantitative change of ecosystem service
As shown in Table 7, carbon storage, soil conservation and grain production service in Lishu County all increased, while the habitat quality decreased.Carbon storage, habitat quality, and soil conservation all experienced quantitative change that first decreased and then increased, the increase of grassland and forest land played a key role in improving the overall carbon sequestration level of the region.The grain production increased year by year and then decreased.

Fig.6 Spatial change of grain production (CGP) from 1990 to 2020 in Lishu County
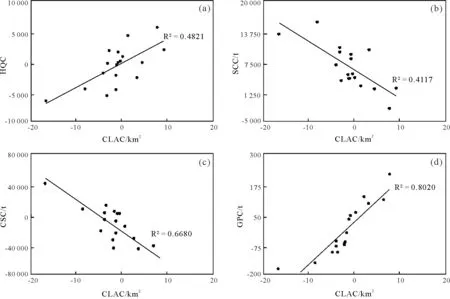
Fig.7 Correlation between cultivated land area change and ecosystem service change

Table 7 Ecosystem service of cultivated land area from 1990 to 2020 in Lishu County
3.3 Relationship between ecosystem service change and cultivated land area change
Based on the township scale, analyzed the correlation between ecosystem service change and cultivated area change (Fig.7 and Table 8).Among them,habitat quality and grain production were all positively correlated with cultivated land area, while soil conservation and carbon storage were negatively correlated with the change of cultivated land area.

Table 8 Correlation coefficients between cultivated land area change and ecosystem service change (ESC)
4 Discussion
Due to the change of the spatial pattern of cultivated land, the total amount of ecosystem service in some regions decreased, which is contrary to the“trinity” cultivated land protection strategy in China.In the study area, the cultivated land area accounts for about three-quarters of the total land area, so we need to pay attention to the spatial evolution of the cultivated land spatial pattern and the change of the regional ecosystem service.During the study period,driven by urbanization, part of cultivated land was converted to construction land, and the transformation of cultivated land to forest land also indicated that policies and measures such as returning farmland to forest land (Yao, 2013) had a significant impact on land use pattern, the spatial changes of the four ecosystem services were obvious.Further study of the relevant relationship between the two found that: Soil conservation decreased with the increase of cultivated land area.This is consistent with the conclusion that there was a negative correlation between cultivated land area and soil conservation when Liuet al.(2020)studied the function of soil conservation.Carbon storage was significantly negatively associated with cultivated land area.The conversion between cultivated land and forest land is the main reason for the change of carbon storage.During the implementation of the measures of returning farmland to forest land, in the area where cultivated land was converted into forest land, its carbon storage increased significantly.Habitat quality was positively correlated with cultivated land area.As one of the most important components of land use, cultivated land not only bears the function of food production, but also is the material basis for the realization of the ecology security, which is of great significance in the conservation of biodiversity(Pimentel, 2003).The decrease of grain sown area is the most important factor affecting regional grain production.Clarifying the utilization of cultivated land and its influence on the amount of grain production plays an important role in strengthening the protection of cultivated land and ensuring national food security.
5 Conclusions
From the perspective of cultivated land spatial pattern evolution, estimatedhabitat quality, soil conservation, carbon storage, grain production, revealed cultivated land spatial pattern evolution and regional ecosystem service from 1990 to 2020, provided a new research perspective for the rational overall planning of ecological security and sustainable use of cultivated land.The main conclusions are summarized as follows:
The area of cultivated land in Lishu County decreased by 19.67 km2.The reduced cultivated land area showed discontinuous distribution, and most of the increased area showed continuous distribution.The proportion of cultivated land transferred into construction land continues to be high, the transfer area to the forest land gradually increased with the passage of time.
The quantitative estimation results of ecosystem service show that the carbon storage, soil conservation and grain production in Lishu County all increased by 10.82%, 4.07% and 1.80%, respectively, and the habitat quality service decreased by 0.09%.Carbon storage, habitat quality, and soil conservation all experienced quantitative change that first decreased and then increased.
Based on the township-scale correlation analysis,habitat quality, grain production showed significant positive correlation with cultivated land area, while soil conservation and carbon storage showed significant negative correlation with cultivated land area.
- Global Geology的其它文章
- Exploring the first occurrence of Scincomorpha lizard from Nenjiang Formation (lower Campanian) of Jilin, Northeast China: a follow-up study
- Least-squares reverse time migration in visco-acoustic media based on symplectic stereo-modeling method
- Optimization design of conical reaction teeth of shear wave vibroseis vibration plate
- Characteristics and identification of weathering crust of Pennsylvanian volcanic rocks in Shixi area, Junggar Basin
- Geochemical characteristics of temperature and pressure of Paleozoic reservoir fluid inclusions in Xuanjing region,Lower Yangtze area

