
Combining controlled-release urea and normal urea with appropriate nitrogen application rate to reduce wheat stem lodging risk andincrease grain yield and yield stability
2023-10-16 01:32:42ZHANGGuangxinZHAODehaoFANHengzhiLIUShijuLIAOYunchengHANJuan
Journal of Integrative Agriculture 2023年10期
ZHANG Guang-xin ,ZHAO De-hao ,FAN Heng-zhi ,LIU Shi-ju ,LIAO Yun-cheng ,#,HAN Juan#
1 College of Agriculture,Shanxi Agricultural University,Taigu 030801,P.R.China
2 State Key Laboratory of Sustainable Dryland Agriculture, Shanxi Agricultural University,Taiyuan 030031,P.R.China
3 College of Agronomy,Northwest A&F University,Yangling 712100,P.R.China
Abstract A mixture of controlled-release urea and normal urea (CRUNU) is an efficient nitrogen (N) fertilizer type,but little is known about its effects on stem lodging resistance,grain yield,and yield stability of wheat. In this study,a 4-year field experiment (from 2017 to 2021) was conducted to analyze the effects of N fertilizer types (CRUNU and normal urea (NU))and application rates (low level (L),135 kg ha–1;medium level (M),180 kg ha–1;high level (H),225 kg ha–1) on population lodging resistance,basal internode strength,lignin content and synthetase activity,stem lodging resistance,grain yield,and yield stability of wheat. Our results showed that the two N fertilizer types had the highest lodging rate under high N application rates,and the M-CRUNU treatment showed the lowest lodging rate. Compared with NU,CRUNU improved the wheat population lodging resistance under the three N application rates,mainly related to improving wheat population characteristics and breaking the strength of the second basal internode. Correlation analysis showed that the breaking strength of the second basal internode was related to the physical characteristics,chemical components,and micro-structure of the internode. Compared with NU,CRUNU significantly increased wheat grain yield by 4.47,14.62,and 3.12% under low,medium,and high N application rates,respectively. In addition,CRUNU showed no significant difference in grain yield under medium and high N application rates,but it presented the highest yield stability under the medium N application rate. In summary,CRUNU,combined with the medium N application rate,is an efficient agronomic management strategy for wheat production.
Keywords: controlled-release urea,lodging,grain yield,yield stability,wheat
1.Introduction
Wheat feeds more than 40% of the world’s population (Liuet al.2020). Due to the continuous increase in population,there is an urgent need to increase wheat grain yield and yield stability;otherwise,it would lead to severe food security issues (Heet al.2017). Under intensive cultivation and management,the application of N fertilizer is undoubtedly one of the most important interventions to improve wheat productivity (Tilmanet al.2011;McLellanet al.2018). However,because N fertilizer management does not follow the four Rs (right rate,right source,right placement,and right timing) regulations in most cases,wheat productivity is unstable,leading to variations in yield production (Guoet al.2010;Leet al.2010;Yang L Set al.2021). Therefore,it is important to improve and stabilize wheat grain yield by optimizing N fertilizer management (Yaoet al.2021).
Currently,a variety of N fertilizer management strategies have been explored to meet the above questions,especially the combination of high-efficiency N fertilizer and appropriate N application rate (Grant 2005;Liet al.2017;Lyu Y Fet al.2021;Maet al.2021;Yaoet al.2021). Controlled-release urea (CRU) is considered to be the most effective high-efficiency N fertilizer (Abaloset al.2016),which can improve the synchronization between crop N demand and soil N supply by controlling the N release rate (Cuiet al.2013;Zhanget al.2019).Currently,some studies have shown that CRU can significantly increase crop yield compared to normal urea(NU) (Zhaoet al.2013;Gaoet al.2015;Zhanget al.2018). However,the slow N release in the early stage of CRU may not meet the needs of crops,especially wheat,which needs enough N to maintain effective tillering in the early stage of growth (Grantet al.2005;Maet al.2021).Some studies suggest that a combination of CRU and NU (CRUNU) is an effective way to solve this problem(Zhenget al.2016,2017). On the other hand,due to the high unit price of CRU,CRUNU also reduces the input of production costs. Zhanget al.(2021) found that CRUNU application can increase wheat yield and economic benefits and improve ecological and environmental conditions. Moreover,Zhenget al.(2016,2017) reported that even if CRUNU reduced the N application rate by 30% compared to NU,there was no significant change in wheat yield. Therefore,CRUNU,combined with rational N application rate,can be used as a potential N management strategy to improve wheat productivity. In addition,a good N fertilizer management strategy needs to consider its effect on crop yield stability;however,most of the current studies on CRUNU application in wheat are based on short-term experiments (≤ two growing seasons),which cannot accurately reflect the effect of CRUNU on the yield stability of wheat.
Natural disasters caused by climate or environmental changes are important factors affecting crop grain yield and yield stability;lodging is one of the most common natural disasters in wheat production. When lodging occurs,water,nutrients,and photosynthesis of wheat plants are reduced,increasing the development of several diseases and infestation of insect pests (Crook and Ennos 1994;Nakajimaet al.2008;Caoet al.2021),which severely reduces wheat grain yield. According to statistics,the grain yield loss of wheat is more than 27% during severe lodging (Liuet al.2014),and the grain quality is also severely reduced because of the increased accumulation of mycotoxins and deoxynivalenol (Nakajimaet al.2008).Stem lodging is the most common type of wheat lodging because wheat has a hollow and fragile second basal internode and a tall height far from the center of gravity (Caiet al.2019). Wheat stem lodging is mainly related to the physical characteristics (e.g.,stem diameter,stem length,and wall thickness),mechanical characteristics (breaking resistance),microstructure (vascular bundle),chemical components (lignin and its key synthase) of the second basal internode,and population characteristics (Penget al.2014;Chenet al.2018;Luoet al.2019;Wuet al.2019). Unsuitable field management measures increase the risk of wheat stem lodging,especially the inadequate application of N fertilizers (Chenet al.2011,2021). NU is the most commonly used N fertilizer in wheat production,and its N release is rapid and concentrated due to no envelope control. Often it is used in excess,which can easily lead to an overly large wheat population (Luoet al.2019). When the wheat population density is too large,it has poor internal ventilation,weak base light transmittance,and increased competition for production resources among individuals (Luoet al.2019),which leads to poor development of the basal internodes of wheat and thus,a weak lodging resistance. Some studies on optimizing N fertilizer management to improve the stem lodging resistance of wheat have been carried out,including optimizing application rate (Tripathiet al.2003b;Zhanget al.2017),application methods (Chenet al.2018),and application time (Wuet al.2019);however,most of these studies were based on NU,and similar information about CRUNU on wheat stem lodging is very limited.
Previous studies have also shown that,compared with NU,CRUNU can promote dry matter accumulation and strength of wheat stems (Huet al.2020) and reduce the number of populations by reducing ineffective tillers (Wanget al.2021). Therefore,we hypothesized that CRUNU could maintain wheat yield and improve lodging resistance by reducing the N application rate within a certain range compared with NU. The purpose of this study was to(1) investigate the effect of CRUNU and N application rates on the stem lodging resistance of wheat and its mechanism and (2) clarify the effect of CRUNU and N application rates on wheat grain yield and yield stability.An in-depth understanding of relevant information can provide a theoretical basis for formulating reasonable N fertilizer management strategies for wheat production.
2.Materials and methods
2.1.Study site and experimental design
A field experiment was conducted over four growing seasons (2017–2018,2018–2019,2019–2020,and 2020–2021) at the Caoxinzhuang Experimental Station(34°30´N,108°09´E) in Yangling,Shaanxi Province,China. The soil type is anthrosol (according to the Food and Agriculture Organization soil taxonomy),and the soil physical and chemical characteristics of the top layer (0–40 cm) determined in 2017 are listed in Table 1. Weather conditions recorded by an automatic weather station near the experimental site during the four growing seasons are shown in Fig.1.
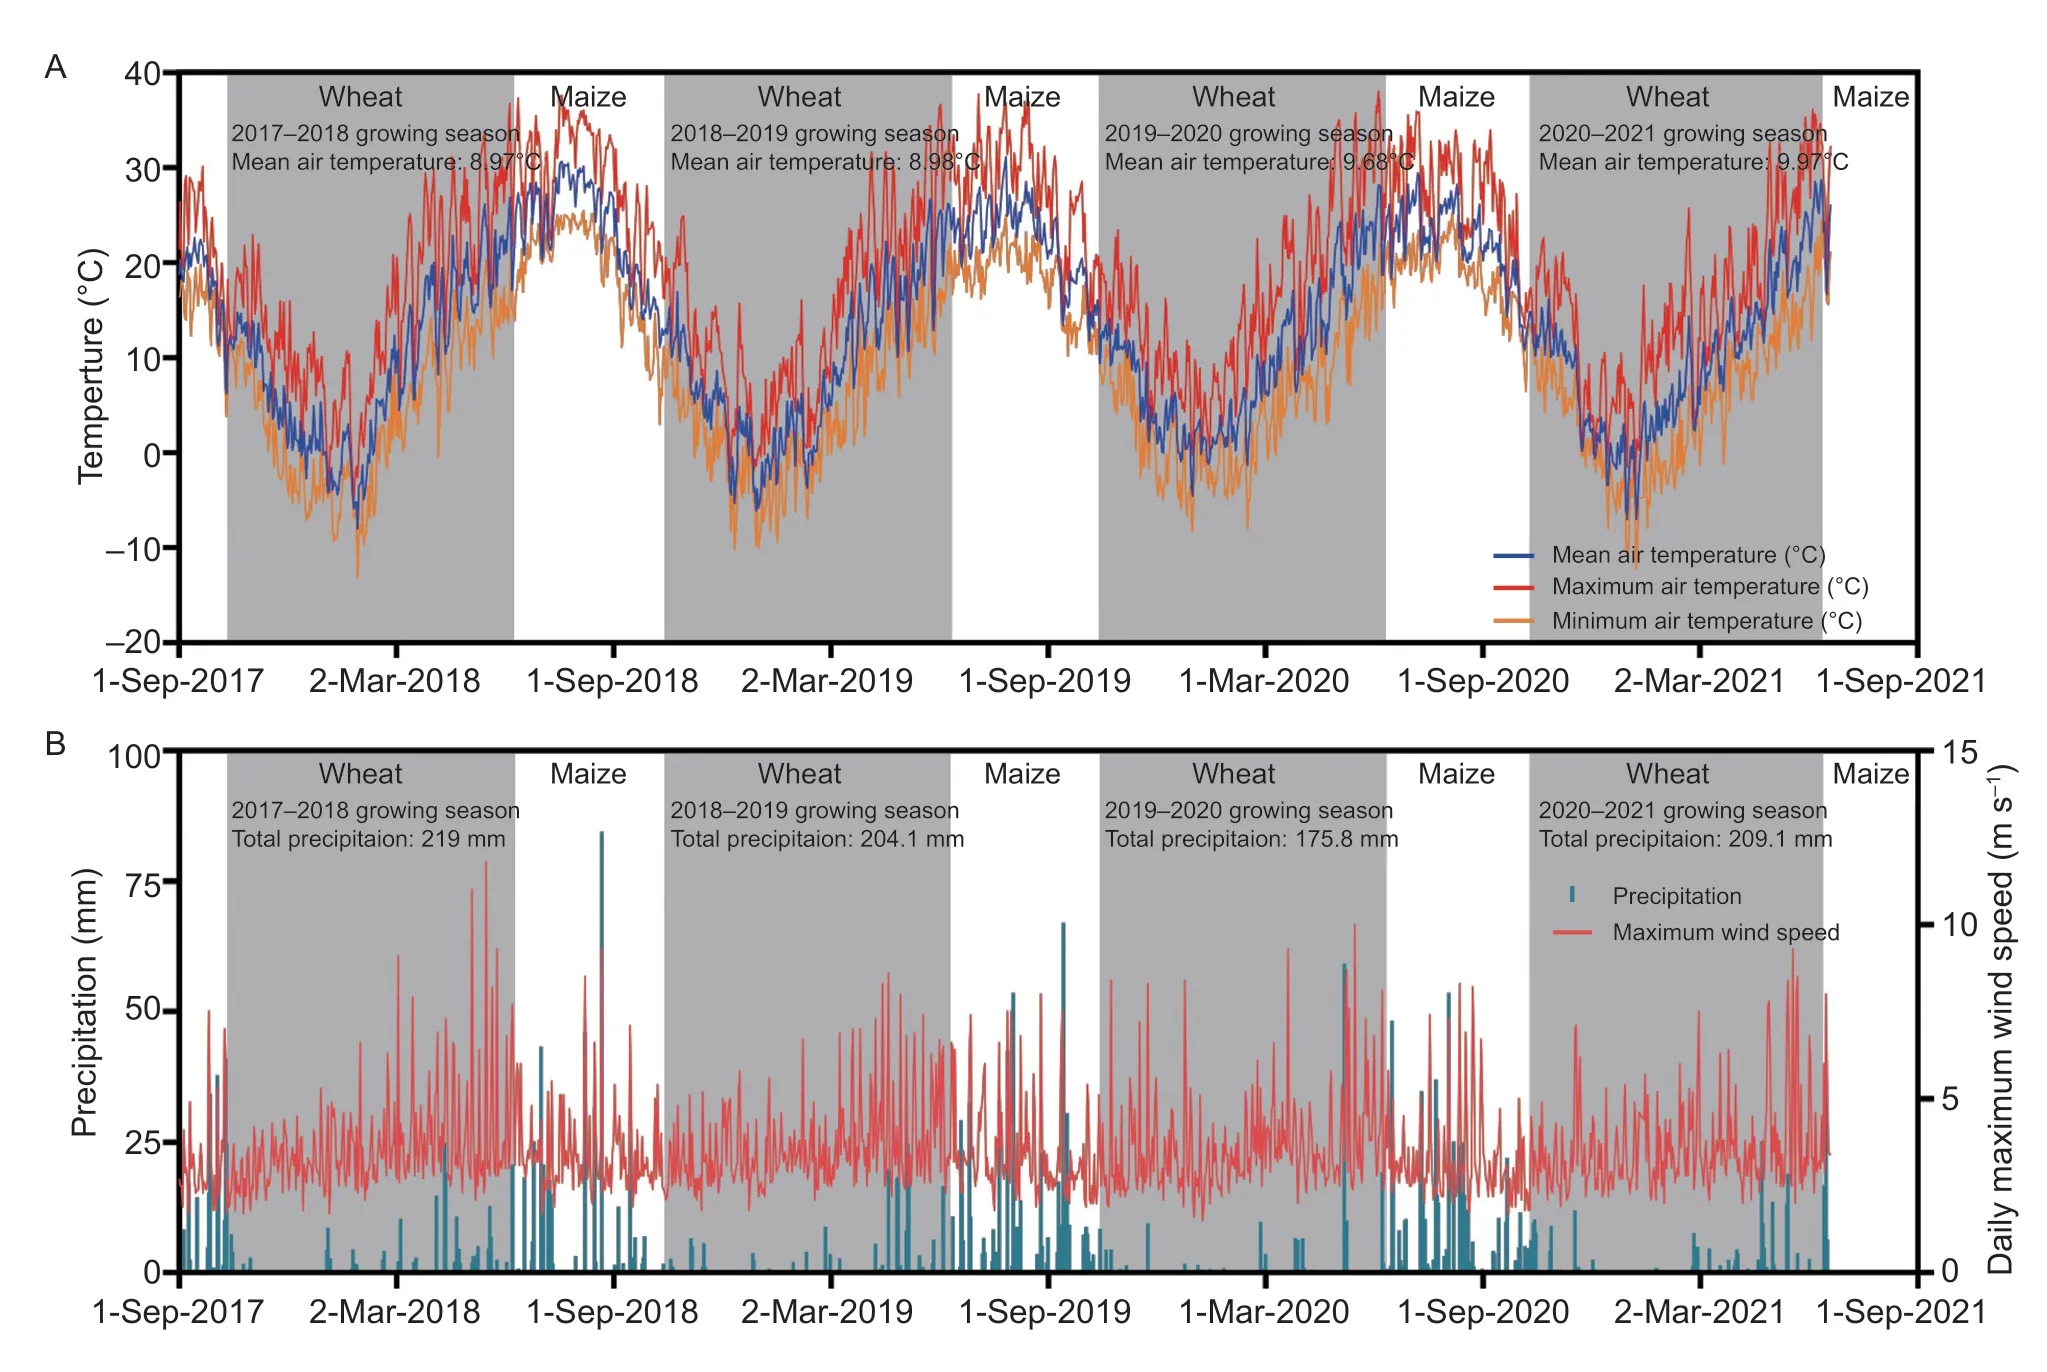
Fig.1 Climatic parameters (A,temperature;B,precipitation and daily maximum speed) during the 2017–2021 winter wheat growing seasons.
The experiment was conducted using a two-factor randomized block design. The two factors were N fertilizer type and N application rate,in which the N fertilizer type included NU and CRUNU (the proportion of N contributed by CRU and NU was 1:1). Three N application rates were tested for each N fertilizer type:low level (L)=135 kg N ha–1,medium level (M)=180 kg N ha–1,and high level (H)=225 kg N ha–1. The survey found that the N application rate of 225 kg ha–1was generally adopted by local farmers and was set as the high N application rate. Based on this level,the reduction of 20 and 40% was set as the medium and low N application rates,respectively. Six treatments were used: L-NU,L-CRUNU,M-NU,M-CRUNU,H-NU,and H-CRUNU.Each treatment was repeated three times,with a total of 18 plots,each with an area of 40 m2(8 m long and 5 m wide). To avoid mixing fertilizers among different treatments,high ridges (20 cm wide) were built around each plot,with a 1-m alley between adjacent plots.

Table 1 Soil physical and chemical characteristics of the top 0–40 cm soil layers in 2017
The N contents in NU and CRU were 46 and 34%,respectively. The N release time of CRU was 180 d,provided by Shaanxi Kingenta Agricultural Technology Co.,Ltd. The N release peak of CRU in the present study appeared approximately 90 days after application,which was affected by precipitation and soil temperature.The application rates of phosphate fertilizer (P2O5) and potash fertilizer (K2O) in all treatments were 90 and 75 kg ha–1,respectively. The fertilizers used in this study were all applied to the soil at one time in the form of a base fertilizer. Xiaoyan 22,a widely popular wheat variety in this region,was used as the experimental plant material,and the seeding rate was 172.5 kg ha–1. The sowing time for 2017–2018,2018–2019,2019–2020,and 2020–2021 growing seasons was October 12,October 14,October 15,and October 10,respectively,and the harvest times were June 9,June 12,June 14,and June 12,respectively. Due to the lack of precipitation during the seedling stage,which led to drought,sprinkler irrigation was carried out as supplementary irrigation of 50 mm3. During the entire growing season,chemical treatments were applied to control diseases,pests,and weeds.
2.2.Measurements and calculations
Measurement of morphological traits and lodging ratePlant height and center of gravity height of 30 wheat plants in each plot were measured at the flowering stage.The height of the center of plant gravity refers to the distance from the culm (with spike,leaf,and sheath) base to the balance fulcrum. Simultaneously,the wheat stem number inside 1 m2in each plot (excluding the edge row)was counted.
To determine the lodging rate before the wheat harvest was calculated using the following eq.(1) referring to the description of Penget al.(2014):
Measurement of wheat population lodging resistance,breaking strength of second basal internode and culm lodging resistance index (CLRI)The method used to determine wheat population lodging resistance was modified from Caiet al.(2019). The primary procedure is described as follows (a schematic is shown in Appendix A): six sampling points were randomly selected in each plot in the area within the edge rows at the flowering stage and 30 days after flowering (DAF). The stem strength tester was used to slowly apply transverse(F1) or longitudinal (F2) force perpendicular to the height of the center of gravity of a 20-cm long wheat row until the wheat plant was pushed flat on the ground and the peak value recorded by the tester was taken as the lodging resistance of the wheat population. We modified the straw strength tester by adding a small wooden stick(25 cm long,which was less than 10 g with less than 0.1 N of gravity was ignored,as its influence on F1 or F2 was the minimum) in front of the pressure probe;a double-sided tape was attached to the stick to prevent the height of the center of gravity from shifting during the pushing process.
At the flowering stage,15 and 30 DAF,15 marked stems in each plot were sampled,and the breaking strength of the second basal internode was measured using a stalk strength tester (Beijing Shunda Co.,Ltd.,China). The support columns of the stalk strength tester were adjusted to be 5 cm apart,and then the stem nodes without the leaf sheath were placed on the support columns. The slide bar was slowly pressed down until the internode broke,and the peak value recorded by the tester was the breaking strength (Chenet al.2018).
Referring to Caiet al.(2019),the CLRI was calculated using the following eq.(2):
The fresh weight of the plant was the weight of the ground section of the shoot,with the spike,leaf,and sheath.
Measurement of physical characteristics of the basal second internodeAt the jointing stage,100 wheat stems with uniform growth were labeled in each plot. According to the method described by Caiet al.(2019) and Penget al.(2014),20 labeled plants were selected from each plot at 15 DAF to determine the length,diameter,wall thickness,and mass density of the second basal internode. The mass density was the ratio of the dry matter weight to the length of the second basal internode.
Measurement of lignin content,enzyme activity,and vascular bundlesAt the flowering stage,15 and 30 DAF during the 2018–2019 and 2019–2020 growing seasons,10 labeled stalks were taken from each plot,and the second basal internode of the stalks was dried to a constant weight and then pulverized into powder with a powder sampler. The corresponding kit was used for the lignin determination. During the 2018–2019 growth season,10 additional second basal internodes were collected and stored at–40°C for the determination of the activities of tyrosine ammonia-lyase (TAL),phenylalanine ammonia-lyase (PAL),and peroxidase(POD). The enzyme activity was also measured using the corresponding kits,which were manufactured by Suzhou Keming Biotechnology Co.,Ltd.(Hangzhou,China).
At 15 DAF in the 2018–2019 growing season,six basal second internodes (removing the stem sheath) of labeled stalks were sampled in each plot and stored in a centrifuge tube with formaldehyde-acetic acid-ethanol(FAA) fixative. The tubes were placed in a refrigerator at 4°C until further analysis. The cross-section of the second basal internode was cut using transverse paraffin,and the slices were stained with safranin O-fast green cartilage.Stained slices were mounted on a glass slide and then photographed using an Olympus BX51 microscope(Olympus China Co.,Ltd.,Beijing,China) under a 40×lens to determine the number of large and small vascular bundles. Image analysis software (Image-Pro Plus 6.0;Media Cybernetics,Inc.,Rockville,MD,USA) was used to measure the total area of the large and small vascular bundles (mm²).
Grain yield and yield stabilityAt the maturity stage of each growing season,2-m2plants were manually collected from each plot to determine grain yield. After air-drying,the grains were threshed using a threshing machine and then weighed. Subsamples of 50 g grain were oven-dried at 105°C for 30 min and then at 65°C for 48 h to calculate the dry weight. Grain yield was expressed as the dry weight.
Yield sustainability index (YSI) and coefficient of variation (CV) were used to describe yield stability. The YSI was calculated using empirical eq.(3) (Mannaet al.2005).
whereYmeanis the mean wheat grain yield,Ystdis the standard deviation of grain yield across the entire duration(years),andYmaxis the maximum observed grain yield.
CV was calculated using the following eq.(4) (Xuet al.2019):
whereYstdis the standard deviation of wheat grain yield of a particular treatment over the 4-year experiment,andYMis the mean yield of that treatment over the same period.
2.3.Statistical analysis
A two-way analysis of variance was used to compare the differences between treatments using SPSS 16.0.The means were compared using the least significant difference test atP=0.05 orP=0.01. Pearson’s correlation analysis was performed using SPSS 16.0. GraphPad Prism (version 8.0.1) was used to draw the images in this study.
3.Results
3.1.Weather conditions
The meteorological conditions of the four wheat growth periods are shown in Fig.1. Although the trend of mean daily air temperature was mainly constant,there were differences in the average daily temperature. The mean daily air temperatures in the wheat-growing seasons 2017–2018,2018–2019,2019–2020,and 2020–2021 were 8.97,8.98,9.68,and 9.97°C,respectively (Fig.1-A).The total precipitation in 2017–2018,2018–2019,2019–2020,and 2020–2021 for wheat-growing seasons was 219.0,204.1,175.8,and 209.1 mm,respectively.Precipitation was often accompanied by strong winds,especially during the late growth period of wheat (Fig.1-B),which increases the lodging risk of wheat.
3.2.Effects of N fertilizer type and N application rate on lodging of wheat
Lodging rateLodging did not occur in winter wheat during the 2019–2020 growing season due to low rainfall and low frequency of strong winds (Fig.1),but lodging to varying degrees occurred in the other three growing seasons (Fig.2). The lodging rates of wheat in the 2017–2018 and 2018–2019 growing seasons were 10.83–20.80% and 18.10–30.02%,respectively. In the 2020–2021 growing season,lodging was the most severe,with a lodging rate of 41.28–82.10% (Fig.2-D).The lodging rate was significantly affected by the N application rate and N fertilizer type (P<0.01). In the three growing seasons when lodging occurred,the lodging rates of both types of N fertilizers under high N application rates were significantly higher than those under low and medium N application rates (P<0.01). Under low and high N application rates,lodging rates of wheat were not significantly different between the two types in most cases,but CRUNU significantly decreased lodging rates under medium N application rates (Fig.2-A,B,and D).
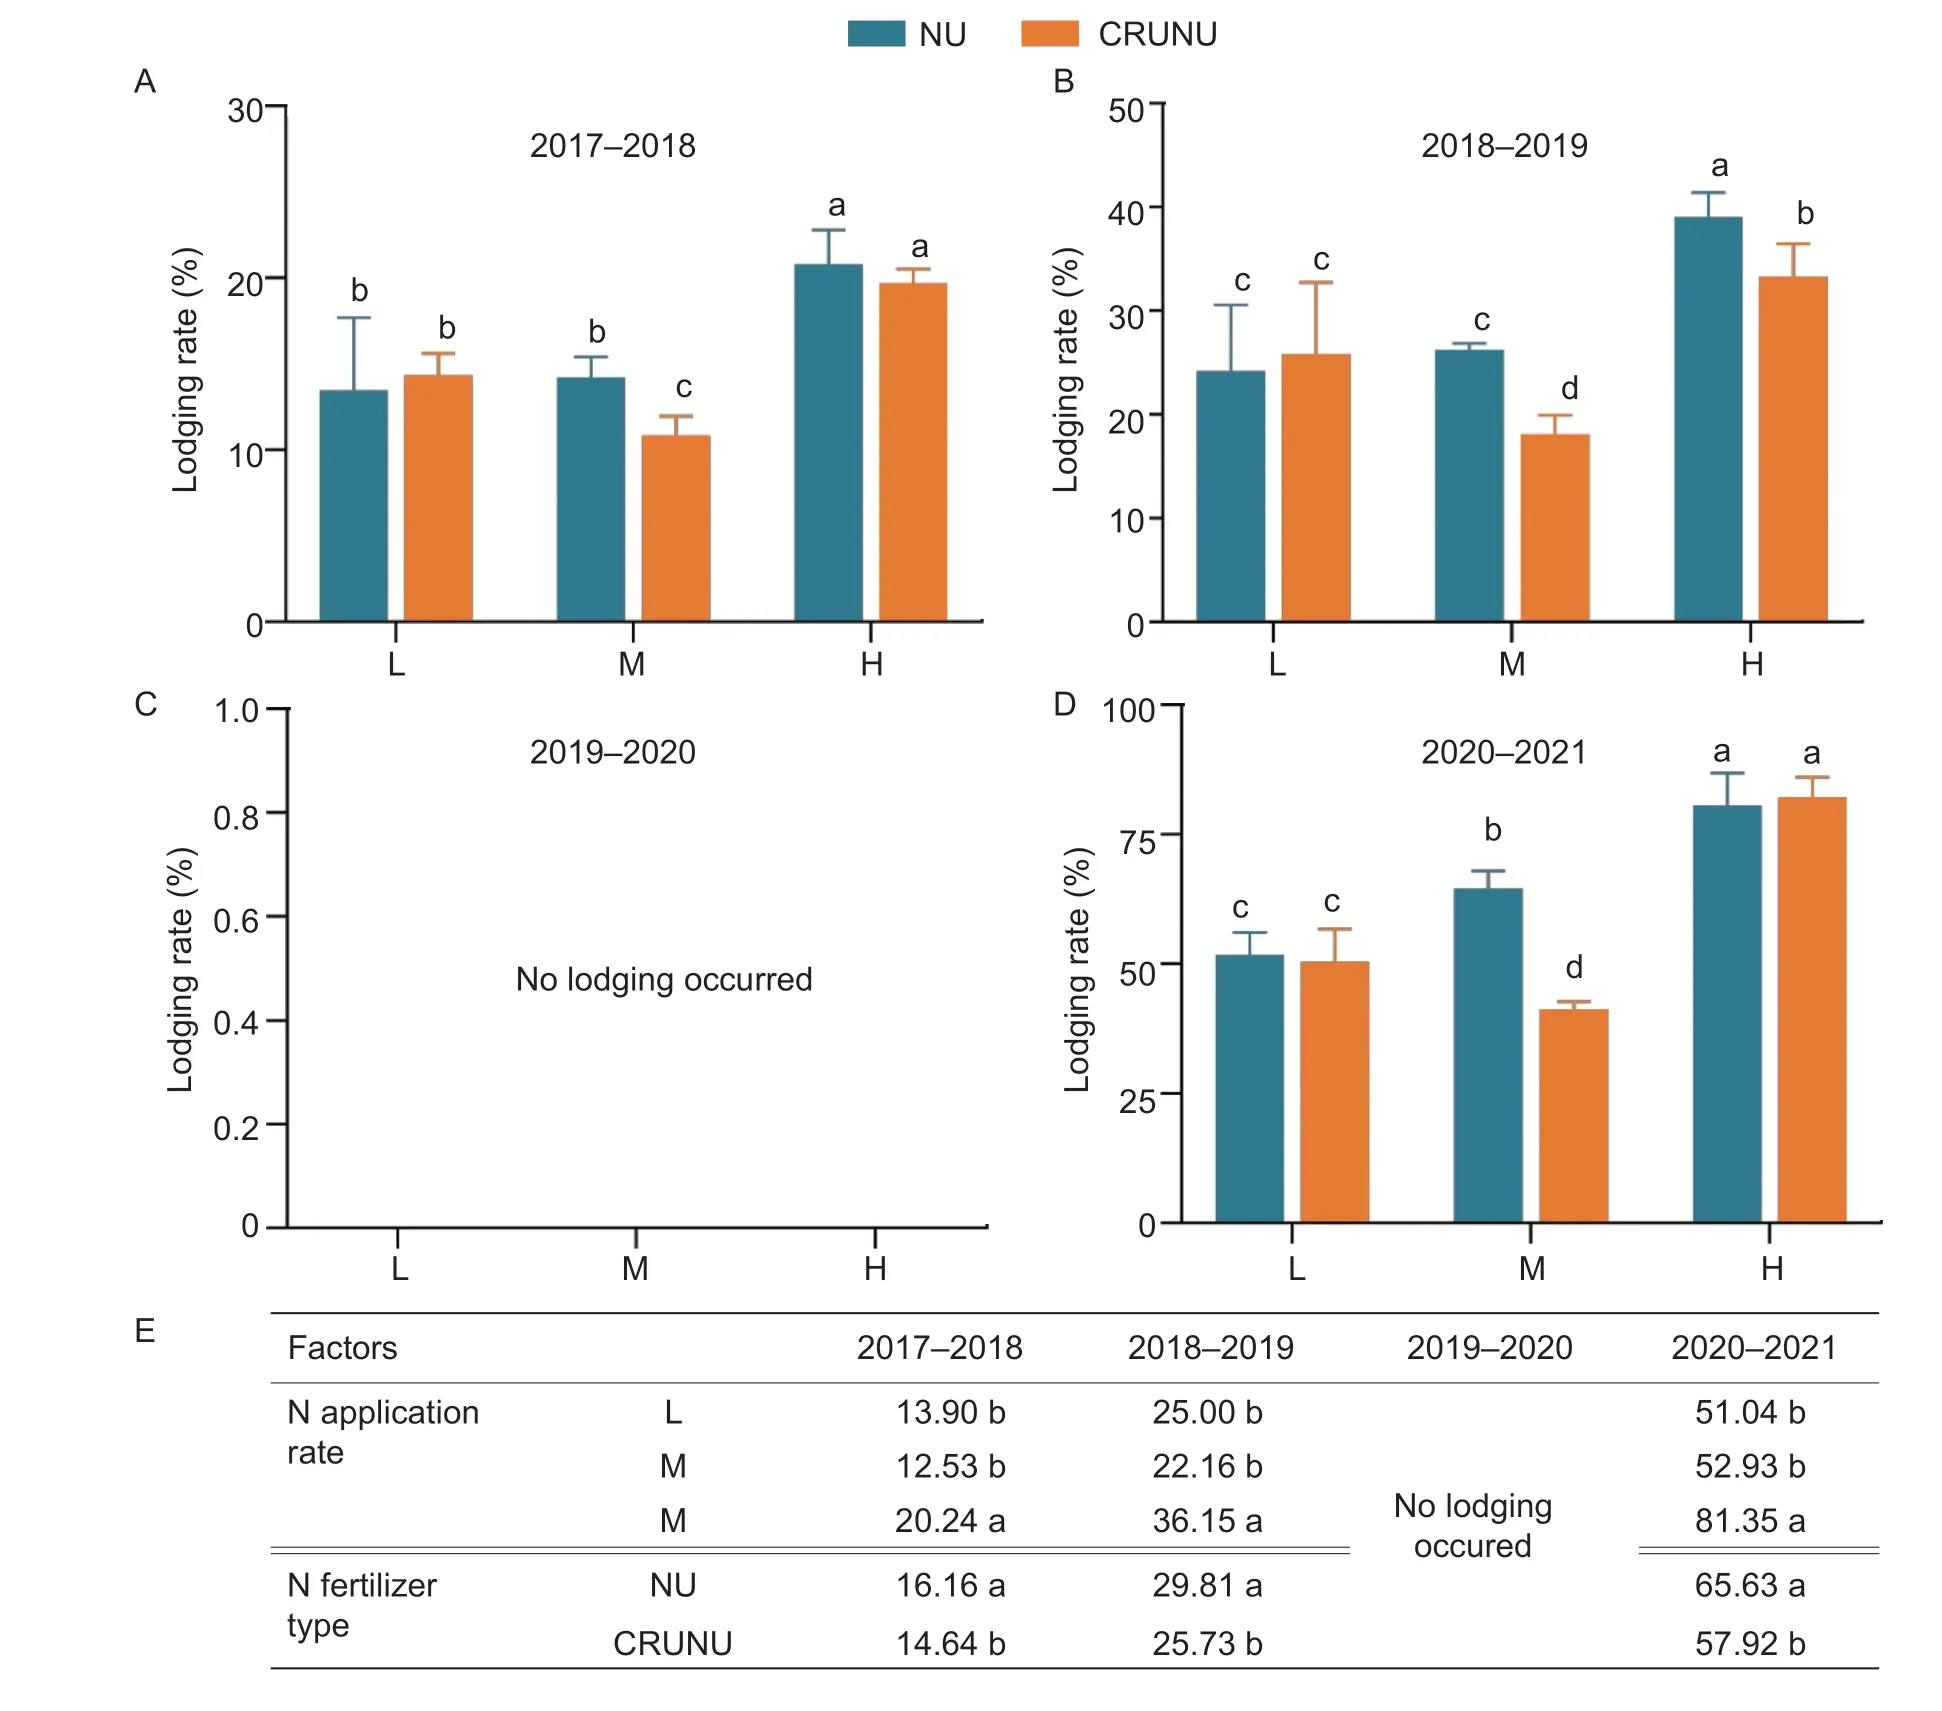
Fig.2 Lodging rate of wheat under different N fertilizer treatments during 2017–2018 (A),2018–2019 (B),2019–2020 (C),and 2020–2021 (D) growing seasons. Vertical bars above the mean values refer to standard error (n=3). Different lowercase letters show significant differences between the treatments or factors. E shows the differences among the factors. NU and CRUNU refer to normal urea and a mixture of normal urea and controlled-release urea,respectively. L,M,and H refer to low,medium,and high N application levels,respectively.
Mechanical characteristicsThe lodging resistance(F1 and F2) of the wheat population at the flowering stage and 30 DAF in the 2018–2019,2019–2020,and 2020–2021 growing seasons are shown in Fig.3. The lodging resistance of the wheat population at 30 DAF was lower than that at the flowering stage. In the three growing seasons,regardless of the N fertilizer type,the population lodging resistance was the strongest under the medium N application level,followed by the high and low N application rates (Fig.3). Compared with NU,CRUNU increased F1 by 8.30,10.50,and 3.41% under low,medium and high N application levels,respectively,and increased F2 by 3.07,8.31,and 4.86%,respectively.
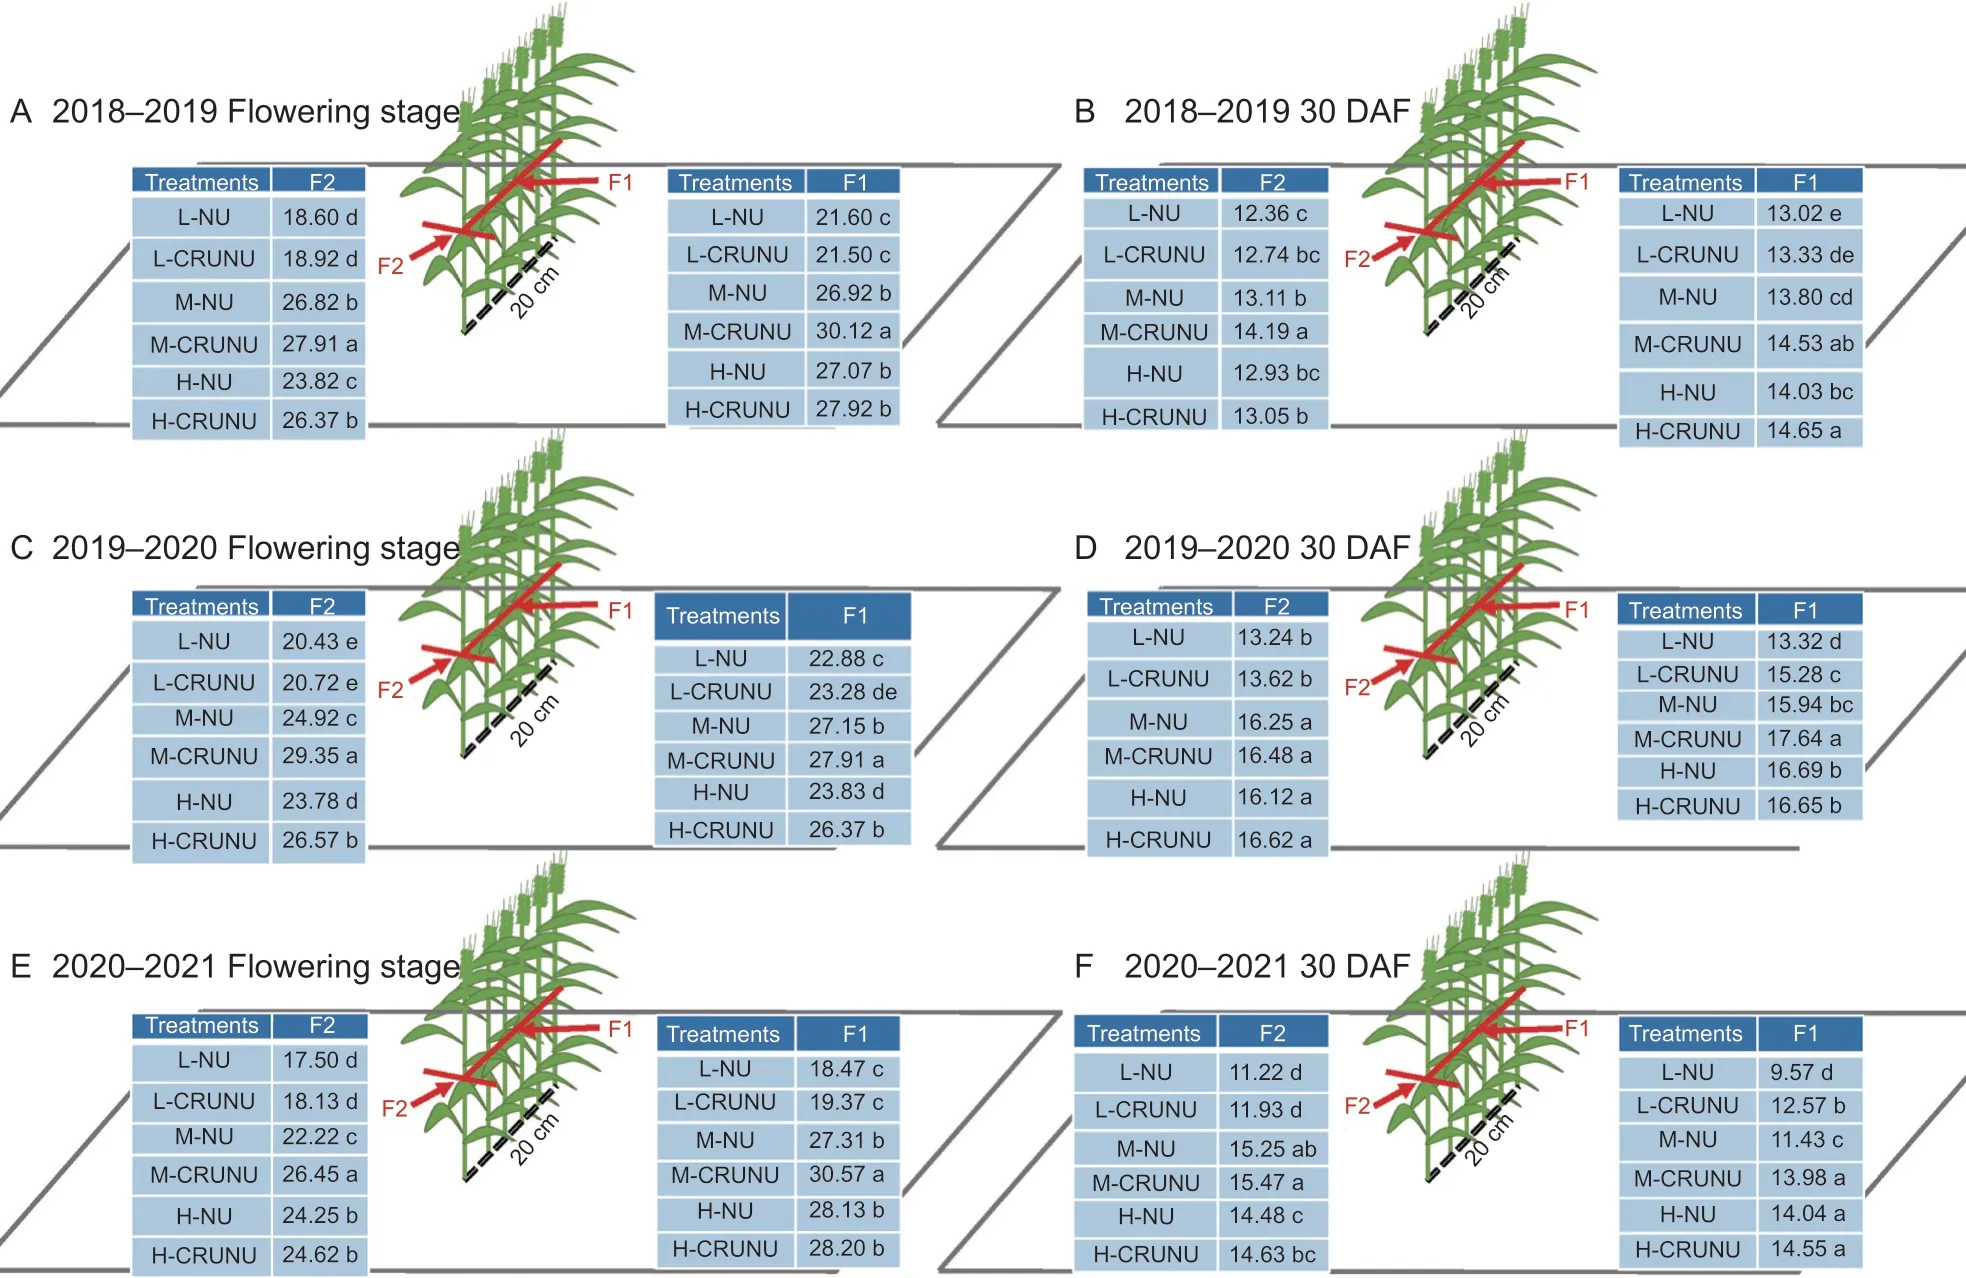
Fig.3 Lodging resistance of wheat population under different N fertilizer treatments at flowering stage and 30 days after flowering(DAF) during 2018–2019 (A and B),2019–2020 (C and D),and 2020–2021 (E and F) growing seasons. F1 and F2 refer to transverse and longitudinal force,respectively. NU and CRUNU refer to normal urea and a mixture of normal urea and controlled-release urea,respectively. L,M,and H refer to low,medium,and high N application levels,respectively. Different lowercase letters show the significant differences between the N fertilizer treatments.
The breaking strength of the second basal internode and CLRI at three time points during the later growth stage (flowering stage,15 DAF,and 30 DAF) are shown in Table 2. In the three growing seasons,with the advancement of the growth process of wheat after anthesis,the breaking strength of the second basal internode and CLRI first increased and then decreased.In most cases,the breaking strength of the second basal internode and CLRI were significantly affected by the N application rate and N fertilizer type. Regardless of the N fertilizer type,the breaking strength of the second basal internode and CLRI were the highest under the medium N application rate,but they were the lowest under the high N application rate. Under the same N application rate,CRUNU increased the breaking strength of the second basal internode and CLRI (Table 2). Integrating the three growing seasons,under low,medium,and high N application rates,compared with NU,CRUNU increased the breaking strength of the second basal internode by 1.65–25.46%,4.92–44.25%,and 3.07–31.45%,respectively,and increased CLRI by 7.74–12.31%,4.10–11.87%,and 0.63–15.18%,respectively (Table 2).
Wheat population characteristicsIn the four growing seasons,the center of gravity of wheat plants increased with the increase in plant height (Fig.4-D),and the plant height and center of gravity were the highest in the 2020–2021 growing season. Plant height and center of gravity height seemed to be affected only by N application rate and not by N fertilizer type,and both increased with the increase in N application rate (Fig.4-A and B). Consistent with the plant height and the center of gravity,the stem number per unit area also increased significantly with the increasing N application rate (Fig.4-C).
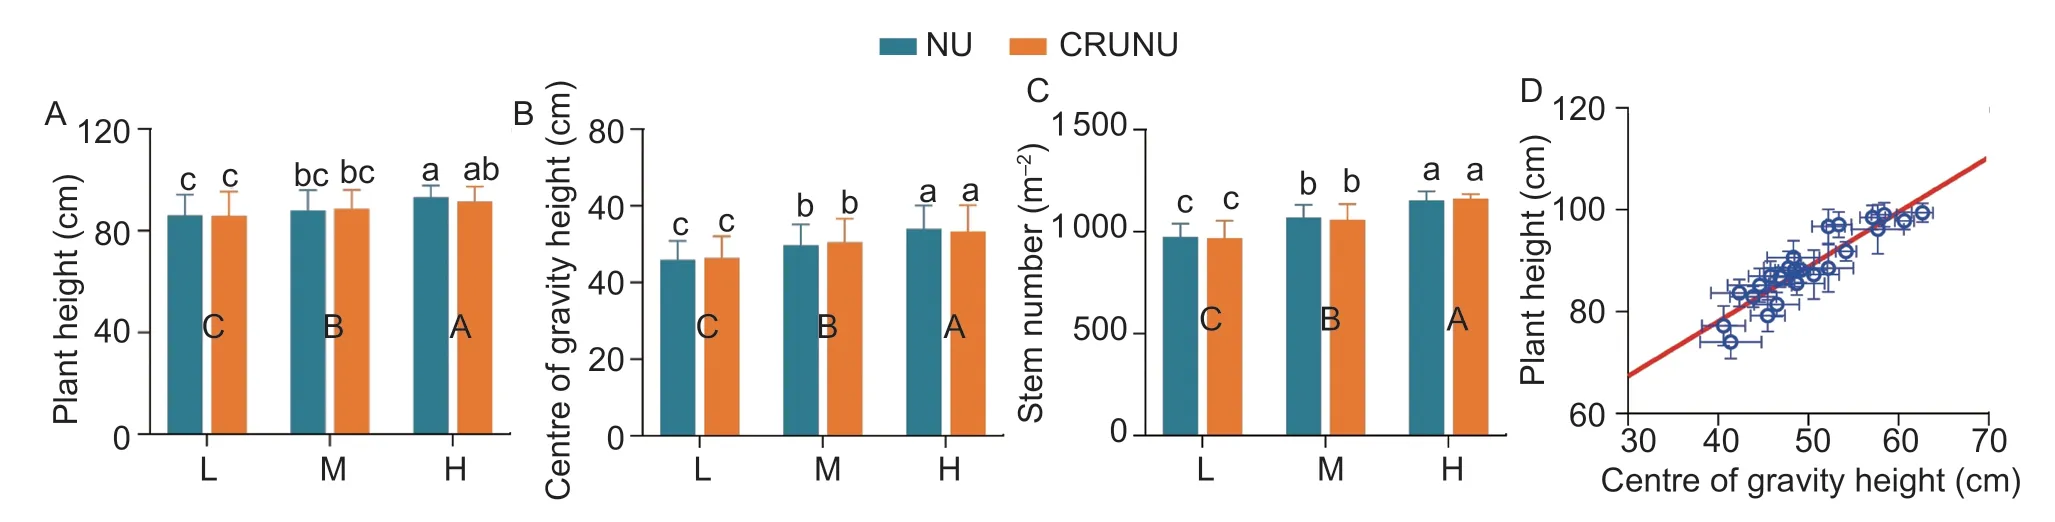
Fig.4 Plant height (A),center of gravity height (B),and stem number (C) of wheat under different N application rates and N fertilizer types. D shows the relationship between the center of gravity height and plant height. NU and CRUNU refer to normal urea and a mixture of normal urea and controlled-release urea,respectively. L,M,and H refer to low,medium,and high N application levels,respectively. The data presented in the Fig.is a four-year average. Vertical bars above the mean values refer to standard error(n=3). Different lowercase letters show significant differences between the treatments at P<0.05 level,and different capital letters indicate significant differences between N application rates at P<0.05 level.
Physical characteristics and micro-structure of the second basal internodeThe physical characteristics of the second basal internode in the 2018–2019,2019–2020,and 2020–2021 growing seasons are shown in Table 3.The increase in the N application rate significantly increased the internode length,but the N fertilizer type had no significant effect on length. The diameter,wall thickness,and mass density of the second basal internode were also affected by the N application rate,which was the largest under medium N application rates and the smallest under high N application rates. N fertilizer type had no significant effect on internode diameter and wall thickness in the 2018–2019 and 2019–2020 growing seasons but had a significant effect on that in 2020–2021. The average data of the three growing seasons showed that compared with NU,CRUNU increased the wall thickness by 6.52,8.00,and 2.17%,and increased the mass density by 8.25,5.76,and 12.90% under low,medium,and high N application rates,respectively.
The number and area of large and small vascular bundles were the highest under medium N application rates,followed by low and high N application rates(Table 4). In most cases,under the same N application rate,CRUNU increased the number and area of large and small vascular bundles compared to NU.
Lignin and its key enzymes for synthesisDuring the 2018–2019 and 2019–2020 growing seasons,both the N application rate and N fertilizer type significantly affected the lignin content of the second basal internode at three time points (flowering stage,15 DAF,and 30 DAF)(Fig.5-A and B). In most cases,the lignin content was significantly affected by the N application rate and N fertilizer type,as well as by the interaction of both. The lignin content was the highest at a medium N application rate,followed by low and high N application rates. At the same N application rate,CRUNU increased thelignin content compared to NU,especially at medium N application rates.
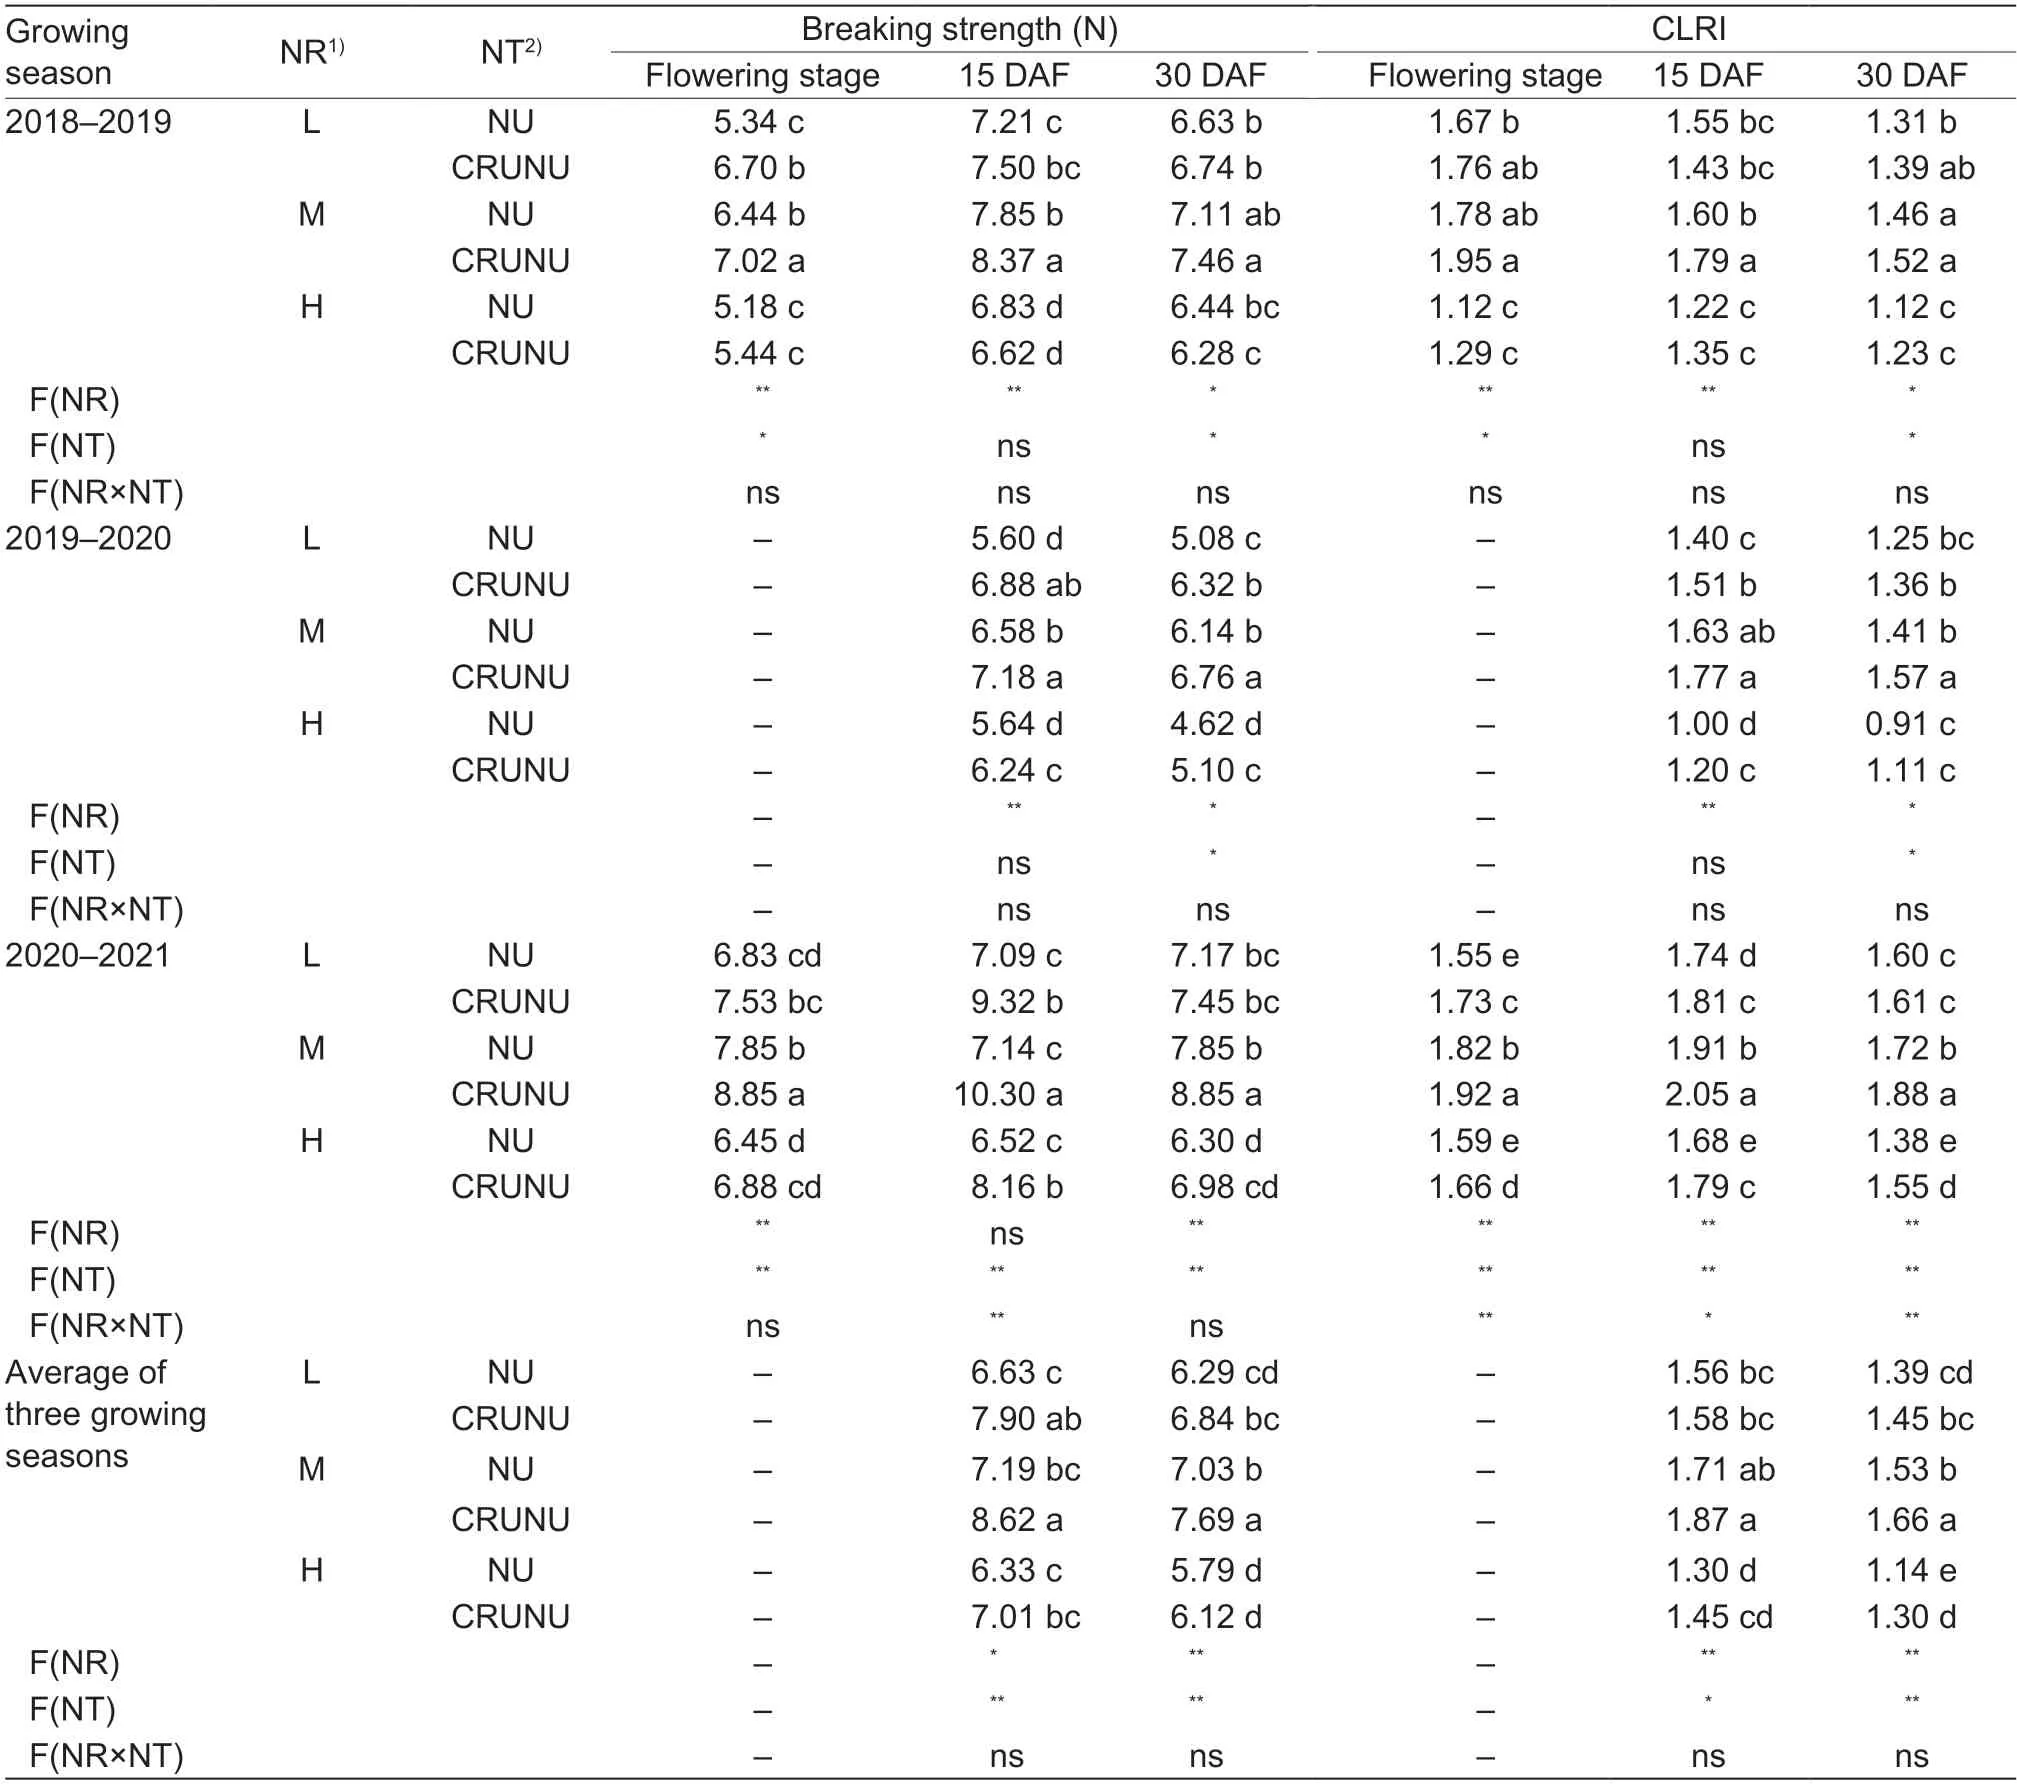
Table 2 Effect of N application rate (NR) and N fertilizer type (NT) on breaking strength of the basal second internodes and culm lodging resistance index (CLRI) of wheat in 2018–2019,2019–2020,and 2020–2021 growing seasons
With the development of wheat after flowering,the activities of key enzymes for lignin synthesis (PAL,TAL,and POD) gradually decreased (Fig.5-C–E). Both the N application rate and N fertilizer type significantly affected the activities of PAL,TAL,and POD. At the flowering stage,under the same N fertilizer type,the activity of PAL,TAL,and POD was the highest under the medium N application rate,followed by the low and high N application rates. At 30 DAF,the activity of PAL and TAL was the highest under the high N application rate,followed by the medium and low N application rates;however,the activity of POD was the highest under the low N application rate,which may be related to the early senescence of wheat due to the lack of N supply in the late stage under low N application rates. At the flowering stage and 15 DAF,under the three N application rates,it was evident that CRUNU improved the activity of PAL,TAL,and POD compared to NU (Fig.5-C and D).
Regression analysis showed that the lignin content showed a significant positive correlation with the activities of PAL,TAL,and POD (R2was 0.71*,0.86**,and 0.81*,respectively) at the flowering stage (Fig.5-F–H).
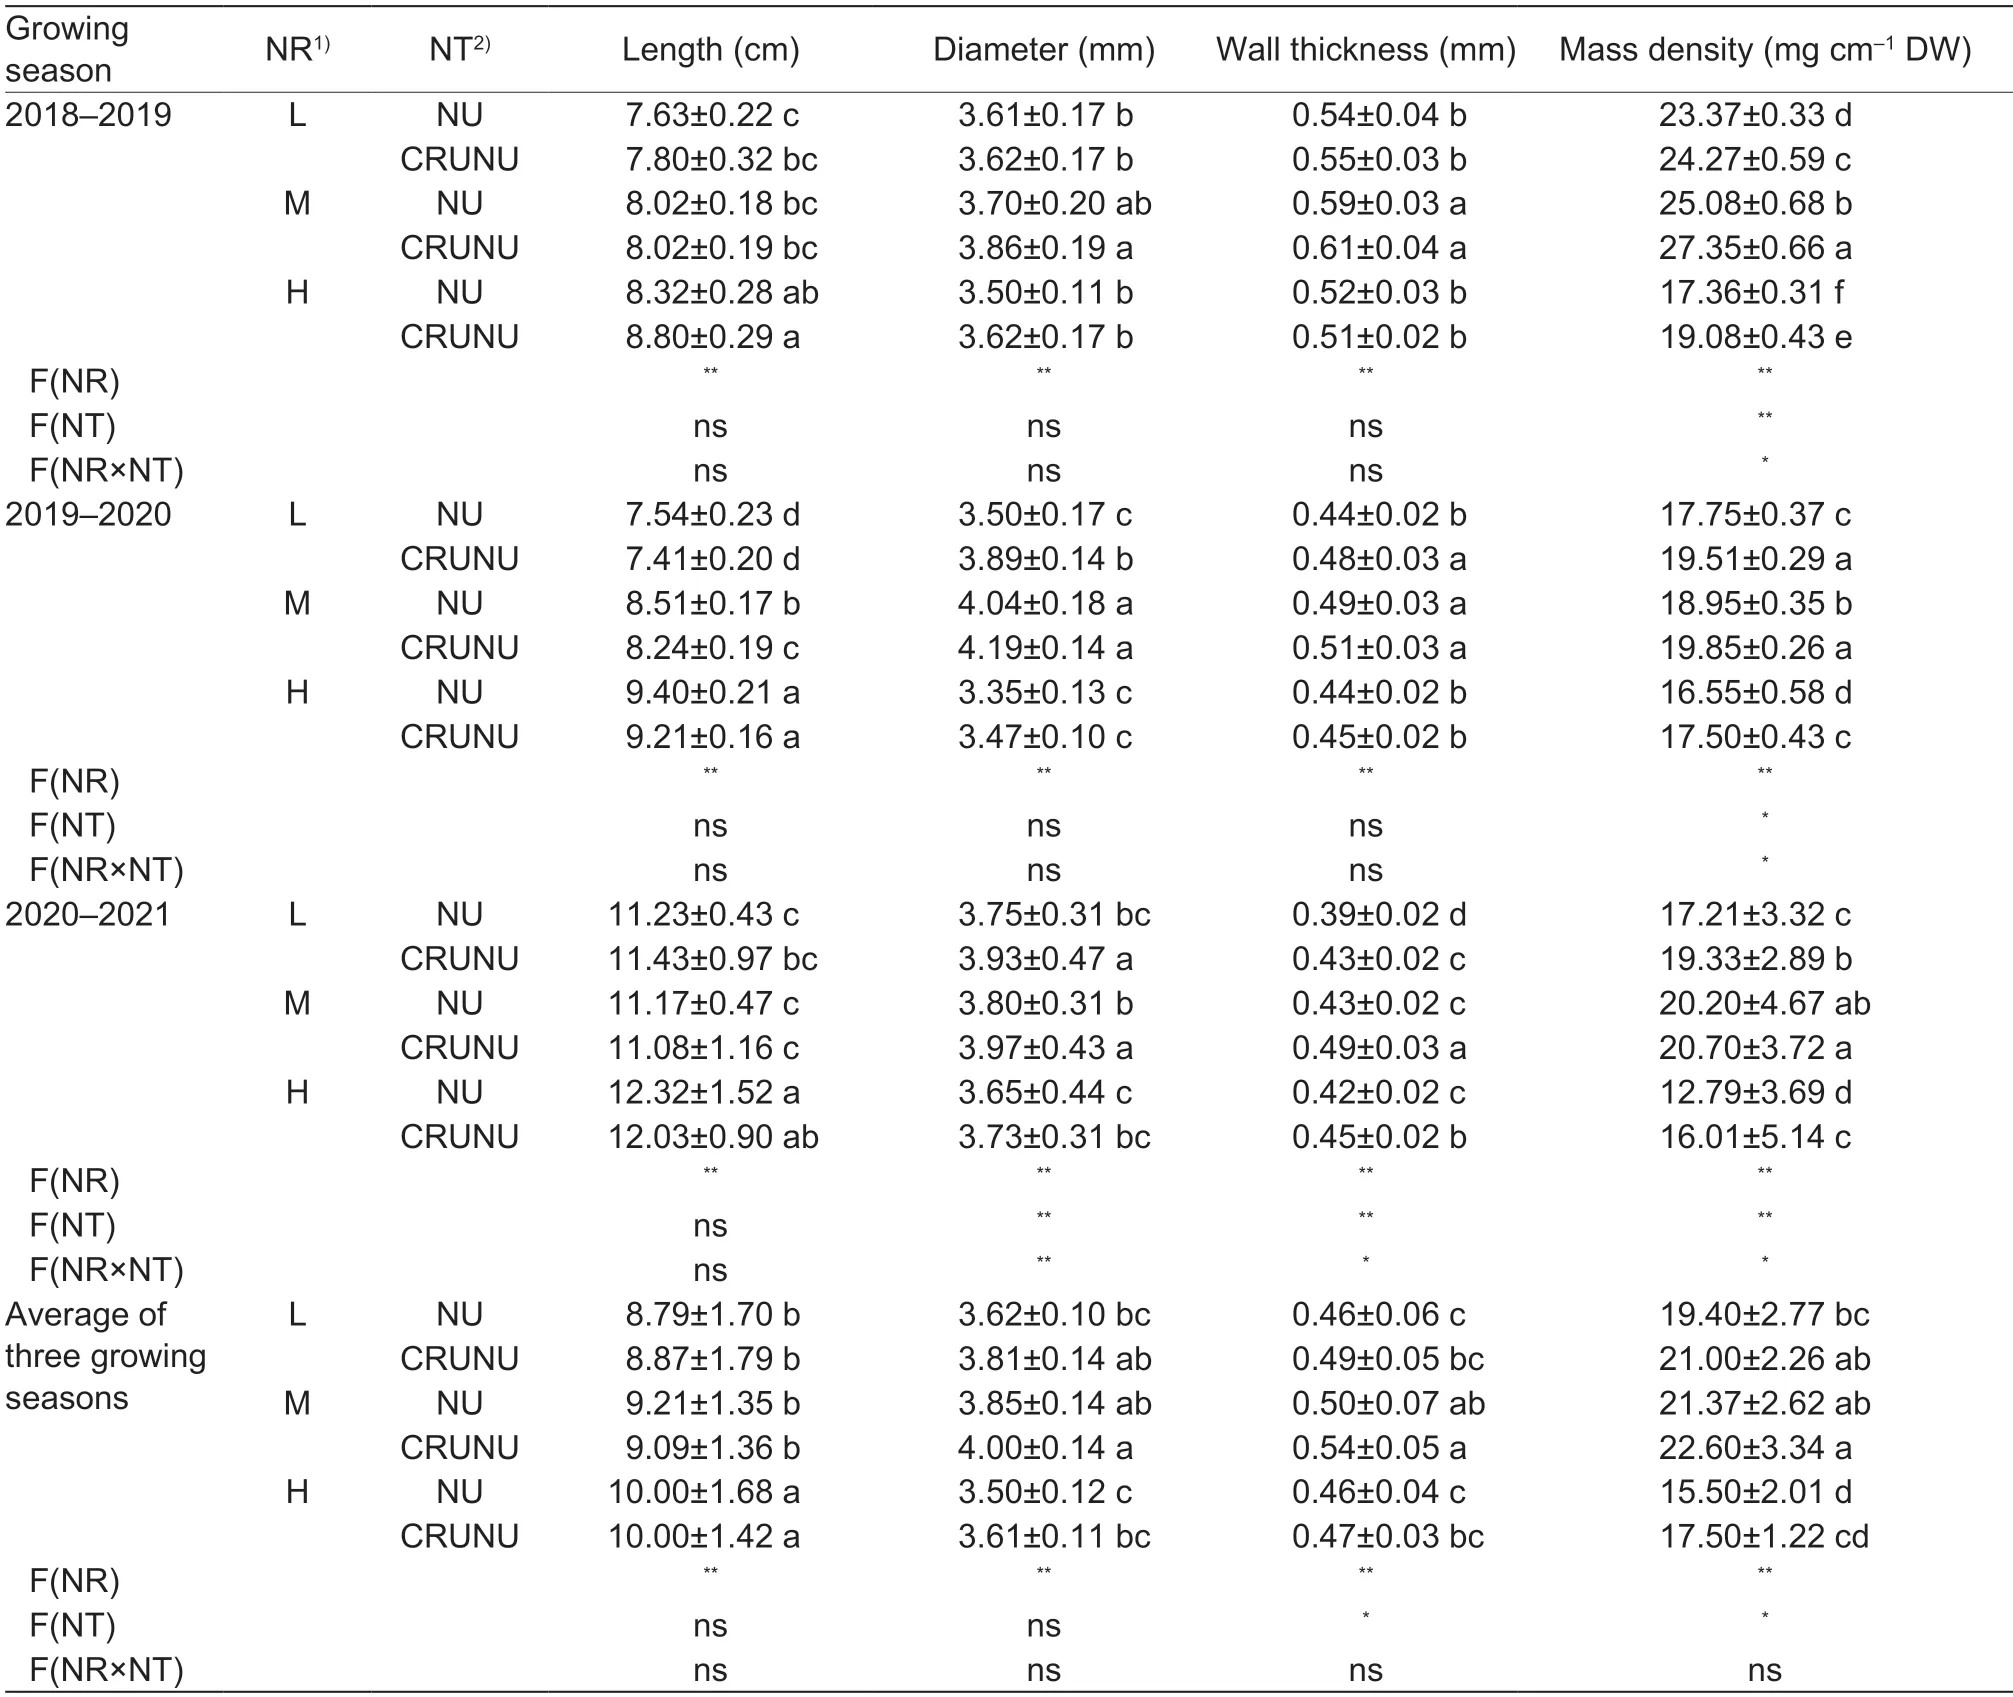
Table 3 Effect of N application rate (NR) and N application type (NT) on physical characteristics of the basal second internode in 2018–2019,2019–2020,and 2020–2021 growing seasons
Correlation analysisThe relationship between the mechanical characteristics (F1,F2,breaking strength,and CLRI),population characteristics (PH,CG,and SN),physical characteristics (SL,SP,SWT,and SMD) of the second basal internode,and the chemical components(LC,PAL,TAL,and POD) of the second basal internode,and the microstructure of the second basal internode were shown in Fig.6. The population lodging resistance(F1 and F2) was positively correlated with BS,CLRI,population characteristics,IL,ID,IWT,chemical components,and microstructure of wheat. BS and CLRI were positively correlated with ID,IWT,IMD,chemical components,and microstructure but negatively correlated with population characteristics and IL.
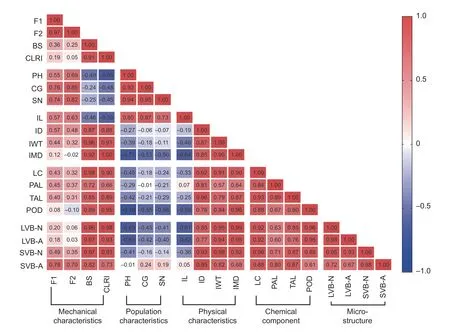
Fig.6 The relationship between mechanical characteristics,population characteristics,physical characteristics,and chemical components of the basal second internode. PH,CG,and SN represent wheat plant height,height of the center of gravity,and stem number,respectively. BS,IL,ID,IWT,IMD,and LC represent breaking force,length,diameter,wall thickness,mass density,and lignin content of the basal second internode,respectively. LVB-N,LVB-A,SVB-N,and SVB-A represent the number and area of large and small vascular bundles,respectively. F1,F2,CLRI,PAL,TAL and POD refer to transverse force,longitudinal force,culm lodging resistance index,phenylalanine ammonia-lyase,tyrosine ammonia-lyase and peroxidase.
3.3.Grain yield and yield stability
The wheat grain yield of all treatments was the highest in the 2018–2019 growing season and the lowest in the 2020–2021 growing season (Fig.7-A–D). For the average grain yield of the four growing seasons,compared with NU,CRUNU increased grain yield by 3.12,14.62,and 4.47% at high,medium,and low N application rates,respectively. However,there was a significant difference only at medium N application rates (P<0.01). During the four growing seasons,the grain yield of M-CRUNU was not significantly different from that of the two treatments with higher N application rates and was even higher than that of the H-NU treatment.
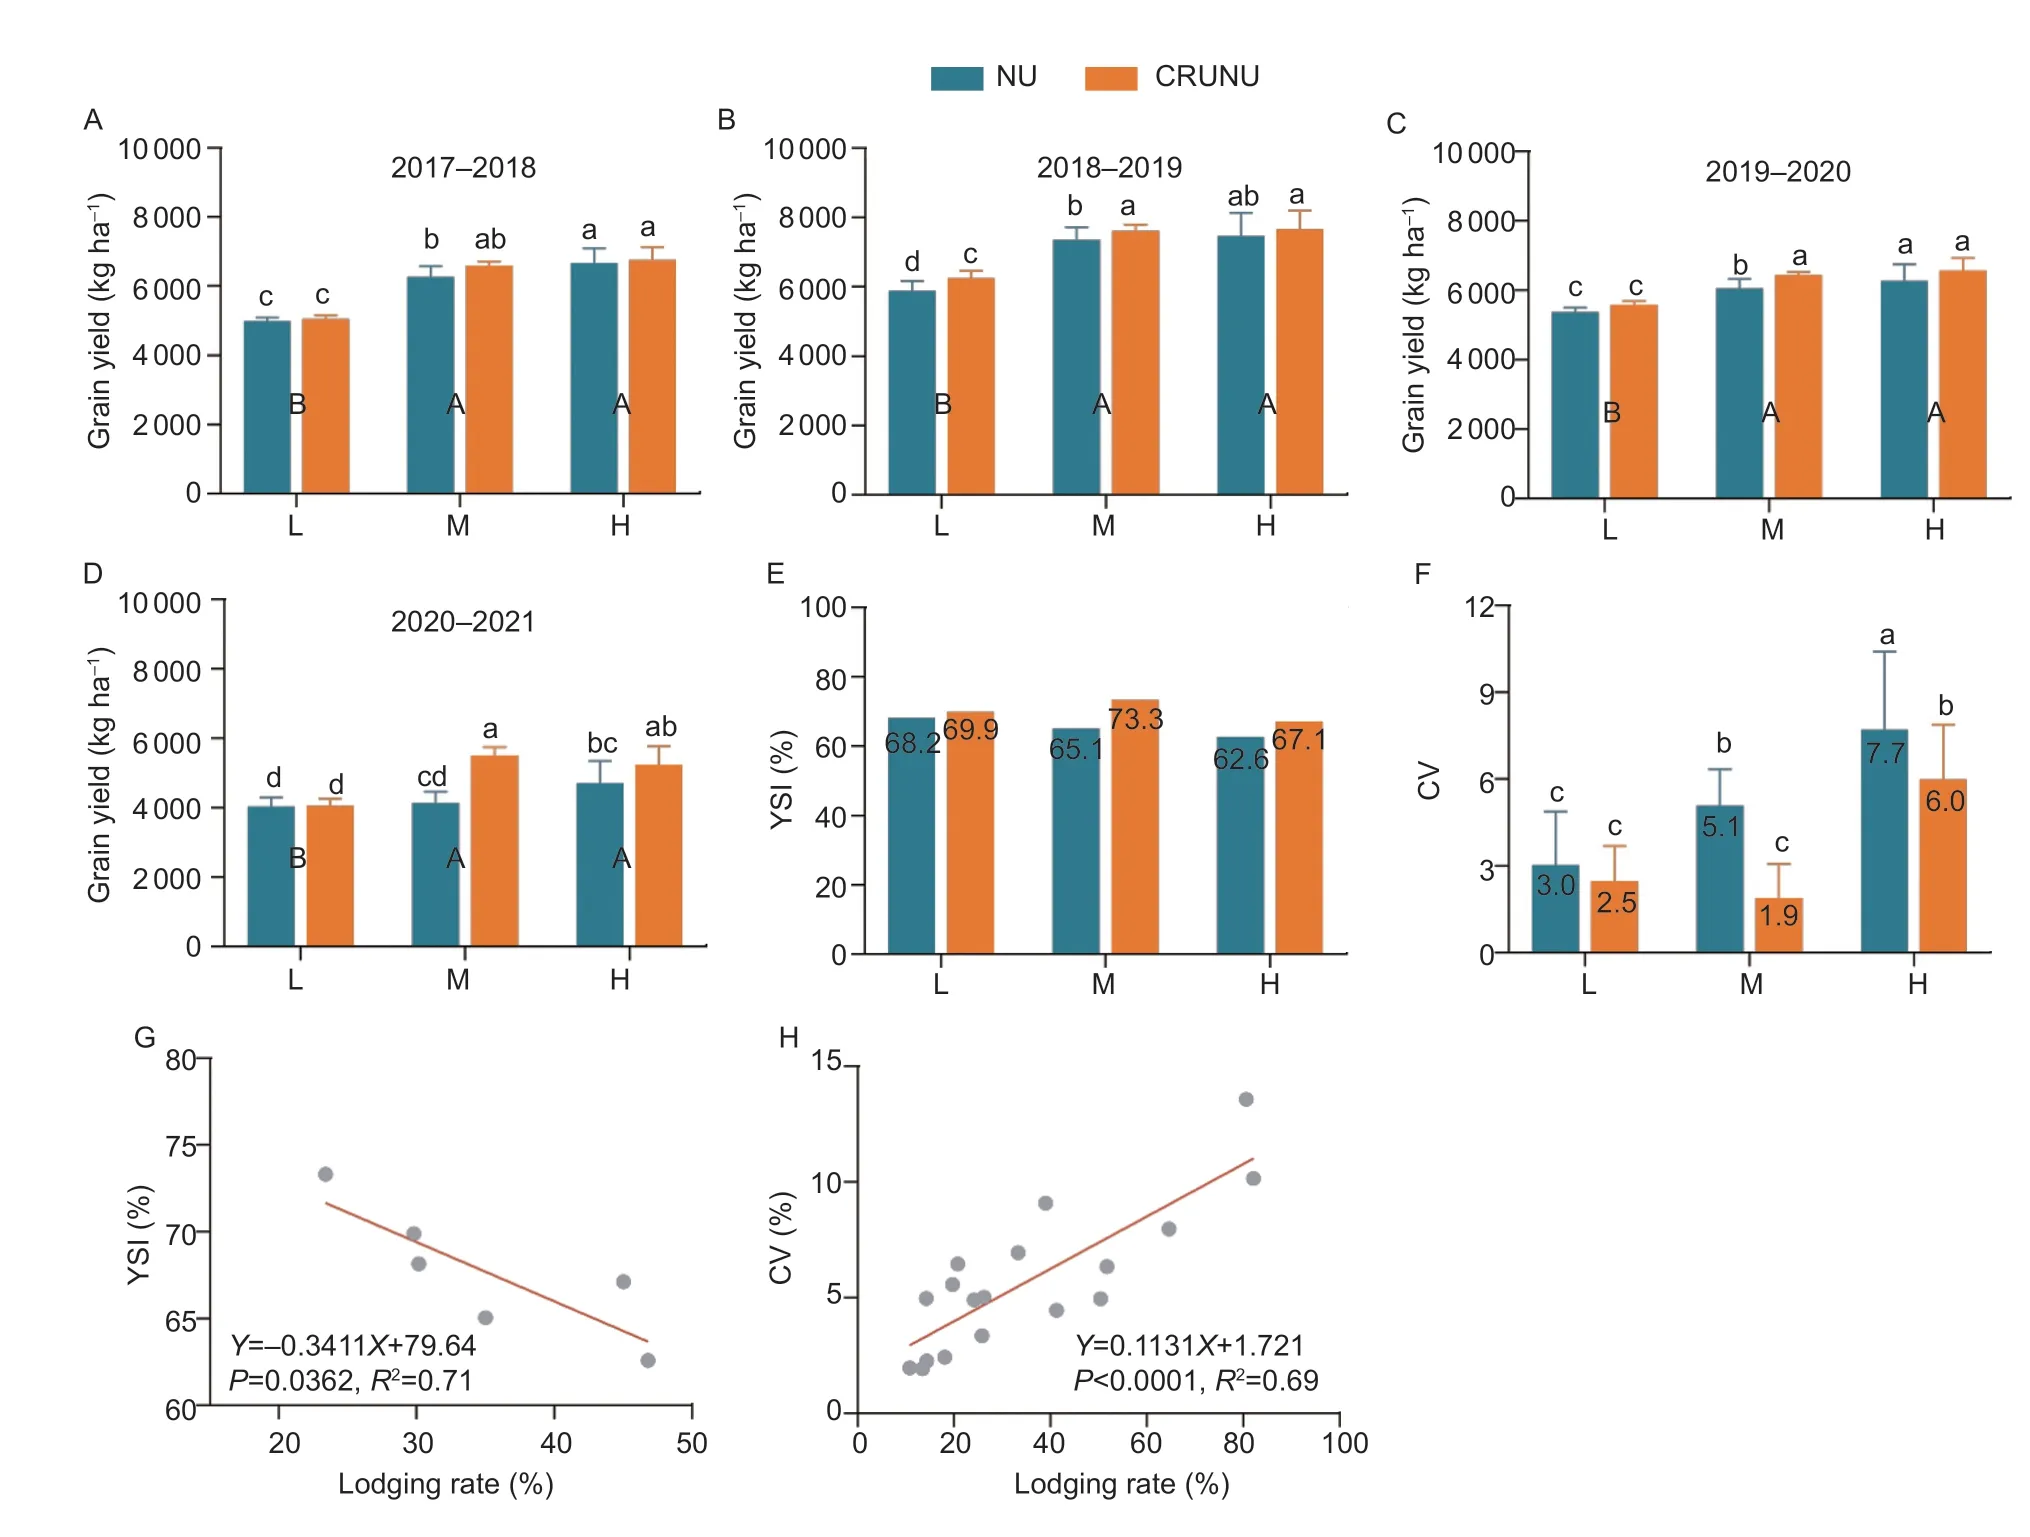
Fig.7 Effects of different N fertilizer treatments on wheat grain yield during the growing seasons 2017–2018 (A),2018–2019 (B),2019–2020 (C),and 2020–2021 (D). E and F,response of yield sustainability index (YSI) and CV to different N fertilizer treatments.G and H,relationship between lodging rate and YSI and CV. NU and CRUNU refer to normal urea and a mixture of normal urea and controlled-release urea,respectively. L,M,and H refer to low,medium,and high N application levels,respectively. Bars mean SE (n=3). Different lowercase letters indicate that the grain yield is significantly different between different treatments (P<0.05),and different capital letters indicate significant differences between different N application rates (P<0.05).
The YSI of NU,L-CRUNU,M-NU,M-CRUNU,H-NU,and H-CRUNU were 68.16,69.89,65.05,73.31,62.59,and 67.12%,respectively (Fig.7-E). The YSI of CRUNU was higher than that of NU at the three N application rates. The CV of CRUNU was significantly lower than that of NU under the three N application rates. NU had the highest CV at a high N application rate (7.70%) and the lowest CV at a low N application rate (3.04%),while CRUNU had the lowest CV at a high N application rate(5.98%) and the highest grain yield variation at medium N application rate (1.89%) (Fig.7-F). In general,the two types of N fertilizers had the lowest yield stability under high N application rates.
Regression analysis showed that YSI and CV decreased and increased with increasing lodging rates(Fig.7-G and H),which indicated that the yield stability of wheat populations with high lodging rates was lower.
4.Discussion
Inadequate N fertilizer management makes wheat more susceptible to stem lodging under severe weather conditions,which reduces grain yield and increases inter-annual yield variability (Wuet al.2019). Currently,N fertilizer management strategies aiming at achieving high and stable wheat yields and reducing lodging risk have received widespread attention. CRUNU,combined with an appropriate N application rate,was gradually applied in wheat production to improve grain yield and N use efficiency (Zhenget al.2016,2017). However,there is still limited information on how CRUNU and N application rates affect wheat stem lodging. Therefore,it is necessary to fill this research gap and elucidate the related mechanisms to balance the stem lodging risk,grain yield,and yield stability in wheat production. In wheat production,high yield often shows contrasting results to a high lodging risk (Xueet al.2017;Zhanget al.2019). Our results further confirm that both N fertilizer types have higher grain yields under high N application rates (Fig.7) and show a high lodging rate (Fig.2). However,CRUNU combined with an appropriate N application rate seems to be able to alleviate the above conditions. For example,relative to treatments with high N application,CRUNU combined with medium N application rate did not significantly reduce grain yield and showed a lower lodging rate in wheat.
4.1.CRUNU combined with medium N application rate can improve lodging resistance
The occurrence of wheat lodging is the result of the combined effect of population lodging resistance and external force. Therefore,improving the population lodging resistance of wheat can effectively reduce its lodging rate (Niuet al.2012;Caiet al.2019).
Population characteristics are important factors that affect the lodging resistance of wheat populations(Luoet al.2019;Wuet al.2019). In general,wheat populations with lower plant heights and center of gravity tend to show higher lodging resistance because such populations will present less force on the basal stems when subjected to external forces (Tripathiet al.2003a).In this study,the plant height and center of gravity of wheat were mostly not affected by N fertilizer type but were affected by N application rate and increased with the higher N application rates (Fig.4). The wheat population number is another key trait that determines the ability of the population to resist lodging resistance (Niuet al.2012). Too few or too many wheat individuals could not show strong population lodging resistance. When the number of individuals planted is small,there is a weak interaction (supporting power) between individuals (Wanget al.2012). When the population is large,there may be greater interactions,but such a population will aggravate individual competition for light,water,and nutrients,leading to poor stalk development (Konget al.2013). In addition,since the occurrence of wheat lodging is a pointto-surface process (Caiet al.2019),once lodging occurs in a large wheat population,it is easy to rapidly expand the lodging area by superimposing among individuals (Wanget al.2012). Therefore,a reasonable wheat population quantity is very important to guarantee population lodging resistance. This study showed that the wheat populations were only affected by the N application rate and increased with the N application rate (Fig.4). It is not difficult to find that the above-mentioned wheat population characteristics are only affected by the N application rate. In other words,the N application rate can affect the population lodging resistance by controlling population characteristics.
The second basal internode of wheat is the stress point of the stem;thus,the breaking strength of this internode is another key factor affecting the population lodging resistance (Wuet al.2019). Some studies have found that increasing planting density and improving water and fertilizer conditions will promote wheat canopy growth,which weakens the light environment and photosynthetic efficiency in the middle and lower parts,and reduces the physical characteristics of the basal internodes,including an increase in the length,a decrease in diameter,wall thickness,and mass density,and ultimately reducing the breaking strength of the internodes (Luet al.2014).In this study,CRUNU significantly increased the wall thickness and mass density of the basal second internode compared with NU,and both N fertilizer types showed the highest internode diameter and mass density at medium N application rates (Table 3). Lignin is an important chemical component that ensures stem integrity and provides mechanical strength (Ma 2010;Chenet al.2011). Overall,the higher the lignin content,the higher the stem density and the stronger the stem-breaking strength(Chenet al.2021). Previous studies have reported that the activities of PAL,TAL,and POD play a key role in lignin biosynthesis (Campbell and Sederoff 1996;Liet al.2003;Wajahatullahet al.2003;Penget al.2014),where POD activity has the greatest impact on lignin synthesis(Luet al.2014). The regression analysis results also showed that the lignin content increased with the increase in the three enzyme activities (Fig.5-G–H). In this study,CRUNU increased the three enzyme activities compared to NU,especially at medium N application rates (Fig.5-C–E);thus,CRUNU increased lignin content. Vascular bundles also play an important role in maintaining the internode mechanical strength. For example,Wuet al.(2019) found that split application of N fertilizer increased the number and area of basal internode vascular bundles of wheat,which is conducive to increasing the mechanical strength of the internodes,and Tianet al.(2020) and Wu and Ma (2019) reached similar conclusions for corn and oats,respectively. In this study,the number and area of vascular bundles were the highest at medium N application rates,and CRUNU increased the number of vascular bundles compared with NU (Table 4). In summary,CRUNU,combined with a medium N application rate,can improve the breaking strength of the second basal internode by improving the physical characteristics,chemical components,and micro-structure.
4.2.CRUNU combined with medium N application rate can improve grain yield and yield stability
Achieving the synchronization of soil N supply and crop N demand is the goal of N fertilizer management (Linquistet al.2013). CRU greatly improved this synchronization and promoted crop N uptake (Lyu T Fet al.2021). For example,a meta-analysis showed that CRU significantly improved crop N uptake by 12.6%,and this improvement in N uptake largely contributed to a higher grain yield(by 7.7%) (Yang Met al.2021). In this study,the 4-year average results showed that CRUNU increased wheat grain yield by 7.40% compared with NU,but there was a significant difference only under the medium N application rate. Previous studies have shown that compared with NU with a high N application rate,CRUNU did not significantly reduce wheat grain yield even if the N application rate was reduced by 30% (Zhenget al.2016,2017),which was consistent with the results of this study (Fig.7-A–D).
In addition to grain yield,yield stability is also an important indicator for evaluating farmland management practices (Hanet al.2020),and CV and YSI are often used to evaluate yield stability (Singhet al.1990;Borrelliet al.2014). CV can measure the degree of change in crop yields in different years,and the larger the CV value,the more unstable the yield (Xuet al.2019),while the YSI value is between 0–1,the larger the value,the more stable the crop yield (Caiet al.2018). Many factors limit the achievement of high grain yield;thus,high yields are often accompanied by instability and unsustainability. For example,it was found in this study that wheat grain yield was higher under high N application rates,but it also had lower YSI and higher CV. However,CRUNU seems to offer the possibility of achieving both high yield and high stability and sustainability simultaneously,particularly with the highest YSI and CV at medium N application rates (Fig.7-E and F). The occurrence of lodging in wheat can reduce the grain yield by 7–80%,resulting in great yield instability. The regression results further showed that YSI and CV decreased and increased with the increase in lodging rate,respectively(Fig.7-G and H). Therefore,the high grain yield stability and sustainability of wheat under CRUNU in this study were largely attributed to the improvement in lodging resistance.
4.3.Limitations of the study
The wheat genotype is a key factor affecting its lodging resistance because wheat with different genotypes often has different population characteristics and stem development degrees (Tripathiet al.2003a,b). It is not clear whether CRUNU combined with the appropriate N application rate can produce the same conclusion as this study for other wheat genotypes,and it is necessary to fill this gap in future studies.
5.Conclusion
Our results showed that CRUNU displayed high lodging resistance while maintaining grain yield at a medium N application rate. The decrease in stem lodging risk was mainly attributed to improving population lodging resistance,related to the second basal internode’s better physical properties,chemical composition,and microstructure. Thus,CRUNU combined with a medium N application rate (180 kg ha–1) may be an efficient N management strategy for wheat production.
Acknowledgements
This research work was supported by the Key R&D Plan of Shaanxi Province Project,China (2023-YBNY-041),the Doctoral Graduates and Postdoctoral Researchers from Shanxi Province Come to Work to Reward Scientific Research Projects,China (SXBYKY2022119),and the Key Laboratory Project of Shanxi Province,China(202001-4).
Declaration of competing interest
The authors declare that they have no conflict of interest.
Appendixassociated with this paper is available on https://doi.org/10.1016/j.jia.2023.02.039
 Journal of Integrative Agriculture2023年10期
- Journal of Integrative Agriculture的其它文章
- The association between the risk of diabetes and white rice consumption in China: Existing knowledge and new research directions from the crop perspective
- Linking atmospheric emission and deposition to accumulation of soil cadmium in the Middle-Lower Yangtze Plain,China
- Genome-wide association study for numbers of vertebrae in Dezhou donkey population reveals new candidate genes
- Are vulnerable farmers more easily influenced? Heterogeneous effects of lnternet use on the adoption of integrated pest management
- lnfluences of large-scale farming on carbon emissions from cropping:Evidence from China
- Spatio-temporal variations in trends of vegetation and drought changes in relation to climate variability from 1982 to 2019 based on remote sensing data from East Asia