
SNP-based identification of QTLs for thousand-grain weight and related traits in wheat 8762/Keyi 5214 DH lines
2023-10-16 01:32:34HUANGFengLlXuanshuangDUXiaoyuLlShunchengLlNannanYongjunZOUShaokuiZHANGQianWANGLinaNlZhongfuHANYulinXlNGJiewen
Journal of Integrative Agriculture 2023年10期
HUANG Feng ,Ll Xuan-shuang ,DU Xiao-yu ,Ll Shun-cheng ,Ll Nan-nan ,LÜ Yong-junZOU Shao-kuiZHANG QianWANG Li-naNl Zhong-fu,HAN Yu-linXlNG Jie-wen#
1 Zhoukou Academy of Agricultural Sciences,Zhoukou 466001,P.R.China
2 Frontiers Science Center for Molecular Design Breeding,Key Laboratory of Crop Heterosis and Utilization,Ministry of Education,Beijing Key Laboratory of Crop Genetic Improvement,China Agricultural University,Beijing 100193,P.R.China
Abstract As important yield-related traits,thousand-grain weight (TGW),grain number per spike (GNS) and grain weight per spike(GWS) are crucial components of wheat production. To dissect their underlying genetic basis,a double haploid (DH)population comprised of 198 lines derived from 8762/Keyi 5214 was constructed. We then used genechip to genotype the DH population and integrated the yield-related traits TGW,GNS and GWS for QTL mapping. Finally,we obtained a total of 18 942 polymorphic SNP markers and identified 41 crucial QTLs for these traits. Three stable QTLs for TGW were identified on chromosomes 2D (QTgw-2D.3 and QTgw-2D.4) and 6A (QTgw-6A.1),with additive alleles all from the parent 8762,explaining 4.81–18.67% of the phenotypic variations. Five stable QTLs for GNS on chromosomes 3D,5B,5D and 6A were identified. QGns-5D.1 was from parent 8762,while the other four QTLs were from parent Keyi 5214,explaining 5.89–7.08% of the GNS phenotypic variations. In addition,a stable GWS genetic locus QGws-4A.3 was detected from the parent 8762,which explained 6.08–6.14% of the phenotypic variations. To utilize the identified QTLs,we developed STARP markers for four important QTLs,Tgw2D.3-2,Tgw2D.4-1,Tgw6A.1 and Gns3D.1. Our results provide important basic resources and references for the identification and cloning of genes related to TGW,GNS and GWS in wheat.
Keywords: TGW,GNS,GWS,QTL mapping,wheat
1.Introduction
Wheat (TriticumaestivumL.) is one of the most important staple cereal crops in the world,which provides~20% of the calories and protein for human beings (Singhet al.2021). The FAO estimates that by 2050 the world will need to increase its food output by around 70% in order to feed an ever-growing population. Thus,the supply and demand of wheat production will be maintained in a tight balance for a long time,and this situation will be quite serious in future decades. In China,the planting area,total yield and consumption of wheat are currently all in the first place in the world (Heet al.2018;Guptaet al.2020). However,limited agricultural acreage,deficient water resources and climate change have caused great losses of crop yields. Crop genetic improvement has been regarded as an effective way to solve these problems (Sunet al.2020). So conventional and molecular breeding strategies should be utilized intensively,such as doubled haploid breeding,marker-assisted selection,genomic selection,key location phenotyping and hybrid wheat breeding (Raufet al.2015;Tadesseet al.2019).
Thousand-grain weight (TGW),grain number per spike(GNS),and spike number per unit area are important factors which determine crop yield (Yanget al.2012;Zhanget al.2014;Chen Zet al.2019;Shoaibet al.2020;Yang Fet al.2022). Among them,TGW has the highest heritability and is the most important index for judging the yield of wheat cultivars (Duanet al.2020;Guptaet al.2020;Zhaoet al.2021). Thus,it is essential to identify the major quantitative trait loci (QTLs) of TGW and further exploit elite genes for the genetic improvement of modern wheat cultivars (Turaet al.2020). In the last two decades,a large number of QTLs for TGW have been successfully identified by traditional bi-parental linkage mapping and genome-wide association approaches (Miaoet al.2021,2022). The QTL for TGW and its related traits,such as GWS and GNS,are distributed all over the 21 chromosomes of the wheat genome (Yanget al.2021;Zhaoet al.2021). Some major QTLs for TGW,GWS and GNS have been reported in numerous previous studies(Maet al.2006;Miret al.2012;Duanet al.2020;Liet al.2021;Sheoranet al.2021;Wanget al.2021;Dinget al.2022;Liuet al.2022). Although many QTLs and genes for TGW and related traits have been identified in wheat,the genetic effects of these QTLs are reported to be different in different environments (Table 1).
In this study,a double haploid (DH) population comprised of 198 lines derived from 8762/Keyi 5214 has been constructed in order to: 1) phenotype the TGW,GNS and GWS of the population in six environments with three blocks in two years;2) obtain SNPs and construct a highresolution genetic map for QTL mapping;and 3) identify stable QTLs of TGW,GNS and GWS by linkage mapping.The results of this study will provide a better understanding of the genetic determinants of TGW,and lay a foundation for identifying the reliable QTLs and predicting the putative candidate genes for wheat genetic improvement and molecular marker-assisted selection breeding.
2.Materials and methods
2.1.Materials
A set of 198 DH lines derived from 8762/Keyi 5214,and a DH population with 198 lines was constructed by the method of anther culture. Line 8762 was derived from Zhoumai 18/Kaimai 18,while Keyi 5214 was derived from Nongda 3330/0290. The characteristics of 8762 wheat are larger spikes and grains but lower plant height,while the spikes and grains of Keyi 5214 are smaller but the plant height is greater (Fig.1). The 8762/Keyi 5214 DH lines were planted using a randomized complete block design (RCBD) in 2018–2019 and 2019–2020 with three blocks in Zhoukou,Xinxiang,Henan Province and Linfen,Shanxi Province (Table 2). The plots were 1 m long with plant spacing of 6.67 cm and row spacing of 20 cm. Fieldmanagement aspects followed the local practices during wheat production.
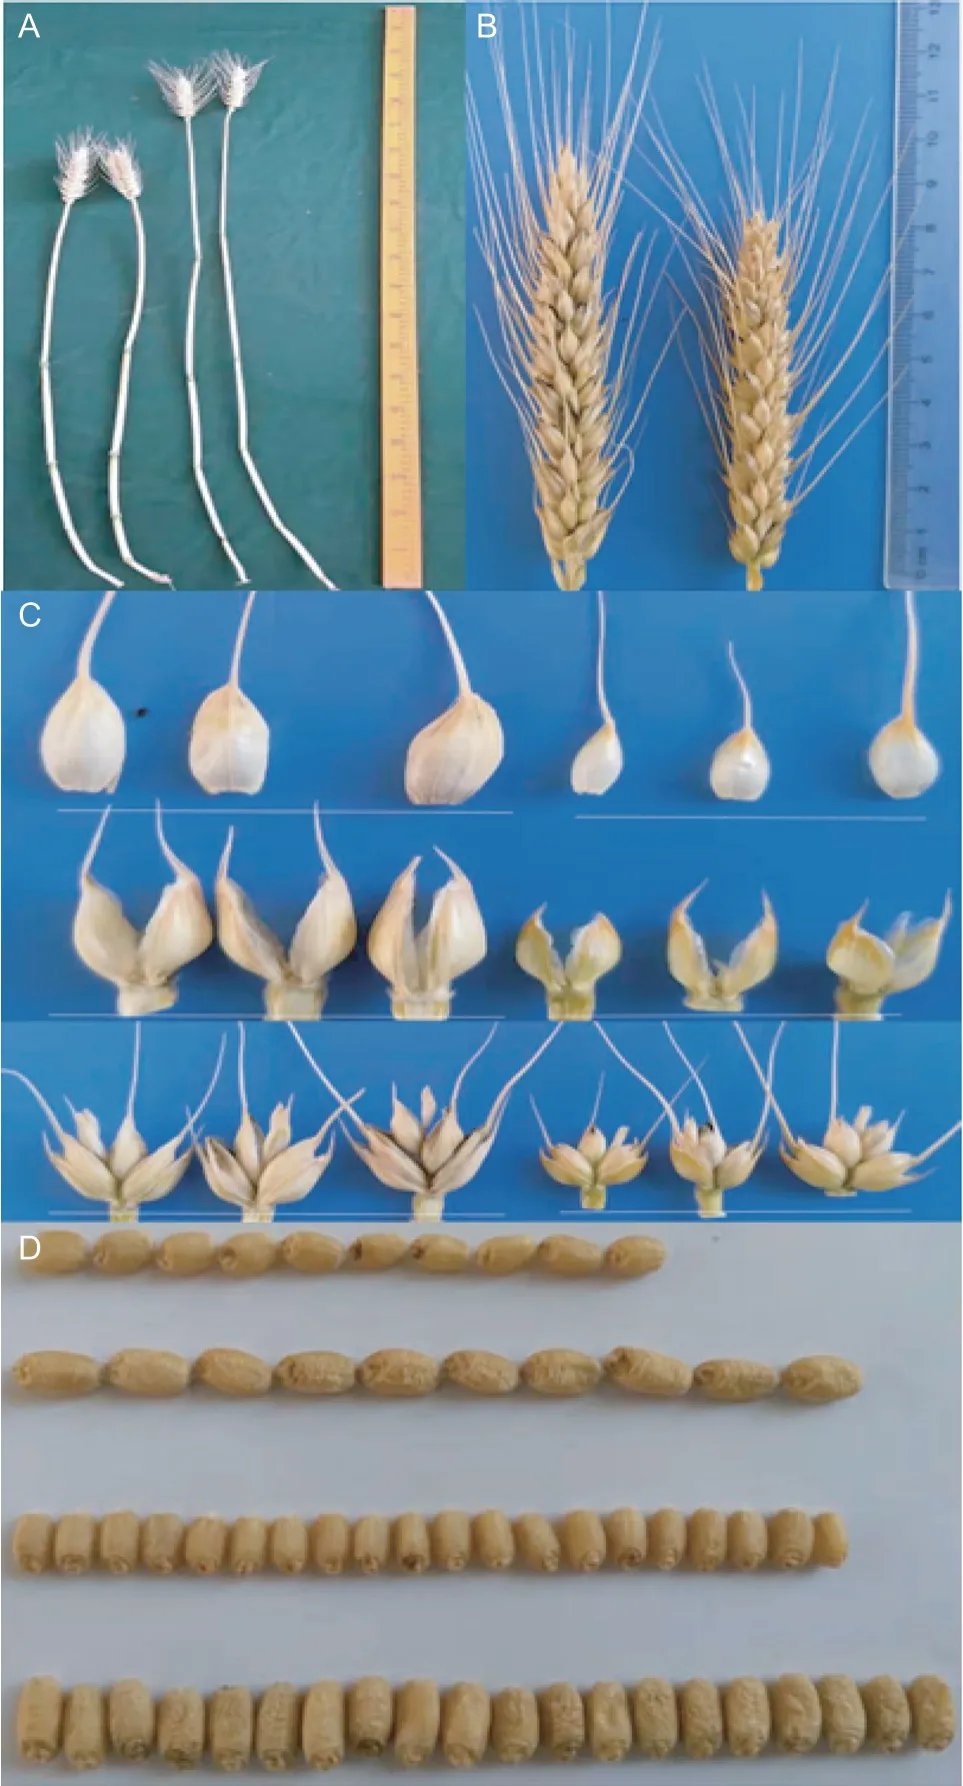
Fig.1 Plant height,spike shape,spikelet and grain morphology of the parents,8762 and Keyi 5214. A,plant heights of parents 8762 (left) and Keyi 5214 (right). B,spike shapes of parents 8762 (left) and Keyi 5214 (right).C,spikelet morphology of parents 8762 (left) and Keyi 5214(right). D,grain morphology of parents 8762 (below) and Keyi 5214 (above).
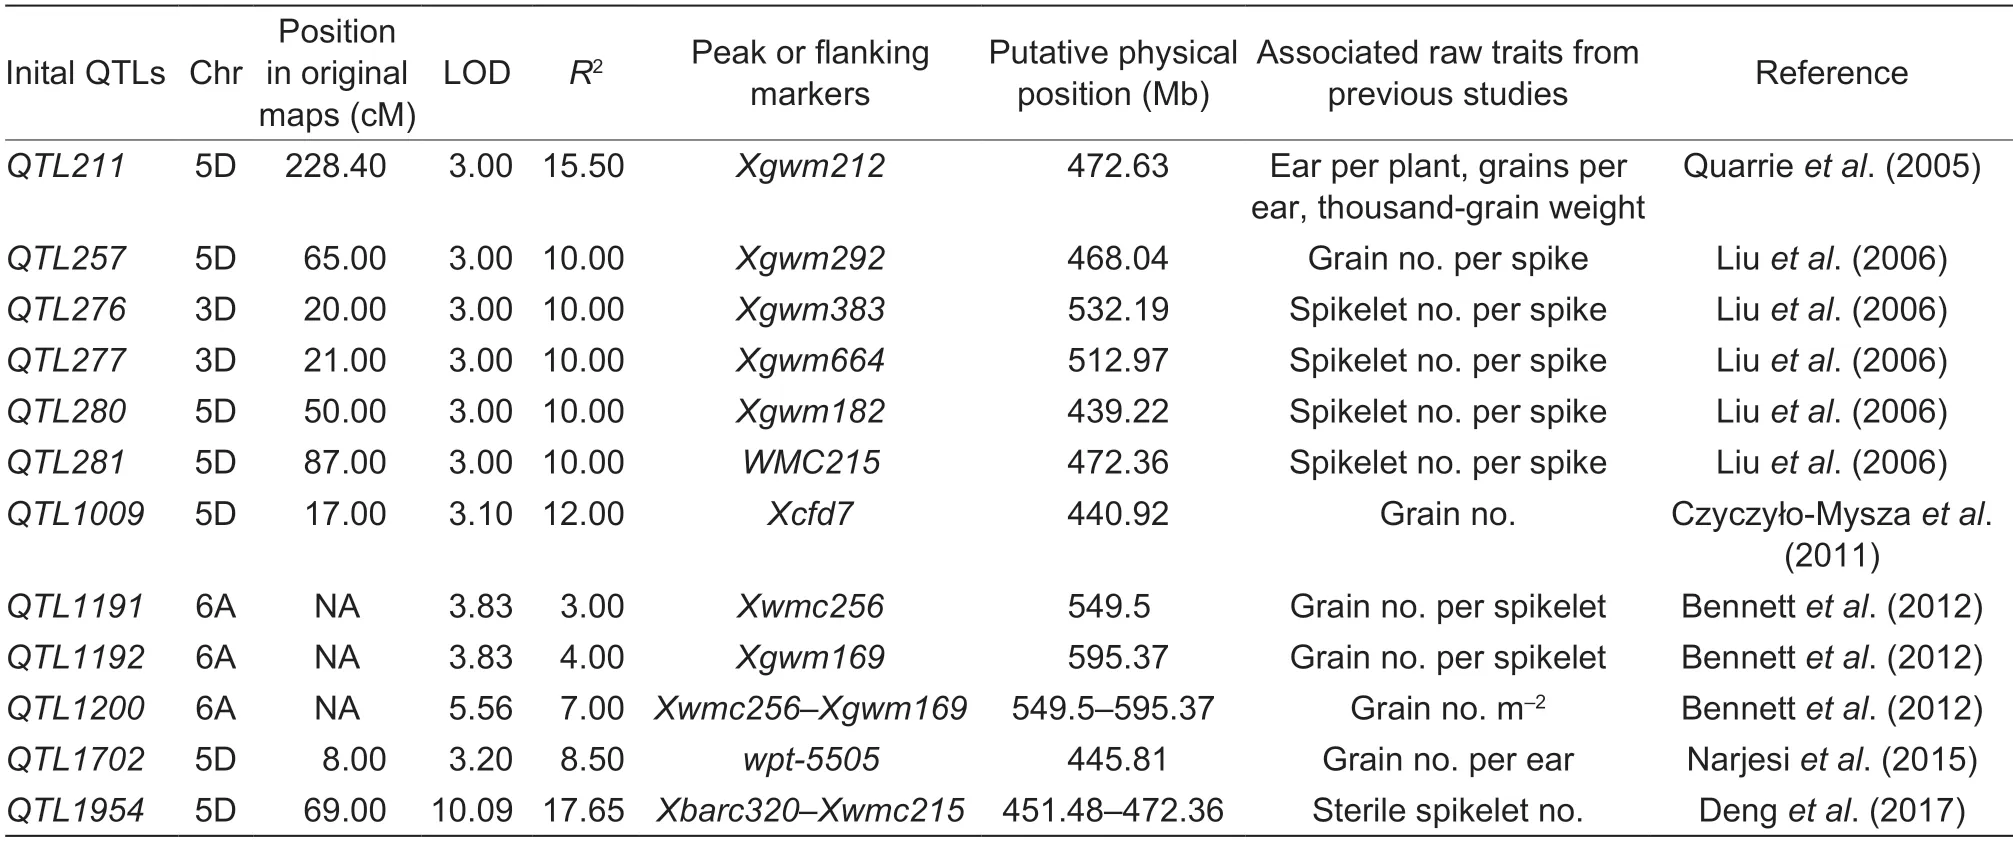
Table 1 Comparisons of the physical or genetic locations of the reported QTLs

Table 2 The six growth environments for the 8762/Keyi 5214 double haploid (DH) lines
2.2.Phenotypic identification
In the late growth stage of wheat,10 plants from each line were selected to identify the length and grain number of the main spike. Ten random main panicles from each line were harvested and threshed to measure the TGW,GNS and GWS.
2.3.Data analysis
Phenotypic dataThe basic statistics,correlation analysis,ANOVA and heritability analysis of the two parents and DH lines under various environments were performed using SPSS17.0 (https://www.ibm.com/spss) Software. The formula of heritability ish2=σg2/(σg2+σge2+σ2/nr),whereσg2is the genetic variance,σge2is the variance between gene and environment,σ2is the residual error,“n” is the number of environments,and “r”is the number of biological replicates.
Genotype analysisLeaf tissues sampled at the threeleaf stage and placed in a 2-mL centrifuge tube were freeze-dried using a freezing vacuum dryer for 2 days,and then ground to a fine powder for 2 min at 30 cycles per second in a Mixer Mill with the aid of a 4.0-mm metal bead in each tube. Genomic DNA was isolated by a modified CTAB method. The genotype of the 8716/Keyi 5214 DH population was analyzed by Axiom Wheat 55K gene SNP arrays of the Affymetrix Company (USA).
Construction of genetic mapPolymorphism SNPs were selected by Excel and the SNPs with a missing rate higher than 20% were removed. ICIMAPPING V4.1(http://www.isbreeding.net) was used to identify redundant markers and divide the SNPs into separate Bins. The genetic map was constructed by Joinmap4.0 using the Kosambi mapping function.
QTL mappingQTL mapping of TGW and related traits were conducted by the composite interval mapping(CIM) method with SNPs and phenotypes using WINQTL CartographerV2.5 (https://brcwebportal.cos.ncsu.edu/qtlcart/WQTLCart.htm). The step length of CIM was 1.0 cM,the background control was set to five reference markers,and the analysis model was the forward and backward method regression,with the permutation repeated for 1 000 times at a 95% confidence level. When the LOD value is more than 2.5,a QTL will be identified flanking the SNP. The QTL interval was set as a LRs (likelihood ratios) peak ±2;and if the positions of confidence intervals on the chromosomes overlapped with each other,they were considered to be the same QTL. At the same time,the additive effect of QTLs and the contribution rate of QTLs to the variance of phenotypic traits were given.The TGW QTL was named according to the international genetic naming rules. If one QTL could be repeatedly detected in two or more environments,it was considered as a stable QTL.
Design of STARP markersWe converted the SNP markers tightly linked to the corresponding QTL into semithermal asymmetric reverse PCR (STARP) markers (Longet al.2017). Each primer contained two asymmetrically modified allele-specific (AMAS) primers (F1 and F2) and a corresponding reverse primer (R). The F1 primers were designed to amplify one of the parental alleles,and F2 was designed to amplify the other parental allele. The STARP primers were designed using the primer design tool Primer3 (http://bioinfo.ut.ee/primer3–0.4.0/).
All the PCR reagents were held on ice prior to use.The three primers were mixed in a ratio of 1:1:2 (F1:F2:R)and diluted. The 10 µL PCR system included 5 µL 2×TaqPCR Star Mix,2 µL mixed primer,2 µL DNA template (50–100 ng µL–1) and 1 µL H2O. PCR was conducted with an initial denaturation at 94°C for 5 min,followed by 10 cycles of touchdown (94°C for 30 s,touchdown at 68°C initially and decreasing by 1°C per cycle for 30 s,and extension at 72°C for 30 s),followed by 28 cycles of three steps(94°C for 30 s,annealing at 58°C for 30 s and extension at 72°C for 30 s),and finally,holding at 72°C for 5 min. The amplified PCR products were separated by 8% PAGE.
3.Results
3.1.Phenotypic identification of TGW and related traits in wheat
The phenotypic analysis of TGW and related traits for the two parents and the DH lines showed that the TGW of 8762 was significantly higher than that of Keyi 5214 in the different planting environments,while the GNS of Keyi 5214 was significantly higher than that of 8762. In the DH population,TGW and related traits showed great variations and their distributions followed the normal distribution mode (Fig.2). In different environments,the TGW and its related traits showed positive and negative two-way super-parental segregation,which indicated that these traits are quantitative traits controlled by multiple genes and are therefore suitable for QTL mapping analysis. Heritability analysis showed that the heritability of TGW is higher,reaching a 0.90 level,while the heritability of GWS and GNS in the DH lines reached an average level of 0.80 (Table 3). The high heritability of TGW and related traits in the 8762/Keyi 5214 DH lines indicated that the variances of these phenotypes are mainly affected by genetic factors.
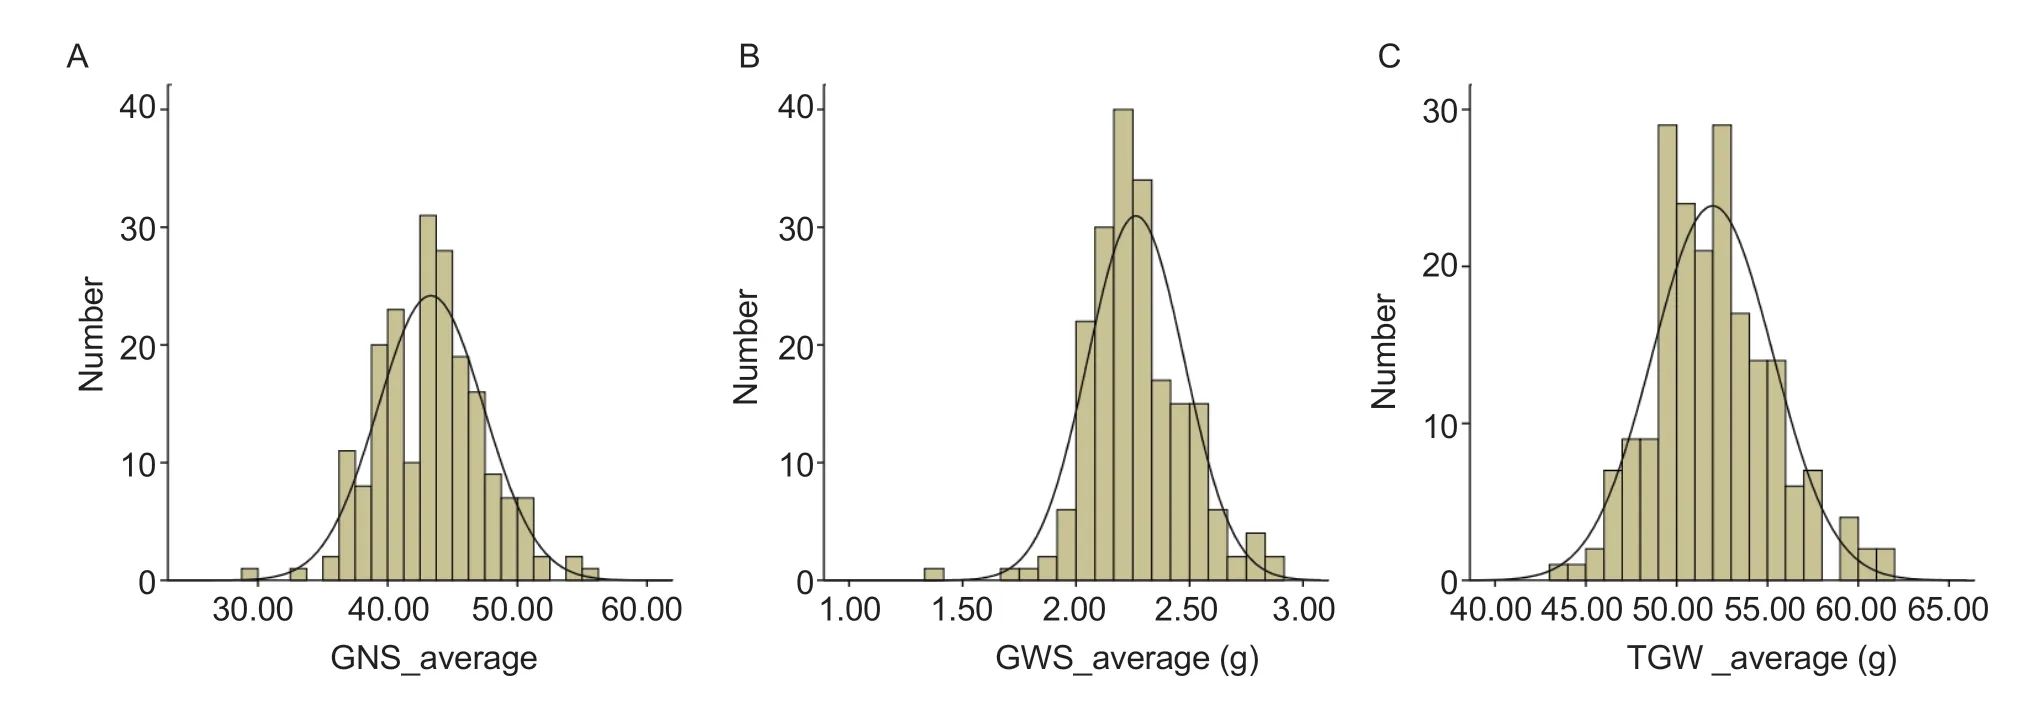
Fig.2 Frequency distribution histograms of grain number per spike (GNS),grain weight per spike (GWS) and thousand-grain weight (TGW).
The results of the phenotypic correlation analysis of TGW and related traits for the DH lines in six environments (Zhoukou,Xinxiang and Linfen in 2018–2019 and 2019–2020) showed that TGW was negatively correlated with GNS and GWS,while GNS was positively correlated with GWS at the 0.01 level (Table 4).
3.2.Construction of the genetic map
Genotyping of the DH linesGenotyping of the parents and DH lines were conducted by a wheat 55K SNP array,and a total of 18 992 polymorphic SNPs of the two parents(8762 and Keyi 5214) were identified. The genotypes of 198 DH populations constructed by 8762/Keyi 5214 were analyzed by 18 992 polymorphic SNP markers and 3 760 416 genotype data were obtained. Among the 18 992 polymorphic SNP markers,46 markers with a deletion rate greater than 20% and four markers without linkage were screened out,and the remaining 18 942 polymorphic SNP markers were used for genetic mapping.

Table 3 Phenotypic analysis of thousand-grain weight (TGW) and related traits in the double haploid (DH) lines under multiple environments
Genetic map of the DH linesA high-density genetic map covering 3 501.99 cM was constructed by the 18 942 polymorphic SNPs and 1 678 loci in the 8762/Keyi 5214 DH lines on 21 chromosomes with an average locus density of 2.09 cM (Table 5;Fig.3). The SNPs were mostly on chromosome 4B (1 314) while the fewest SNPs (229)were on chromosome 4A. The longest genetic distance chromosome is 7D at 277.12 cM,while the shortest is 6B at 98.08 cM. The SNP density of chromosome 3D(11.23 SNP cM–1) is the highest while that of chromosome 4A (1.90 SNP cM–1) is the lowest,indicating a high density of the genetic map (Table 5;Fig.3).

Fig.3 High density genetic map of the 8762/Keyi 5214 double haploid (DH) lines.
The numbers of SNPs detected in sub-genomes A,B and D are 6 317,7 261 and 5 364,which covered 1 083.00,1 018.61 and 1 400.38 cM genetic distances,respectively.Among the three sub-genomes,the B sub-genome has the highest average SNPs density with 7.13 SNPs cM–1,while the SNPs density of the D sub-genome is the lowest with just 3.83 SNPs cM–1(Table 5;Fig.3).

Table 5 The distribution of SNP markers on the chromosomes
The SNPs distribution on homologous groups showed that 3 602 SNPs on homologous group 5 is the greatest number,while 1 959 SNPs on homologous group 2 is the least. The longest genetic distance of the seven groups is 633.68 cM on homologous group 5 and the shortest is 368.62 cM on homologous group 6. The SNP densities of the seven homologous groups ranged from 3.72 to 6.70 SNPs cM–1(Table 5;Fig.3).
3.3.QTL mapping
To identify the QTLs of TGW and related traits in the 8762/Keyi 5214 DH lines,QTL mapping was conducted with the phenotypic data in multiple environments and the high-density genetic map by CIM. In total,41 QTLs of TGW and related traits were identified and nine stable QTLs were detected in more than two environments.
Identification of TGW QTLsFifteen TGW QTLs designated asQTgw-2D.1–QTgw-7Awere identified on chromosomes 2D,3D,5B,5D,6A,6B,6D and 7A.QTgw-6A.1is a major locus on the long arm (445.56 Mb)of chromosome 6A which could be detected in three environments (E1,E3 and E6).QTgw-6A.1is tightly linked with markerAX-111096216,explaining 7.99–18.67% in different environments,and the 1.14–1.98 g additive allelic effect of TGW is from the larger grain parent 8762. The other two stable QTLs areQTgw-2D.3andQTgw-2D.4.QTgw-2D.3is a QTL linked with markersAX-109115125andAX-109419238(524.34 and 523.63 Mb) identified on the long arm of chromosome 2D in two environments (E1 and E2).QTgw-2D.3explains 4.81–5.41% of the phenotypic variation and the 1.18–1.34 g additive allelic effect of TGW is also from the larger grain parent 8762.QTgw-2D.4is a QTL linked with markersAX-110697826andAX-109908258(73.84 and 75.75 Mb)located on the short arm of chromosome 2D and was detected in E3 and E5,and it explained 5.41–7.01% of the phenotypic variation and the 0.93–3.16 g additive allelic effect of TGW is also from 8762 (Table 6). To make better use of our findings for wheat breeding,we designed STARP markers for the three major TGW QTLs (Table 7;Fig.4).
In addition,12 QTLs on chromosomes 2D,3D,5B,5D,6A,6B,6D and 7A were detected in just one environment.These QTLs explained 2.58–9.10% of the phenotypic variation and the additive allelic effects of TGW are from the larger grain parent 8762,except forQTgw-2D.1andQTgw-2D.2.
Identification of GNS QTLsFifteen QTLs linked withGNS were identified on chromosomes 3A,3B,3D,5A,5B,5D,6A,7A and 7D,which were designated asQGns-3A.1–QGns-7D.1(Table 6). Five stable QTLs for GNS on chromosomes 3D,5B,5D and 6A were detected in more than two environments. The additive allelic effects for GNS ofQGns-3D.1,QGns-5B.1,QGns-6A.1andQGns-6A.2were all from Keyi 5214,while the additive allelic effect ofQGns-5D.1was from 8762. The additive allelic effects ofQGns-3D.1,QGns-5B.1,QGns-6A.1andQGns-6A.2were 1.58–1.74 grains per spike,explaining 5.89–7.08% of the phenotypic variation,and they were linked with markersAX-111373283(518.34 Mb),AX-108939406(229.24 Mb),AX-111096216(445.56 Mb) andAX-111087643(555.71 Mb). To characterize the QTL ofQGns-3D.1,we designed STARP markers (Table 7;Fig.4). The additive allelic effect for GNS ofQGns-5D.1was 1.7 grains per spike,explaining 6.77% of the phenotypic variation,and it was linked with markerAX-111875352(458.62).
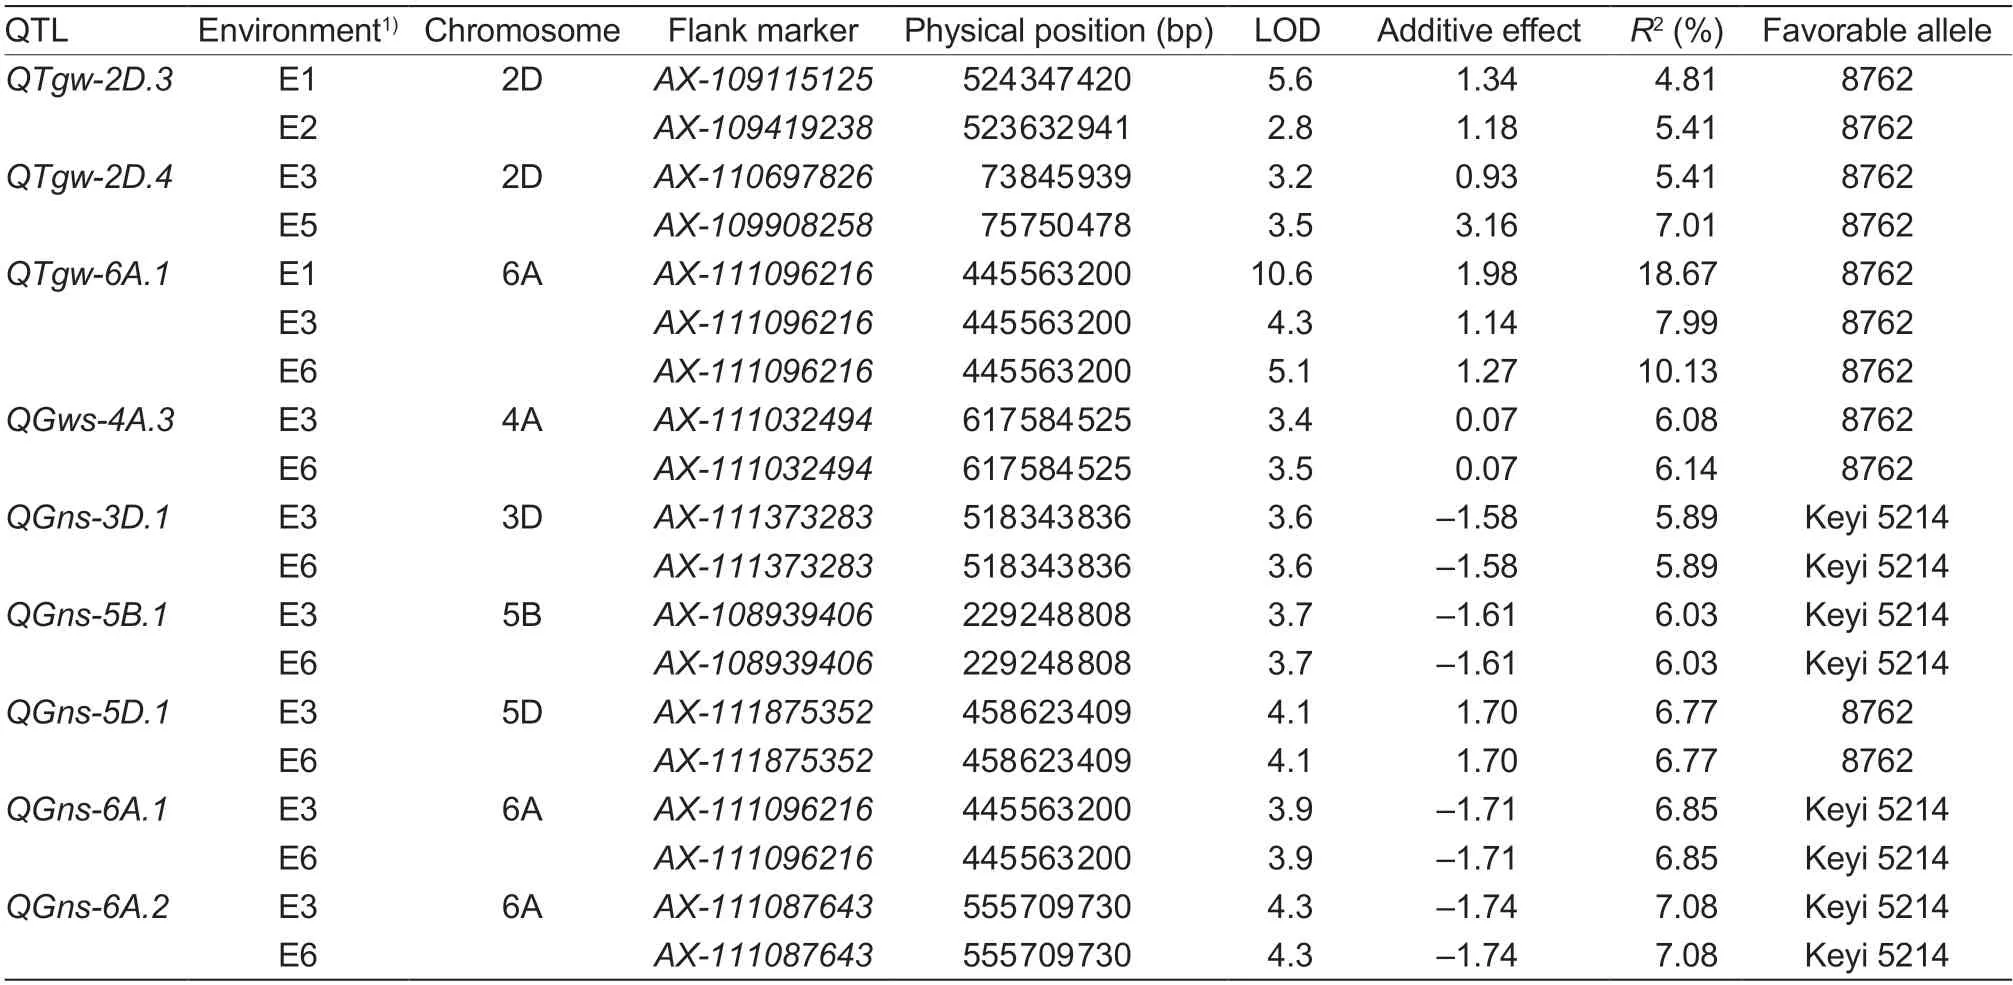
Table 6 Stable QTLs for thousand-grain weight (TGW),grain number per spike (GNS) and grain weight per spike (GWS) detected in the 8762/Keyi 5214 double haploid (DH) population
In addition,10 QTLs for GNS on chromosomes 3A,3B,5A,5D,7A and 7D in the DH lines could be detected only in one environment. The additive effects of these QTLs were 1.26–2.4 grains per spike,explaining 4.08–9.89% of the GNS phenotypic variation.
QTL identification of GWSEleven QTLs for GWS were identified in six environments,although only one stable GWS QTLQGws-4A.3was detected in two environments(Table 6).QGws-4A.3was a QTL linked with markerAX-111032494(617.58 Mb) which explained 6.08–6.14%of the phenotypic variation,with a 0.07-g additive allelic effect from 8762. The other 10 QTLs for GWS on chromosomes 1D,3A,4A,4B,5A,5D and 6B were detected in just one environment,which explained 4.86–8.82% of the phenotypic variation,and the additive effects for the GWS were 0.06–0.15 g.
4.Discussion
4.1.Genotyping of the DH lines
With the development of next-generation sequencing and SNP gene array techniques,SNPs have been widely utilized for QTL mapping,GWAS and MAS analysis because of their high throughput and resolution (Sunet al.2020;Wanget al.2020;Zhanget al.2021). In this study,the 55K SNP gene array was used to identify the genotypes of DH lines and 18 942 polymorphic SNPs were obtained. A high-density genetic map was constructed for QTL mapping and it could improve the accuracy of QTL mapping,identify smaller QTL intervals and detect minor effect QTLs compared to traditional markers (Panget al.2020;Linet al.2021;Liet al.2022).
Wheat is hexaploid with three sub-genomes A,B,and D. The genetic diversity of wheat is low and the hereditary basis is narrow due to artificial selection. Among the three sub-genomes,the genetic diversity and heredity of the D sub-genome are the lowest and many studies have indicated that the abundance of allelic variation of the three sub-genomes is in the order of B>A>D (Alamerewet al.2004;Youet al.2005). In this study,the genetic diversity of sub-genome B was the highest,followed by sub-genomes A and D. The distribution ratios of SNPs on the A,B and D sub-genomes are 33.3,38.3 and 28.3%,respectively. The results of this study were highly consistent with previous studies.
The genetic diversity imbalance of the common wheat sub-genomes may be related to the origin of hexaploid wheat. The B sub-genome of hexaploid wheat originated from Aegilops,which is cross-pollinated with higher genetic diversity so that the genetic diversity of sub-genome B is higher than A and D (Jiaet al.2021). The A sub-genome of hexaploid wheat is from urartu wheat,and the D sub-genome is fromAegilops tauschii,both of which are self-pollinated,resulting in lower genetic diversity (Appelset al.2018;Zhouet al.2018). In addition,the imbalance of genetic diversity among the sub-genomes may be related to the genome types and numbers of hexaploid wheat. During the evolution of wheat,the A and B sub-genomes have formed many tetraploids,such asTriticumdicoccoides,TriticumdicoccumSchrank,Triticumcarthlicum,Triticum turanicumand durum wheat (Avniet al.2017;Chen Het al.2019). These varieties may cross-fertilize with hexaploid wheat,thus enriching the genetic diversity of the A and B sub-genomes in common wheat (Penget al.2011). However,no tetraploid formation has occurred between the D sub-genome and the A or B subgenomes. This reduced the gene exchange between the D sub-genome and the other two,thus causing lower genetic diversity of the D sub-genome (Dvoraket al.1998). In addition,the selection pressure of subgenome D in the domestication and artificial breeding of hexaploid wheat is higher than those of A and B for many favorable genes,which has resulted in lower genetic diversity in genome D (Avniet al.2017;Zhouet al.2018).
4.2.Relationships between TGW and related traits
TGW is a complex trait influenced by genetics,environmental factors and the interaction of the two. In this study,the best linear unbiased prediction (BLUP)values of TGW,GNS and GWS used to conduct correlation analysis were calculated from the phenotypic data in six planted environments. TGW was significantly negatively correlated with GNS and GWS,while GNS was significantly and positively correlated with GWS at the 0.01 level. These results indicated that the increase of grain weight may cause reductions of GNS and GWS,which was consistent with previous studies (Acreche and Slafer 2006;Gajuet al.2009;Liet al.2019;Calderiniet al.2021).
4.3.Stable QTLs of TGW and related traits
In total,41 QTLs of TGW and related traits were identified while only nine stable QTLs were detected in more than two environments. The results of QTL mapping verified that TGW and related traits were influenced not only by genetic factors but also by environmental factors as well as their interaction.
QTgw-6A.1was a novel QTL expressed stably in three environments and explaining 7.99–18.67% of the phenotypic variation of TGW,indicating that it is a major QTL for wheat yield improvement. A key SNPAX-111096216linked withQTgw-6A.1could be converted into KASP markers for the fine mapping ofQTgw-6A.1and marker-assisted selection ofQTgw-6A.1.QTgw-2D.3was detected on the long arm of chromosome 2D (523.6–524.3 Mb),and its physical position was coincident withQTkw-Ncl-2D.2.QTkw-Ncl-2D.2was linked with SSR markersxgwm539,xcfd168andxwmc41,and the physical positions of these markers in the Chinese Spring reference genome were 513–580 Mb. The physical interval ofQTkw-Ncl-2D.2was much larger than that ofQTgw-2D.3,which suggested that the high density genetic map was able to narrow down the interval of the identified QTLs. Another stable QTL for TGW wasQTgw-2D.4,and two SNPsAX-110697826andAX-109908258(738.45 and 757.51 Mb) were linked with it. But the physical interval was more than 20 Mb,so it was too large to confirm the candidate genes for TGW. Fine mapping ofQTgw-2D.4should be conducted and the linkage SNP markers could be used in further studies.
QGws-4A.3was the sole stable QTL for GWS identified on 617.58 Mb of chromosome 4A in E3 and E6,and it has been detected in several previous studies.QGwe.ipk-4Awas shown to be a major QTL (LOD>3) for grain wheat per ear (GWE,equal to GWS) on chromosome 4A(flanked byxgwm549andxbcd1670,physical interval 601.02–630.89 Mb) that was detected in the ‘International Triticeae Mapping Initiative’ mapping population comprised of 114 recombinant inbred lines (Börneret al.2002). In a recent study,a meta-QTL namedMQTL-4A-5on 616.59–626.75 Mb of chromosome 4A was found to be comprised of four QTLs linked with grain weight and grain number (Yanget al.2021). The physical position ofQGws-4A.3was found to be in the interval ofQGwe.ipk-4AandMQTL-4A-5,indicating that these QTLs might be the same. In this study,a novel SNP markerAX-11102494could be converted into high-throughput markers for candidate gene identification and markerassisted selection breeding.
In this study,QGns-3D.1was a stable QTL detected on chromosome 3DL (518.34 Mb),and it was previously reported as a QTL for spikelet number per spike linked with markersxgwm383andxgwm664(532.19 and 512.97 Mb)and a QTL for ears per plant/TGW between markersXbarc42–Xgwm383(499.76–532.19 Mb) (Quarrieet al.2005;Liuet al.2006).QGns-5D.1was a stable QTL identified on chromosome 5D and the physical position of its flanking markerAX-111875352was 458 Mb. Many QTLs for GNS and related traits have been reported on the 439–473 Mb interval of chromosome 5D in previous studies,andQGns-5D.1was in the physical interval ofQSsn.sdau-5Dwith flanking markersXbarc320–Xwmc215(Quarrieet al.2005;Liuet al.2006;Czyczyło-Myszaet al.2011;Denget al.2011;Denget al.2017). The physical position ofQGns-6A.2was 555.71 Mb on chromosome 6A,which was consistent with the 549.5–595.37 Mb interval ofQKpsl.aww-6A(flanked by markersXwmc256–Xgwm169)reported in previous studies (Bennettet al.2012).QGns-6A.1was a novel QTL for GNS and its position was the same asQTgw-6A.1. These two QTLs have different effects on TGW and GNS. The same scenario was observed forQKpsl.aww-6AandQTkw.aww-6A,with increased TGW and reduced GNS,which indicated a negative correlation between TGW and GNS once again (Bennettet al.2012). In addition,a novel QTL for GNS,QGns-5B.1,was detected on the short arm of chromosome 5B (229.24 Mb),which could provide new gene resources and markers for yield improvement in wheat.
5.Conclusion
Based on the wheat SNP gene array,a high-density genetic map has been constructed for the 8762/Keyi 5214 DH lines. Forty-one QTLs for TGW,GWS and GNS were identified by CIM using the genetic map and phenotypic data in six environments. Nine stable QTLs were detected in more than two environments and three of these QTLs were novel. The DH lines,QTLs and flanking markers could provide favorable gene resources,markers and germplasms for cloning genes and marker-assisted selection breeding for the improvement of wheat yield.
Acknowledgements
This work was supported by the Henan Modern Agricultural Industrial Technology System Construction,China (HARS-22-1-Z7).
Declaration of competing interest
The authors declare that they have no conflict of interest.
 Journal of Integrative Agriculture2023年10期
- Journal of Integrative Agriculture的其它文章
- The association between the risk of diabetes and white rice consumption in China: Existing knowledge and new research directions from the crop perspective
- Linking atmospheric emission and deposition to accumulation of soil cadmium in the Middle-Lower Yangtze Plain,China
- Genome-wide association study for numbers of vertebrae in Dezhou donkey population reveals new candidate genes
- Are vulnerable farmers more easily influenced? Heterogeneous effects of lnternet use on the adoption of integrated pest management
- lnfluences of large-scale farming on carbon emissions from cropping:Evidence from China
- Spatio-temporal variations in trends of vegetation and drought changes in relation to climate variability from 1982 to 2019 based on remote sensing data from East Asia